The Controls
Count of Calls vs. Mean Days to Close
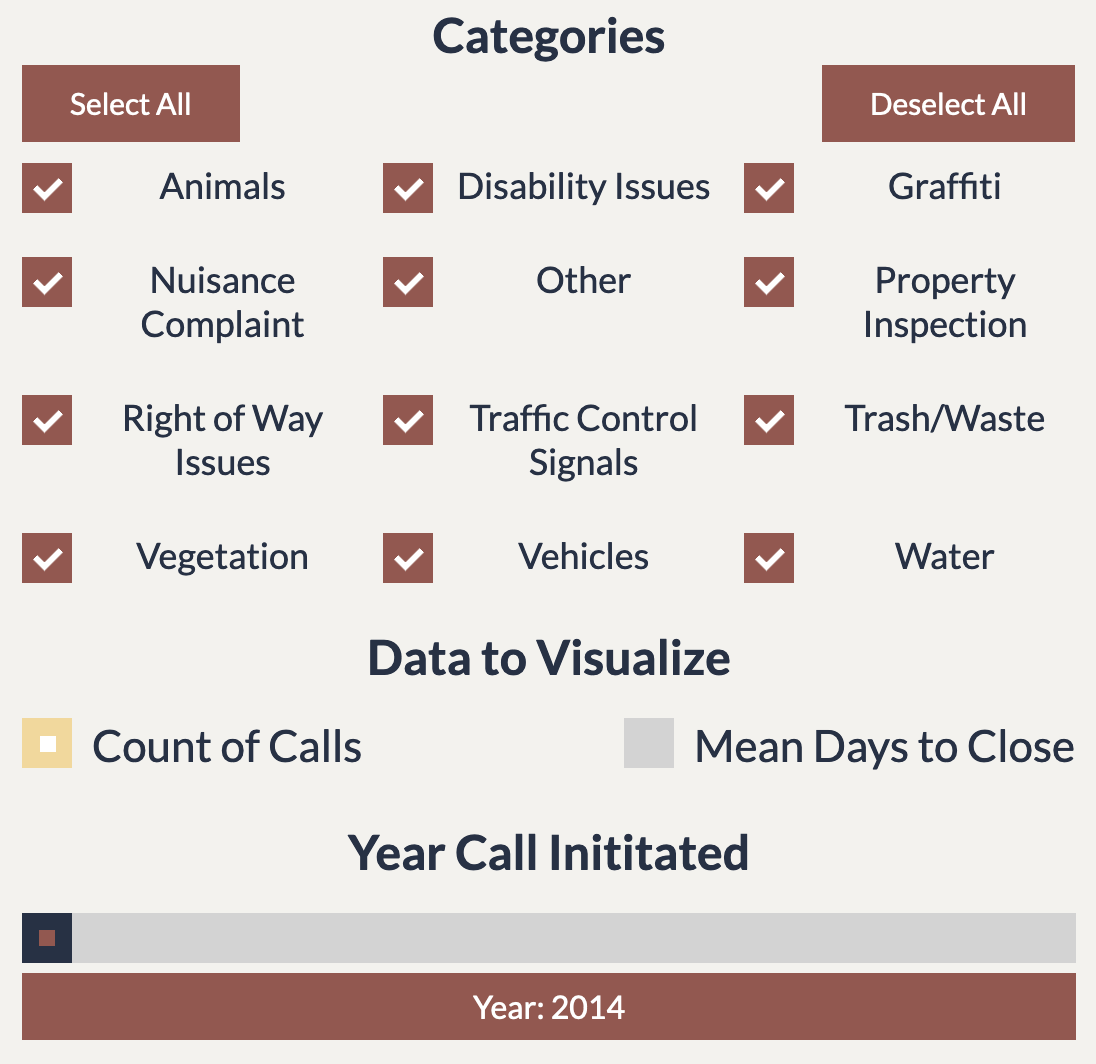
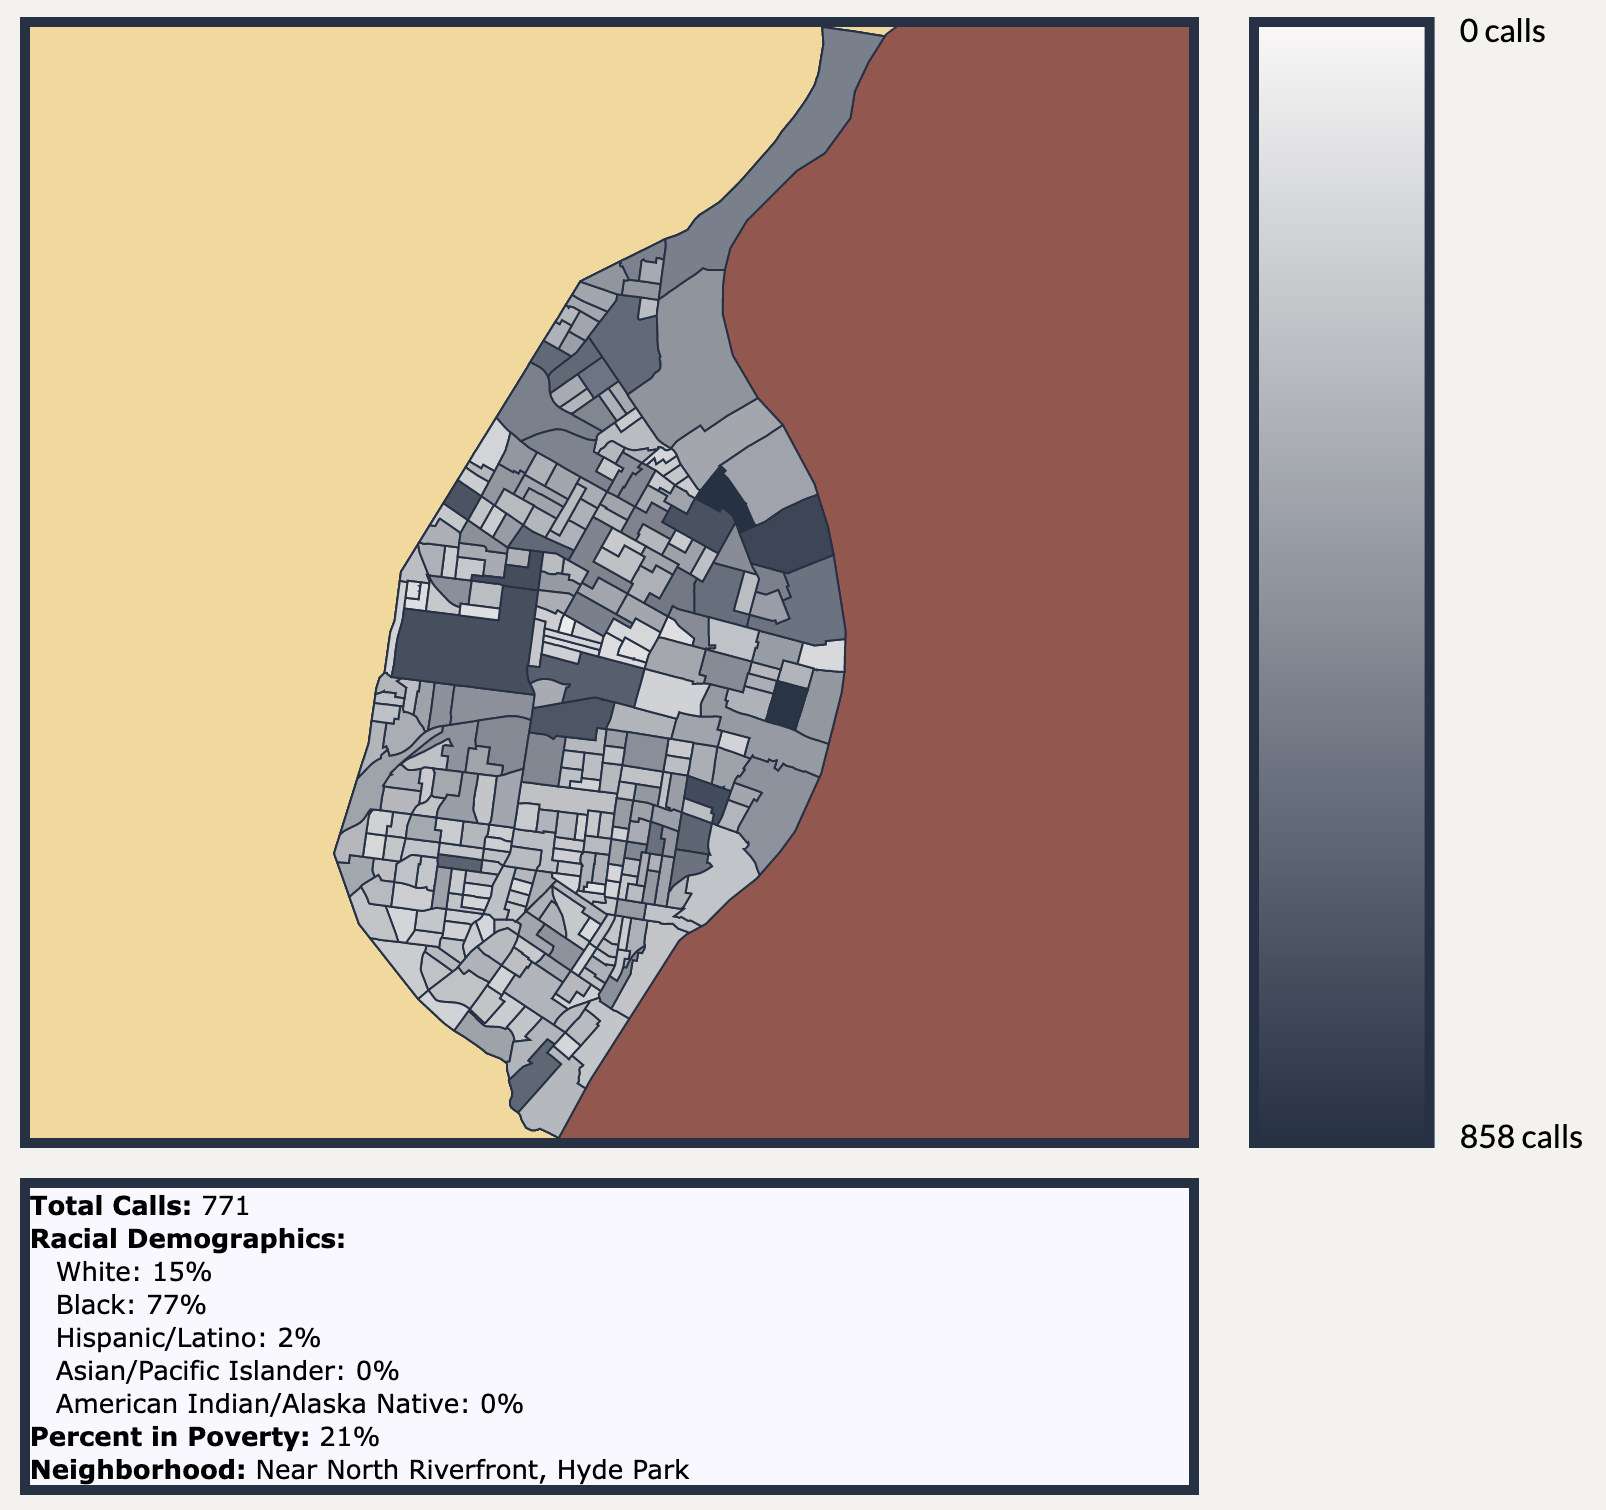
There are two radio buttons that toggle the type of data represented by the map. By clicking the radio button labelled "Count of Calls", the map displays the values of the number of service calls made in each block group. By clicking the radio button lablled "Mean Days to Close", the map displays the average time (in days) recorded to close or resolve the case corresponding to the service call that was made.
Categories
Calls for service are divided into twelve different groups, listed below. You can select or deselect each category based on whether or not you want to include that data. If call counts are being visualized, then calls are added across checked categories. If average time to call closure is being visualized, the time to closure is averaged checked categories. The "Select All" and "Deselect All" buttons are there to expedite the checking process. Categories are as follows:
- Waste - This includes Debris, Community Sanitation, and Recycling.
- Vegetation - This includes Trees, Weeds, and Grass.
- Traffic Control Signals - This includes Street Lights/Signs and Traffic Signals.
- Property Inspection - This includes possible building violations or health violations.
- Right of Way Issues - This includes street or alley problems, sidewalk repair, potholes, street cleanings, etc.
- Graffiti - This includes vandalism of businesses, community centers, and residential areas.
- Animals - This includes stray animals, dangerous animals, and owner non-compliance with animal laws.
- Vehicles - This includes parking violations, tickets, etc.
- Other - This includes Information Calls, Fire Safety, Food Control, Parks, Air Pollution, Discrimination, etc.
- Water - This includes running water, open hydrants, and water quality issues.
- Disability Issues - This includes concerns on disabled parking, ADA accessibility of public buildings and programs, etc.
- Nuisance Complaint - A continuing or recurring act or physical condition which is made by any owner on any premises which is injurious or detrimental to the health, safety, welfare, or convenience of the inhabitants of University City.
Year Slider
Drag slider to progress through the years from 2014 to 2022. Doing this updates the map data to only display the number of calls or average days to close that were made during that corresponding year.