With the Olympic games happening this past summer, we noticed that mainstream coverage of the
Olympics in the US typically covers only a few sports, and the reporters only talk about our top
athletes in each one. We rarely have the opportunity to watch the sports outside of the popular ones
that the US tends to do well in. We are interested in gathering data on all Olympic sports and
learning about things like which countries have historically been the most dominant in each sport,
how countries have ranked over Olympic history, and whether there is any home field advantage when
hosting the Olympics.
We saw the Olympics this last summer, and were all pretty disappointed by NBC coverage. One of the
people from our high school was in a heat at the Olympics, and they skipped showing it to show an
interview with an athlete which really could have been shown at any other time! It got us thinking -
what does Olympic coverage look like in other countries? Do they follow the same sports, or is it
different? This line of thinking lead to our questions below.
- Which countries are the most dominant (i.e. most medals) in each sport?
- Which sport is each country the best at?
- Is there a home field advantage? Do countries do better than their average when they are the
ones hosting the Olympics?
- Who is the best individual athlete (most medals) in each sport?
We are curious about whether these will line up with typical Olympic sports coverage in the US -
for example, Track & Field and Swimming dominate the prime-time coverage. Is it because we are
the most dominant in these sports, or does that at least play a factor? For the last question,
we feel like it is pretty clear in some well-covered sports - for example, Michael Phelps is
pretty clearly the most successful Olympic swimmer (and Olympic athlete) of all time. However,
we don’t know for most of the other sports, and we think it would be nice to have a way to view
this data for any Olympic sport.
Milestone 1 Update: our questions haven't evolved as of yet, as we've been primarily focused on
implementing the basic webpage structure and scraping the data. Evaluating our questions against
a volatile data set seemed hopeless, as we've yet to perform our full exploratory analysis.
We've decided on purely scraping the data sent to the frontend of
olympics.com, as it appears to be a comprehensive and
authoritative source on the official olympic games. This, however, comes with a price: it was not
intended to be used as a data-scraping API.
By analyzing the network traffic upon loading olympics.com,
one will notice a large amount of data being transferred across multiple json files. In particular,
if one visits the results section for an event (say,
Tokyo 2020's Men's 100m Freestyle
, there is a backend call to the page:
https://olympics.com/_next/data/{hash_key}/en/mobile/olympic-games/{game_slug}/results/{event_slug}.json
The hash_key appears to change every day, while the game_slug is a
slugified version of the game's location and year (i.e., tokyo-2020). The event_slug
changes in a predictable way between events.
So far, we've been able to scrape all of the Summer games' data; however, we've not been able to
collect all the athletes associated with team sports as of yet. As of now, all of this data is
stored in /data/games/. We then wrote Python scripts to process the data into smaller
json files that contain data relevant to our visualizations (stored in /data_processing/).
Winter data has also been scraped, but not processed. See the data-wrangling branch
for those files.
The current structure of our data will remain the same.
Once we scraped the medal data for each Olympic games (viewable in data/games), we discussed the best ways
to structure our data for straightforward visualizations. We generated files like data/country_medals.json
first, which made it easy to explore medal counts and decide on what visualization styles would work best.
We did know what the data structure would generally be like ahead of time, so there was not a ton of EDA for
us to do outside of just applying the data to our existing designs. Once we got some of the basic bar charts
up and running, we thought it would be nice to be able to keep the bars but be able to visualize the medal
types as well, resulting in the stacked bar charts that are now featured on the countries/sports pages.
Modifications made to our proposed designs thus far:
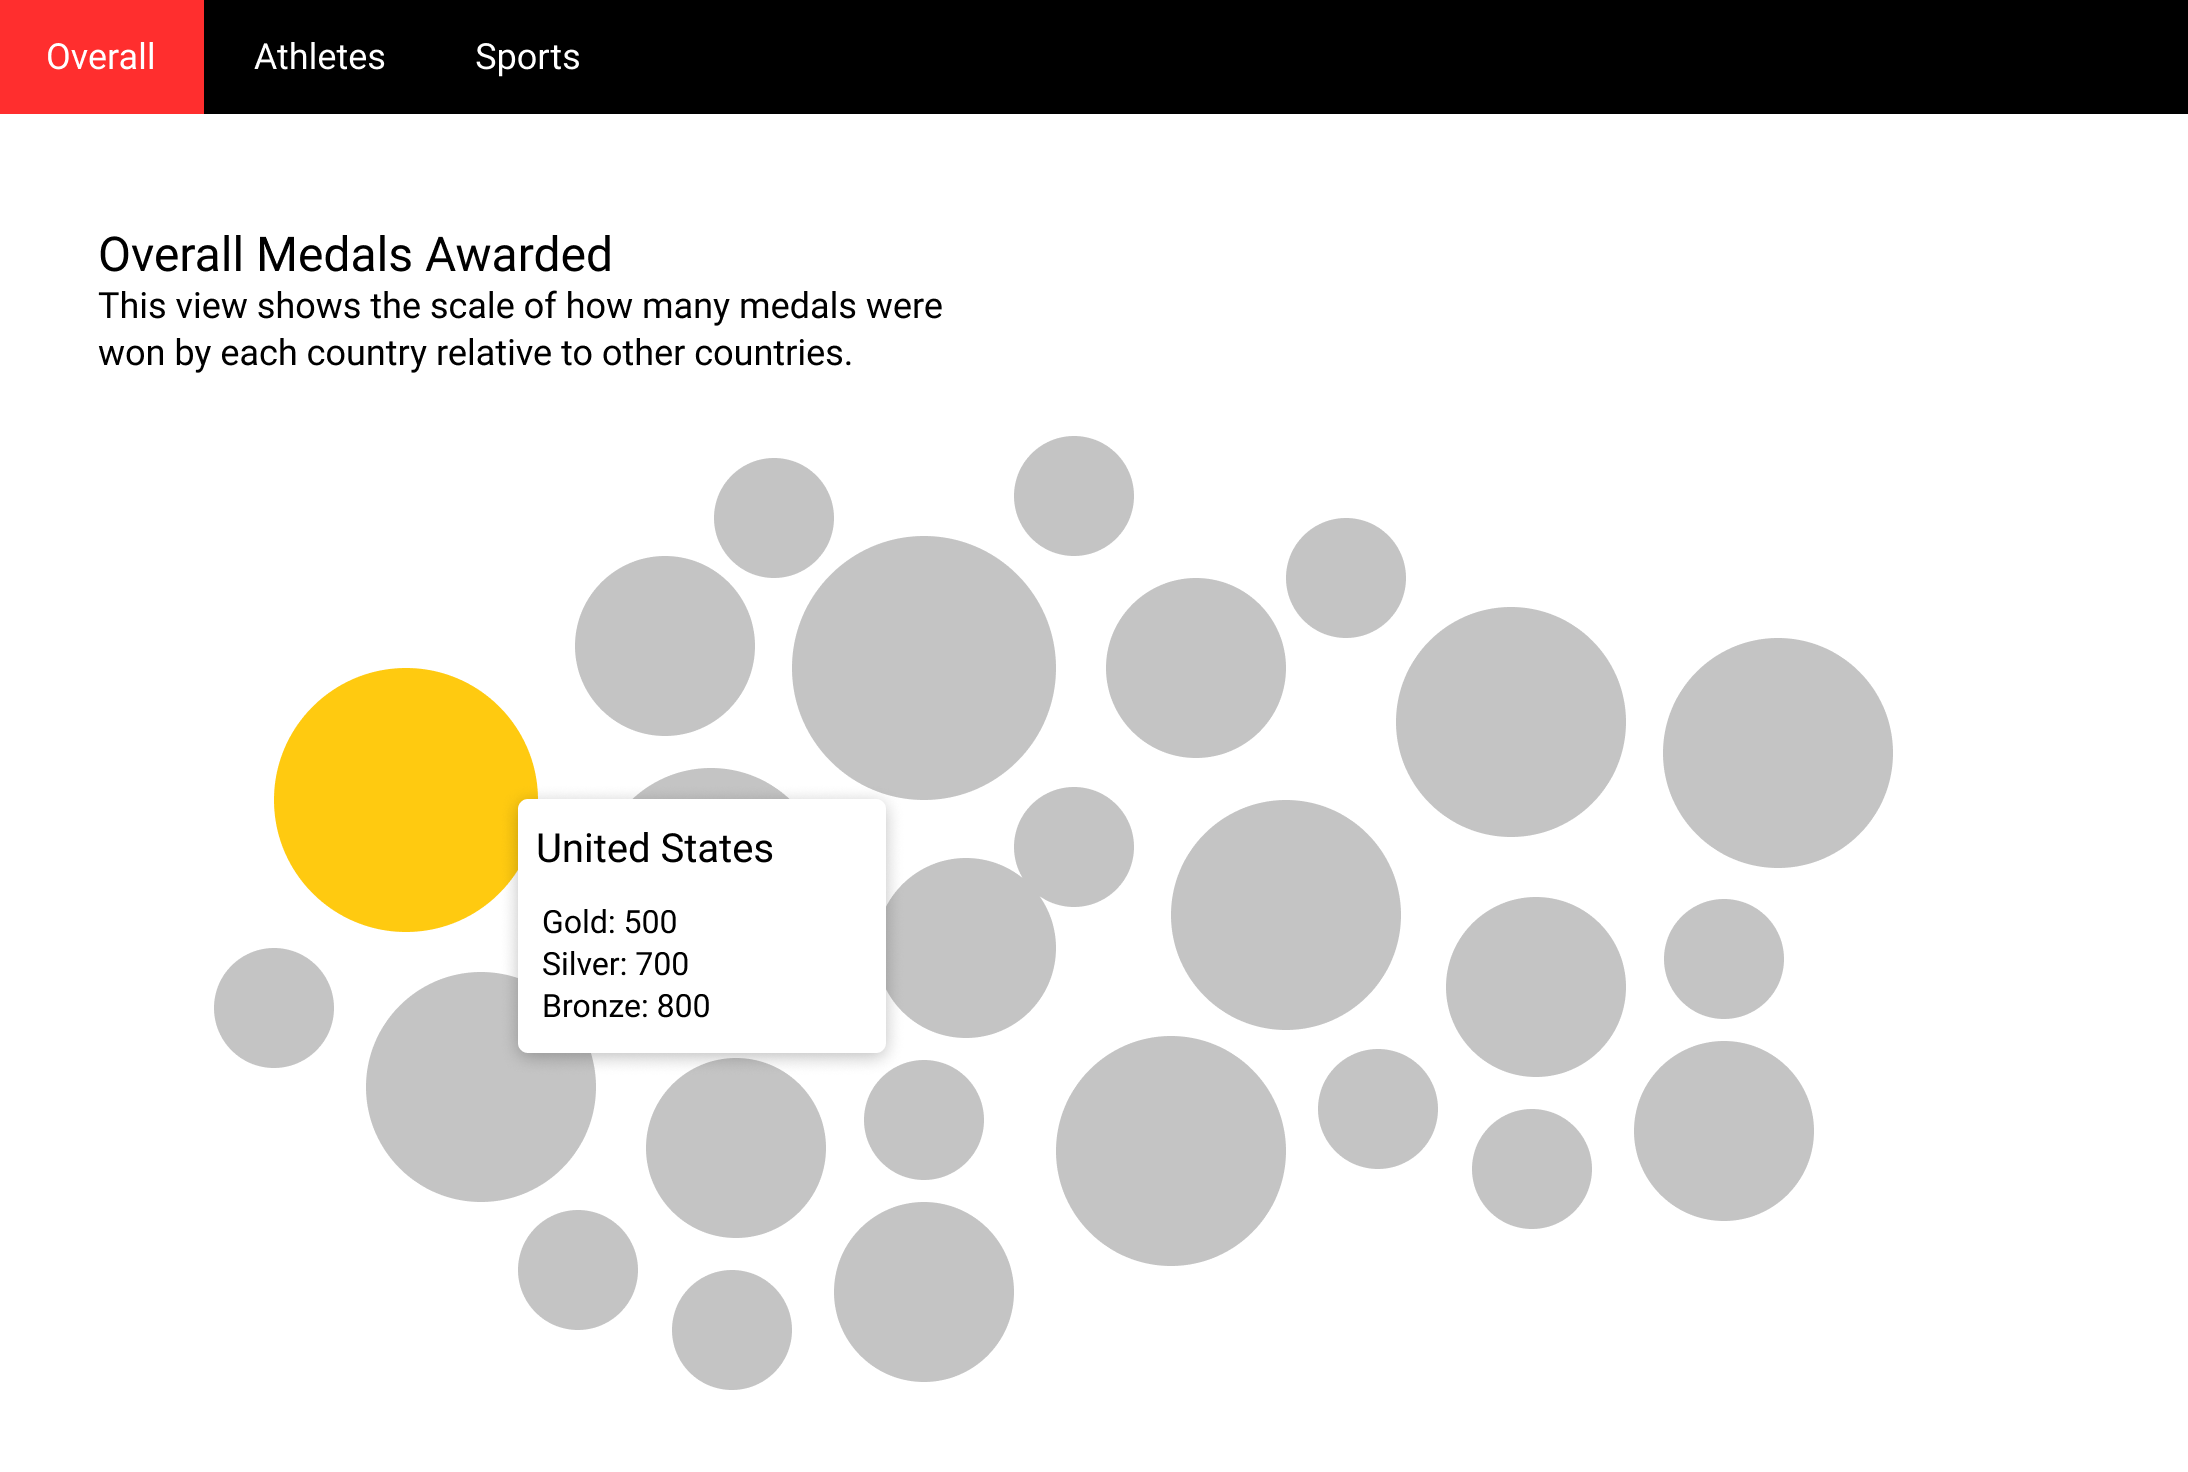
- On the world map page, we've shifted to using tool tips combined with mouse hovers,
instead of using circles overlaid atop the map. We feel this is still intuitive to use,
while reducing the total clutter on the screen.
- We've included a chart for the Medals Won Each Year on the individual country page.
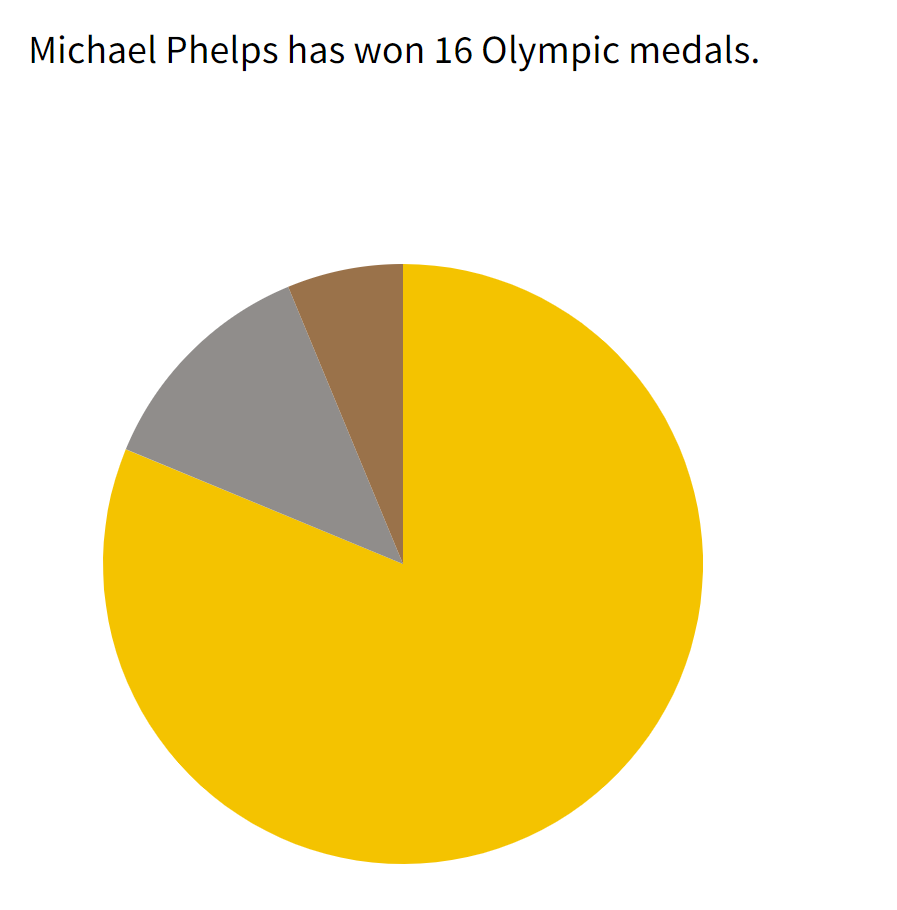
- On the Athlete page, we switched to using a pie chart to show their medal proportions. This is accompanied
by a text summary of their medals earned so that the data is quick to see at a glance but is also complete in writing.
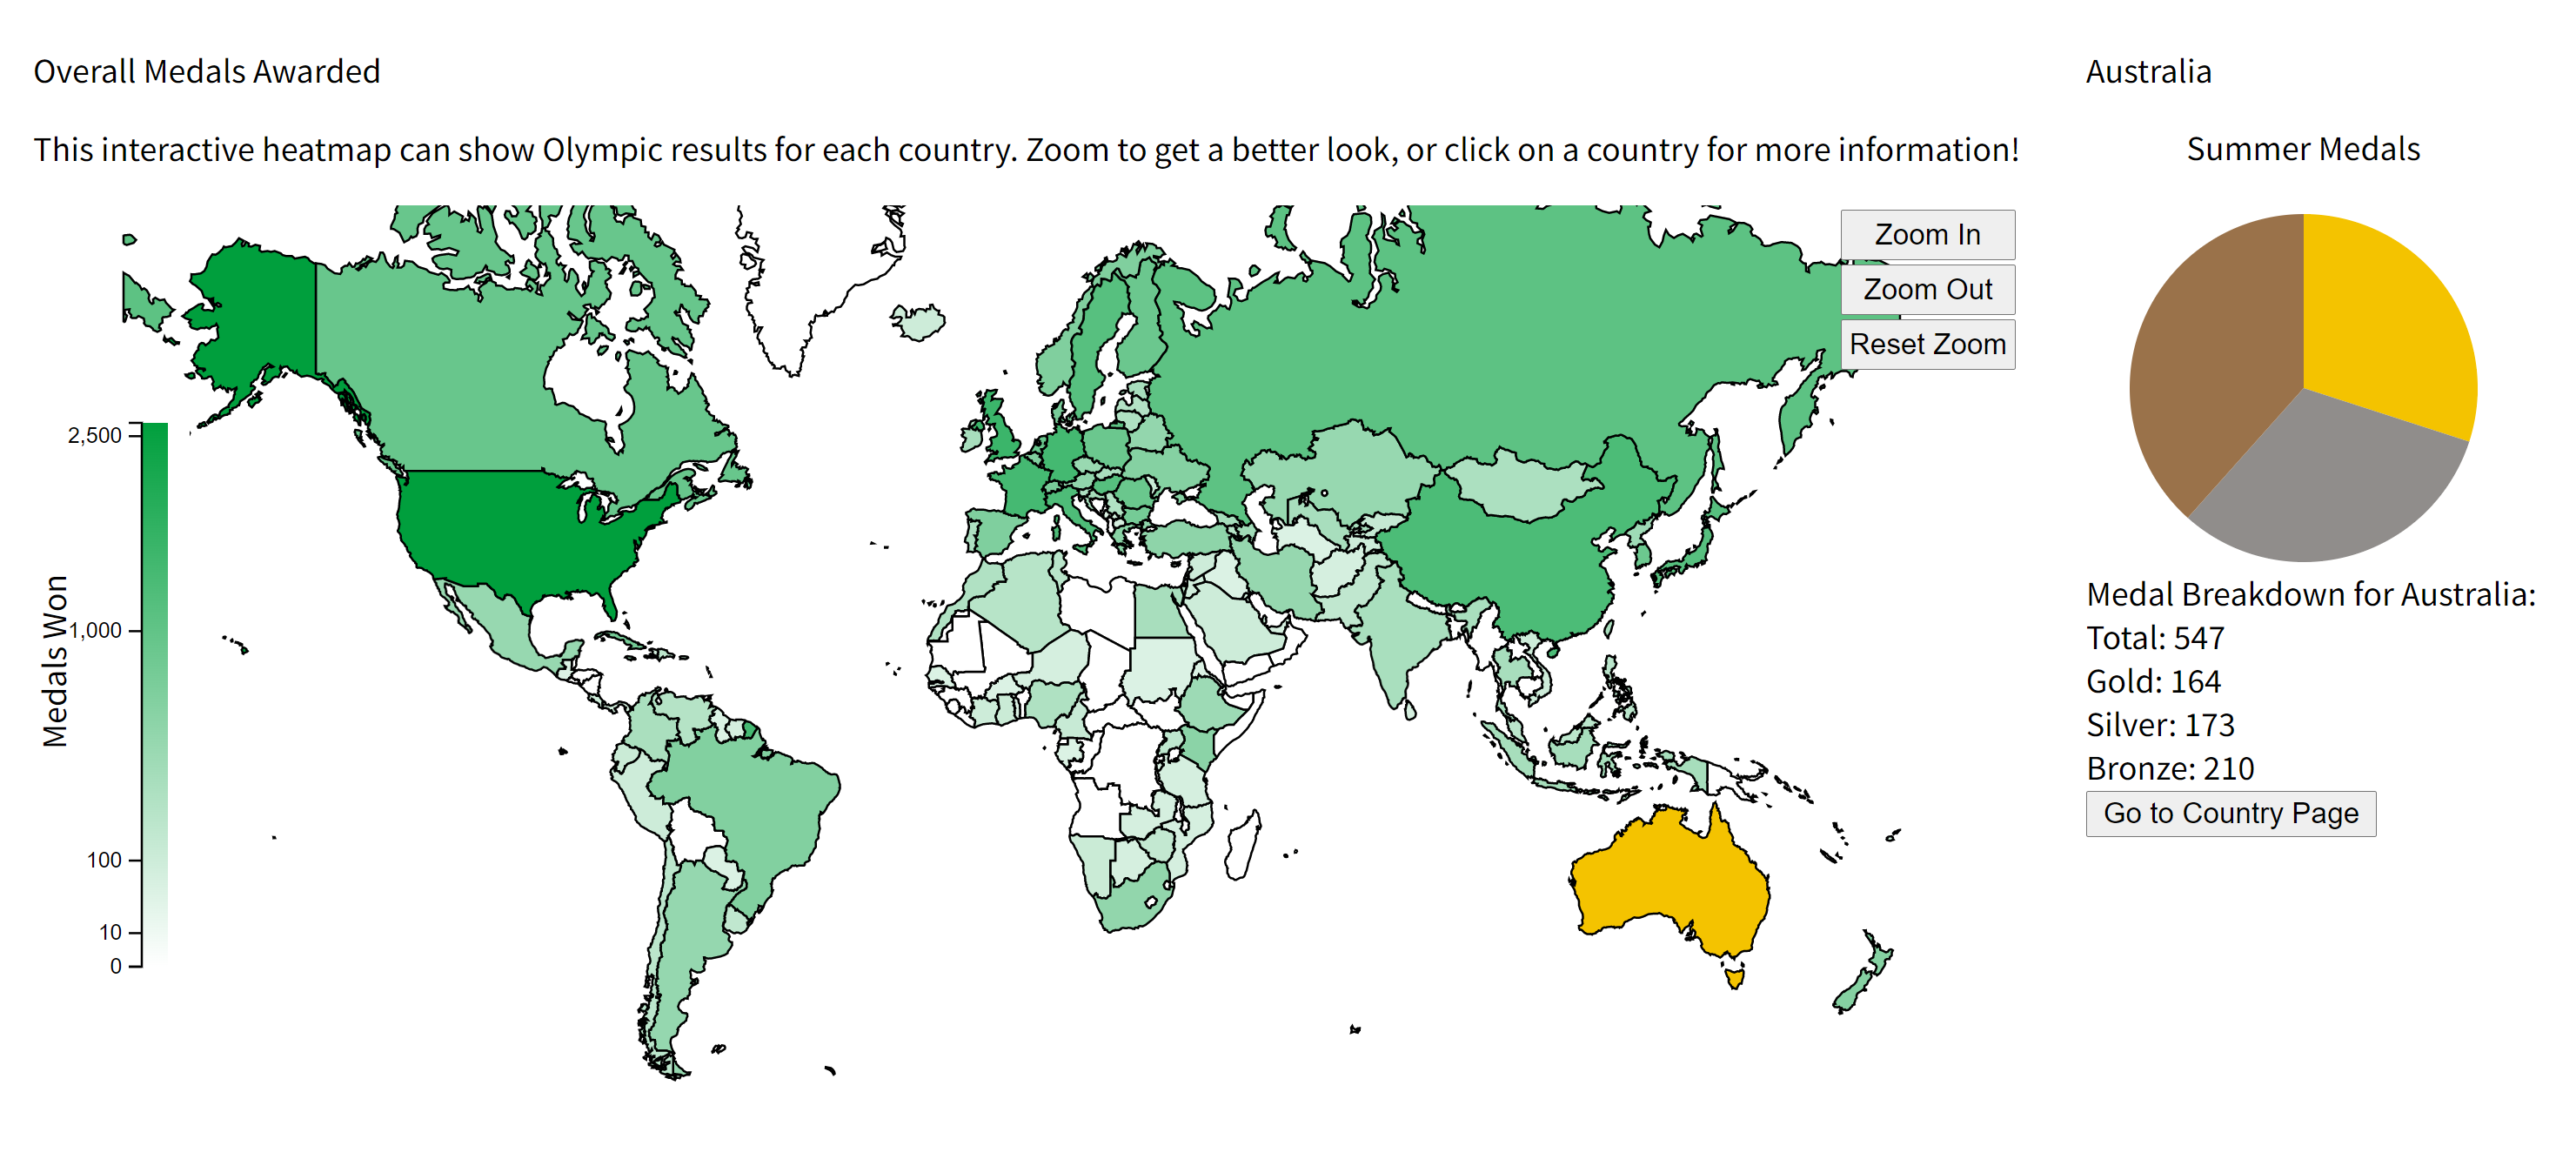
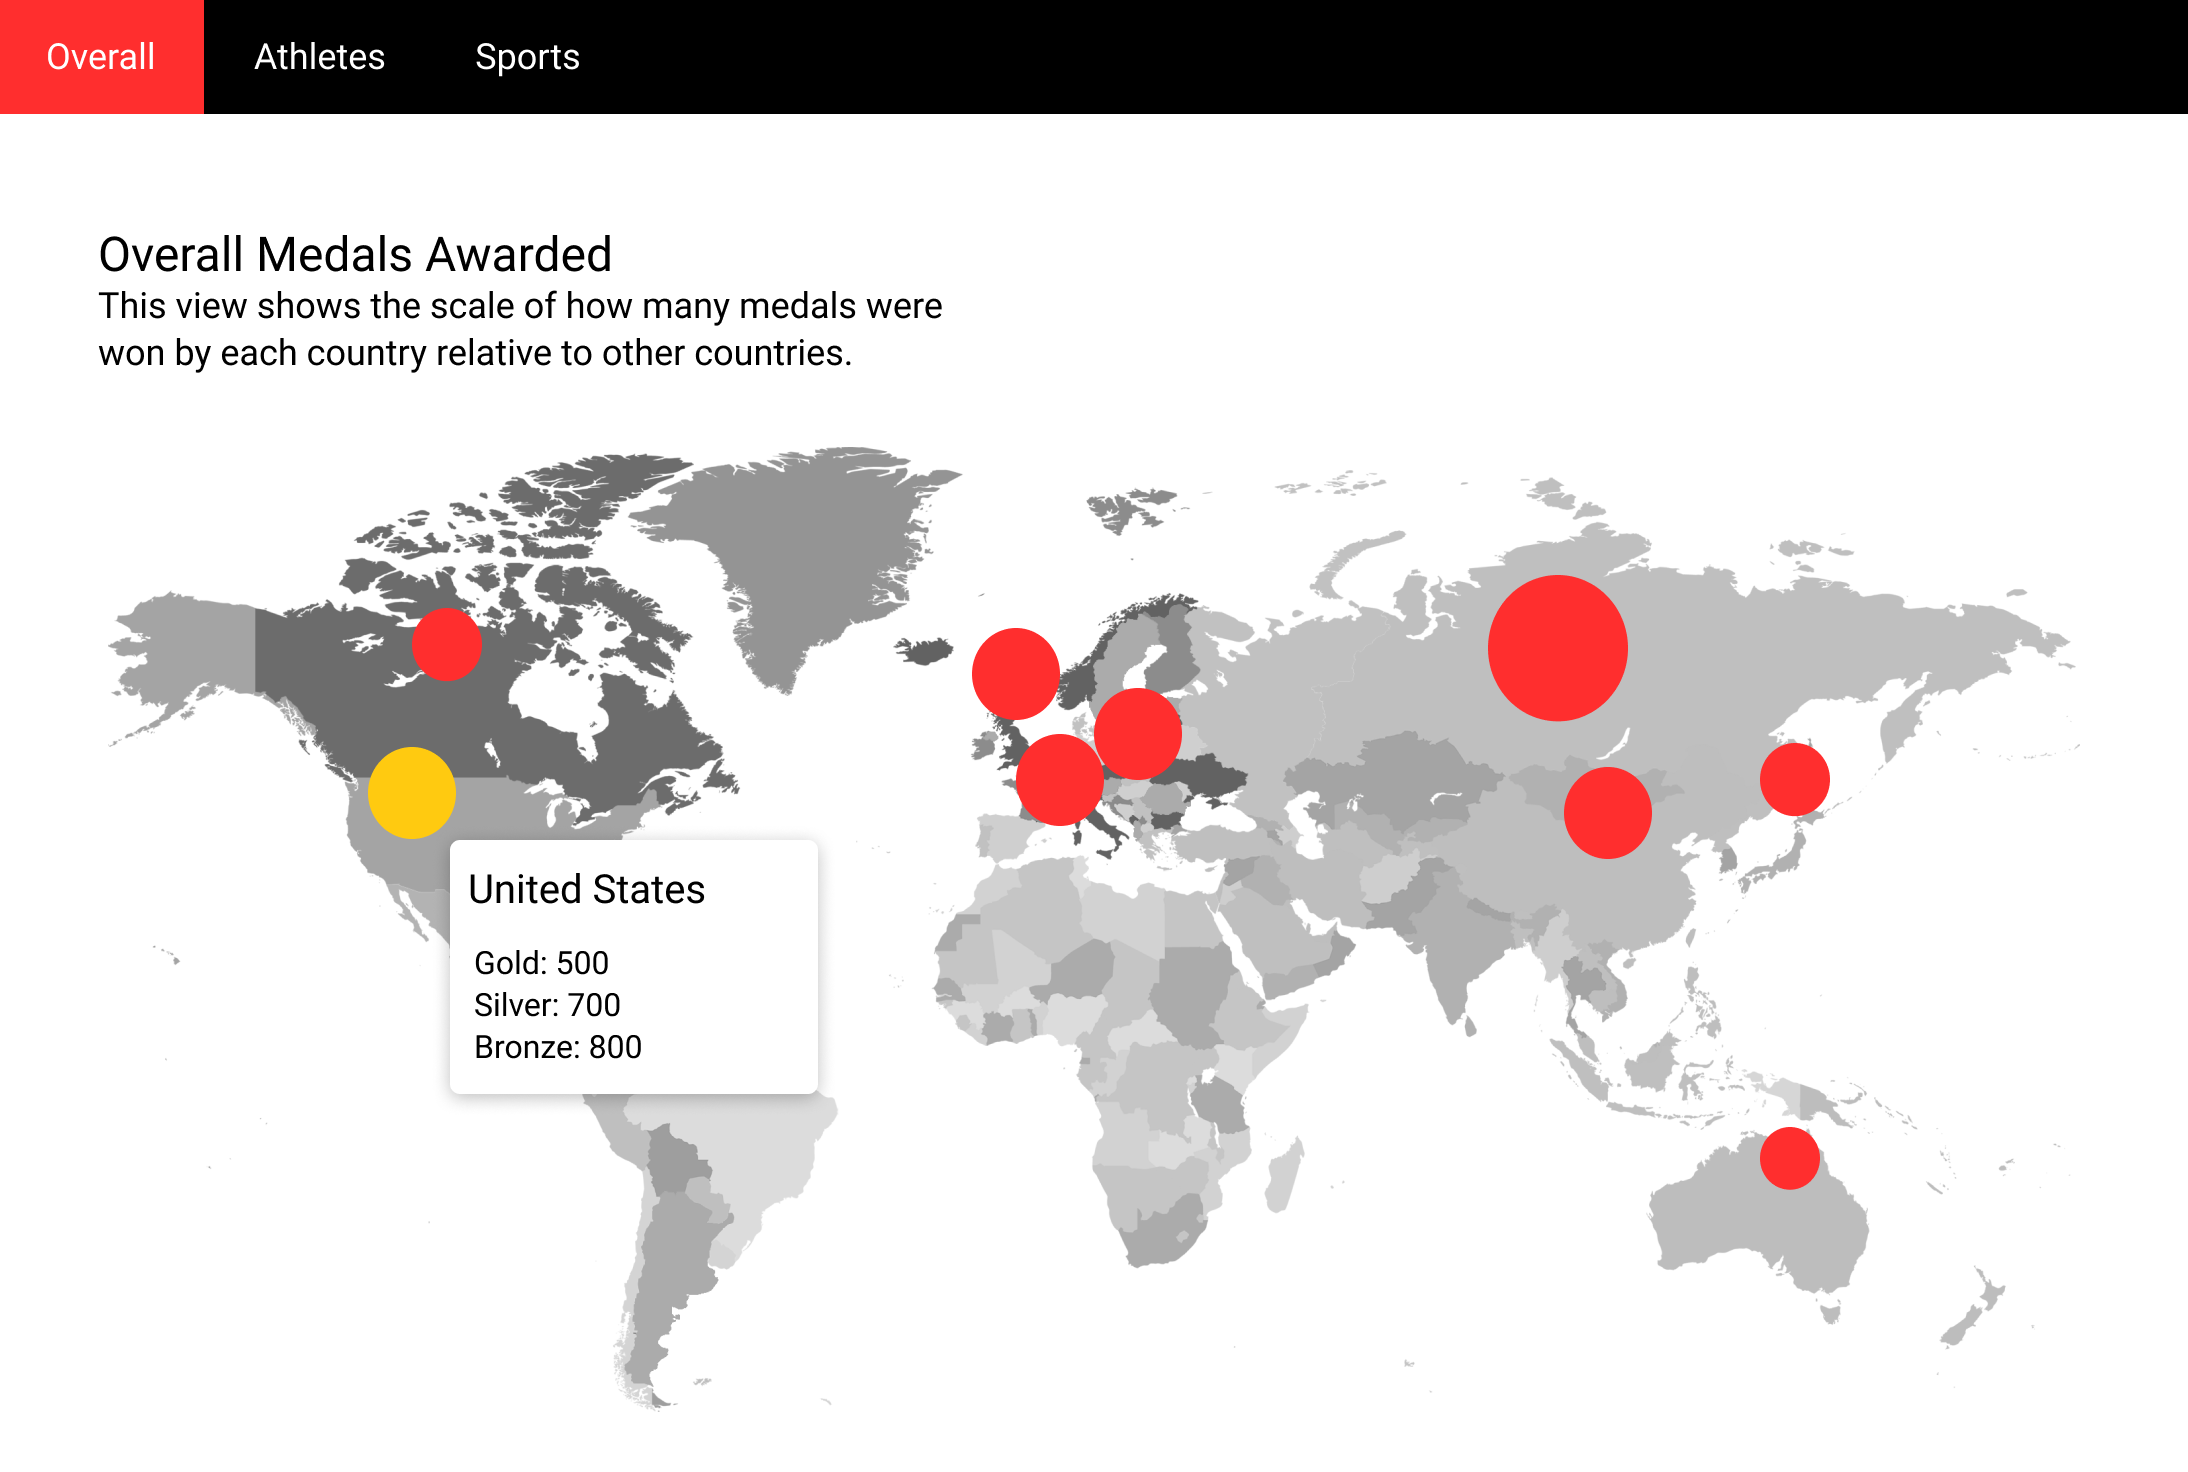
- The world map has become a heatmap (change from MS1 -> MS2) to show which countries have the most medals at a glance.
It uses a 4th root scale, since a square root scale was still too stark of a difference (the USA has tons of medals),
but a log scale looked too uniform.
- We also added a pie chart for the medals won to the map page so that there is something to view when a country is clicked.
This visualization should help show their proportions, and the accompanying text makes the totals clear. There is a space
for the winter olympic medals pie chart to go as well, if we get the data.
- On relevant bar charts in the sport and country views, we made the bar charts into stacked bar charts. This preserves
the original design of being able to see the totals, but also shows the distribution of medals for each sport or
country, which we thought was a nice bit of extra data to be showing.
Figma Link
All of the below panels can be viewed at
this Figma link
.
Example Designs
Initial Sketches
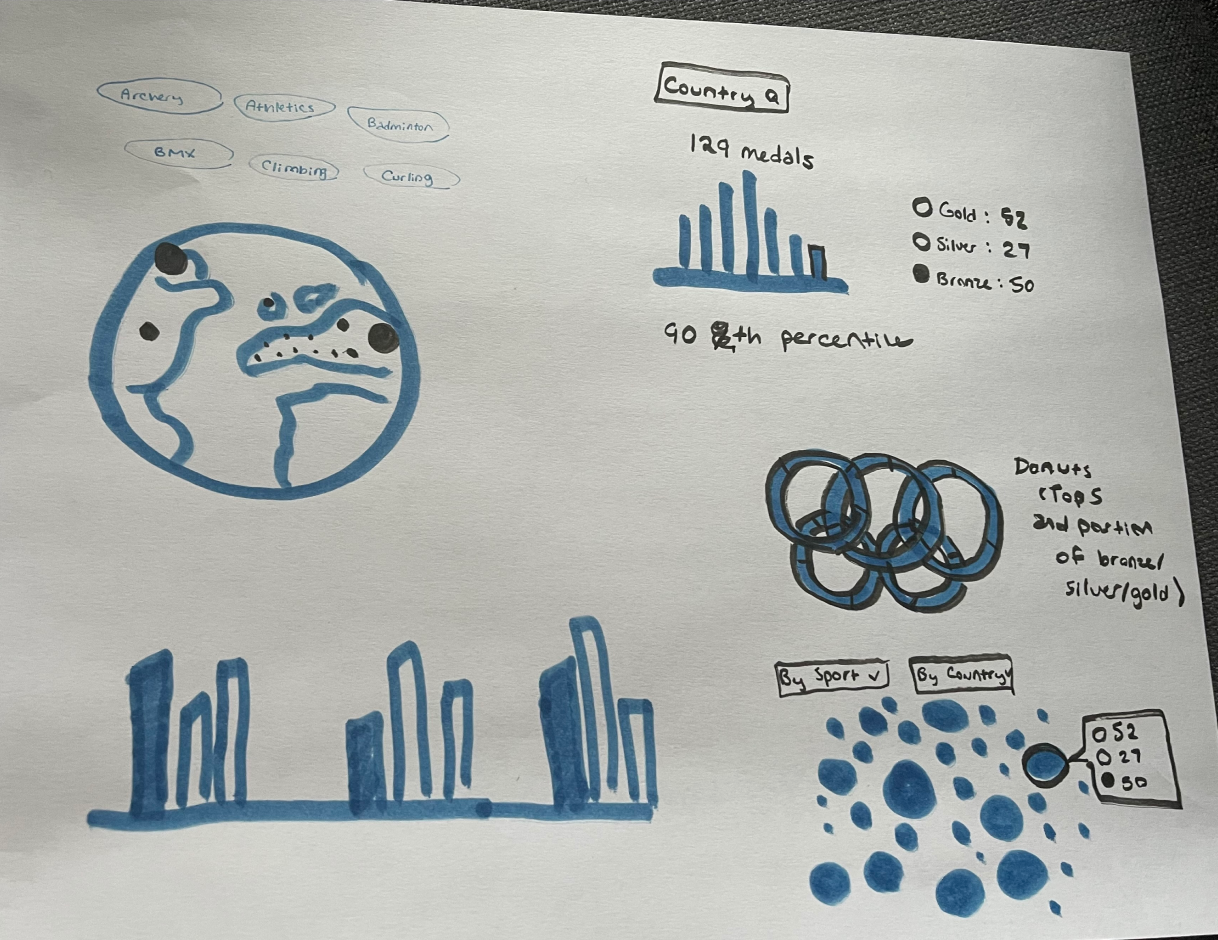
Ideas
First Sport Result Design
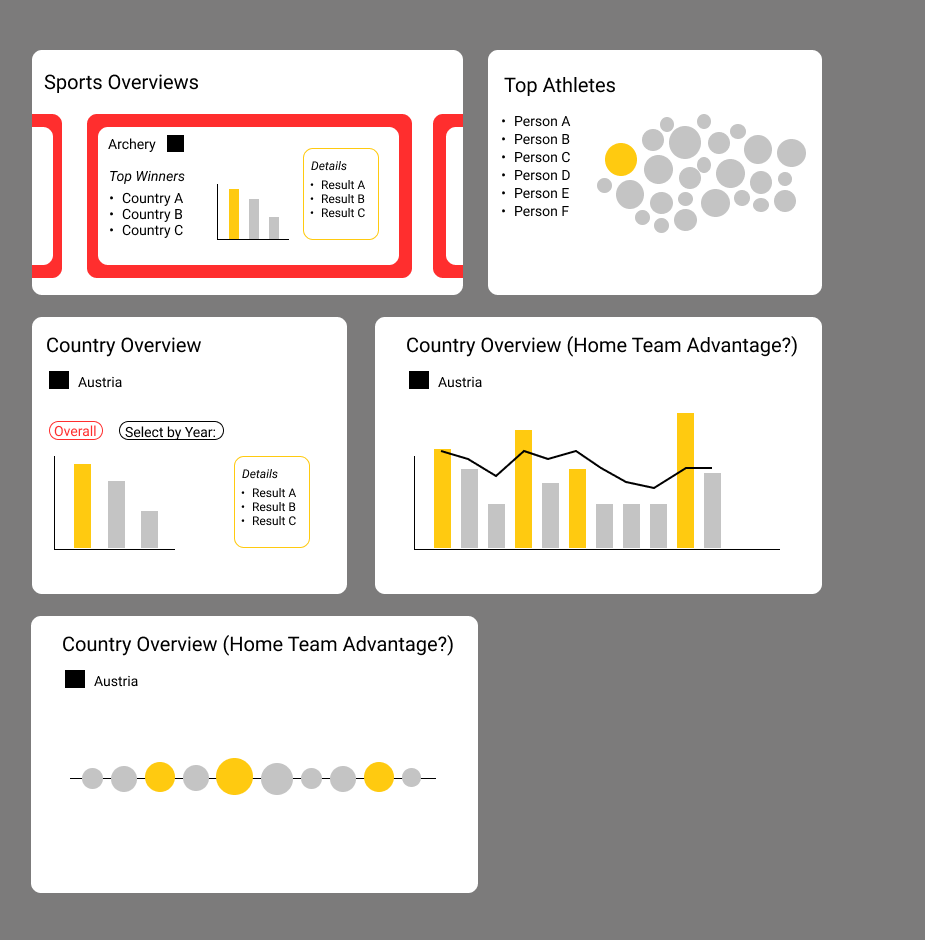
Example Designs
Second Sport Result Design
Third Overall Design
First Athlete Design
Second Athlete Design
Second Overall Design
Final Designs
Final Overall Design
Final Athlete Design
Final Sport Results Design
Final Country Results Design
For the quick version of the intent and functionality, view the about page.
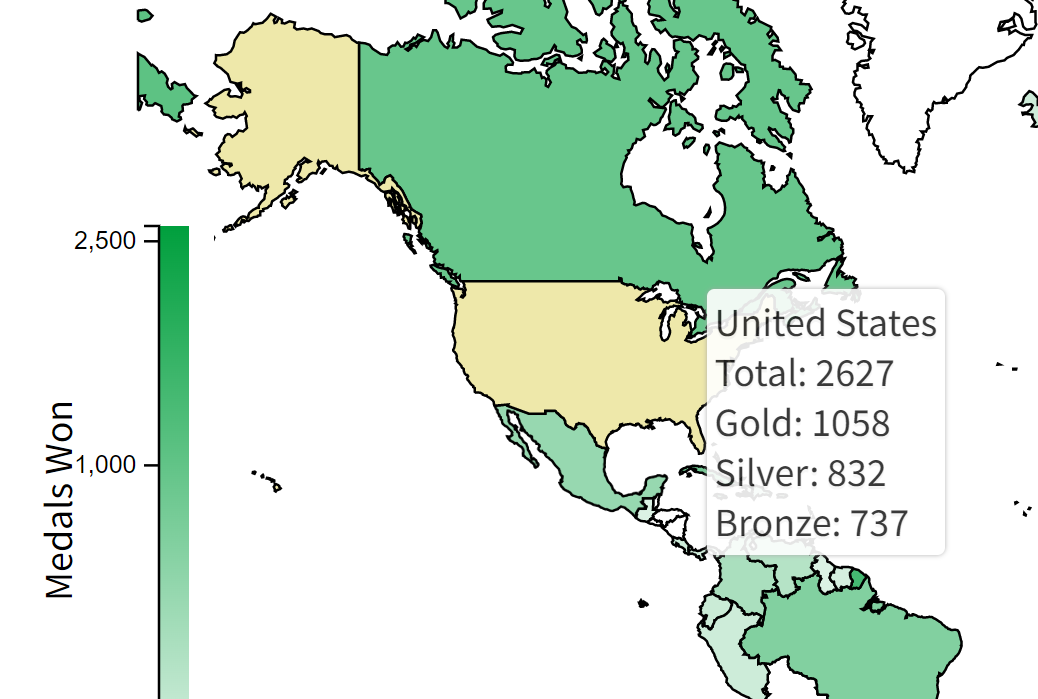
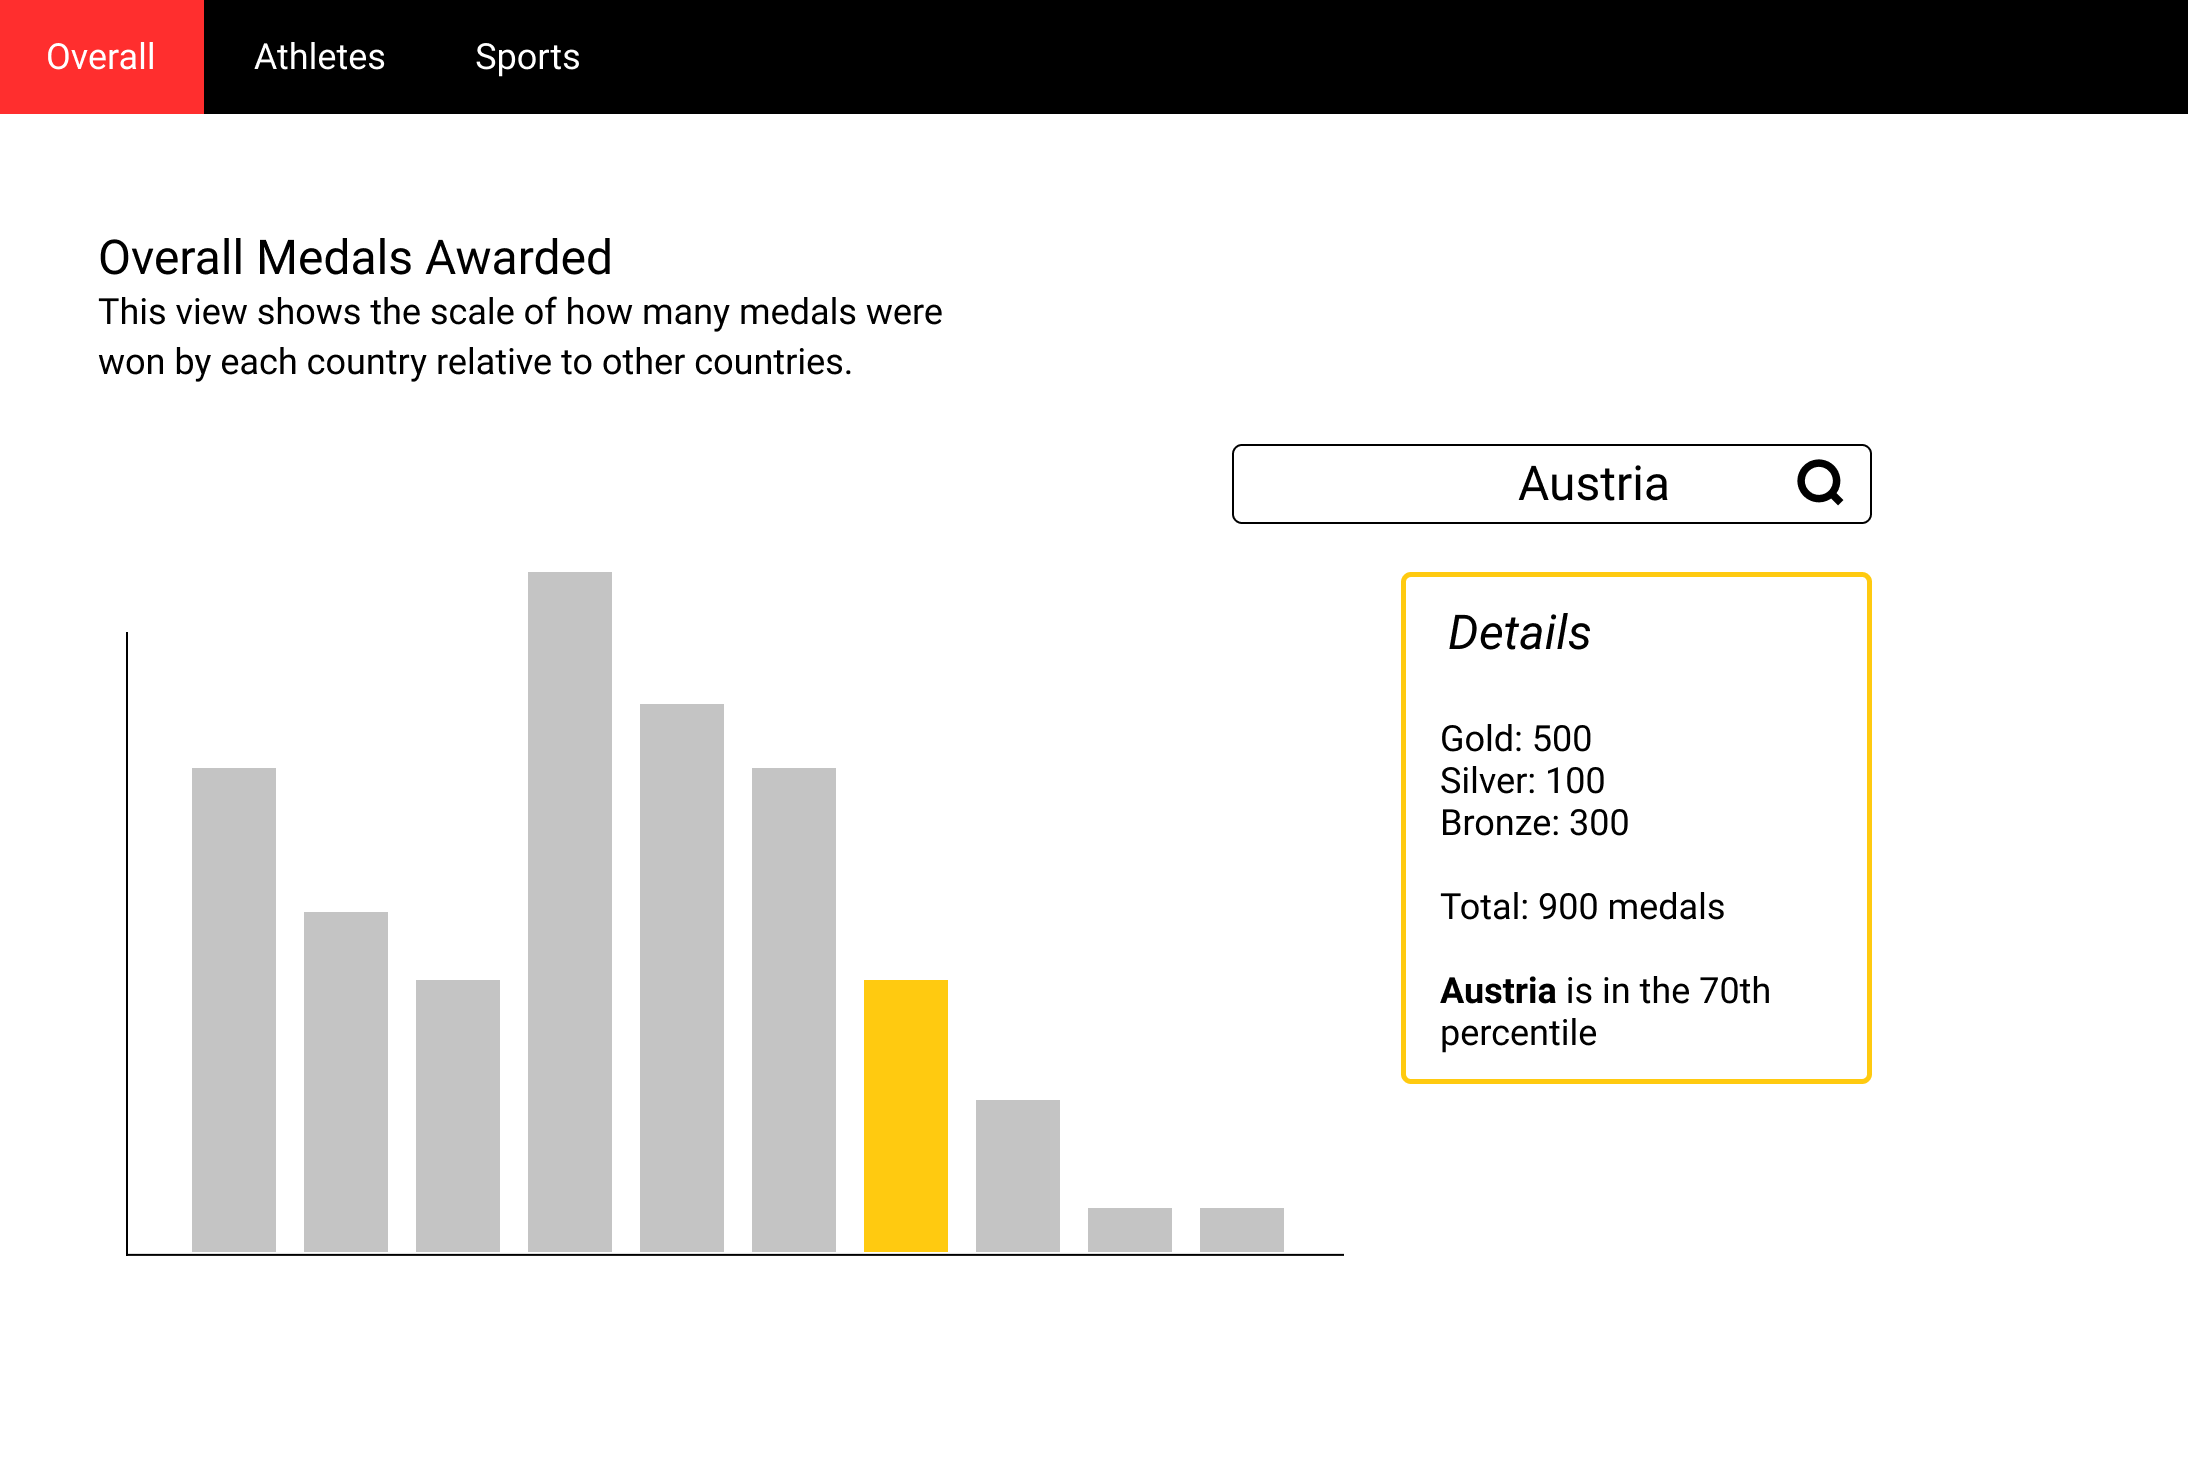
Heatmap (landing page):
The goal of the heatmap is to show users an easily-digestable at-a-glance view of how countries perform in
the Olympics, and provide an easy way to dive deeper into the data. Images (below) show three examples of
heatmap features: Hovering, zooming, and clicking.
On hover, the individual medal counts and total medals earned are shown. The map itself is colored by total
medals won to give a quick gauge of general Olympic performance, but the tooltip lets users see more in-depth
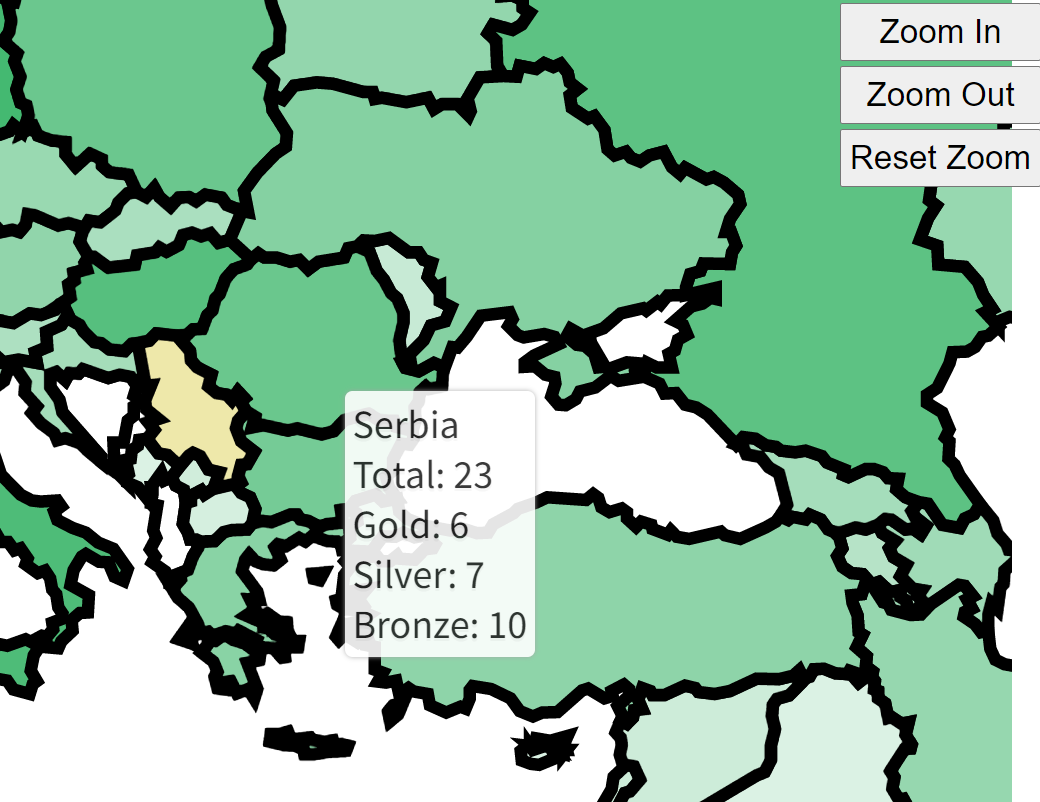
how a countries medals are distributed. The zoom-and-drag functionality makes it easier to explore the map for
smaller countries which are more densely packed together, like Serbia in the middle image above. Clicking on
any country pulls up the pie chart and medal counts on the right (third image), and creates a button to
visit the country page for the country being viewed, which has more data on it. For any country without Olympic
data (has not competed or has no medals), the tooltip and chart view both reflect the lack of data, and the
button to visit the country page is hidden.
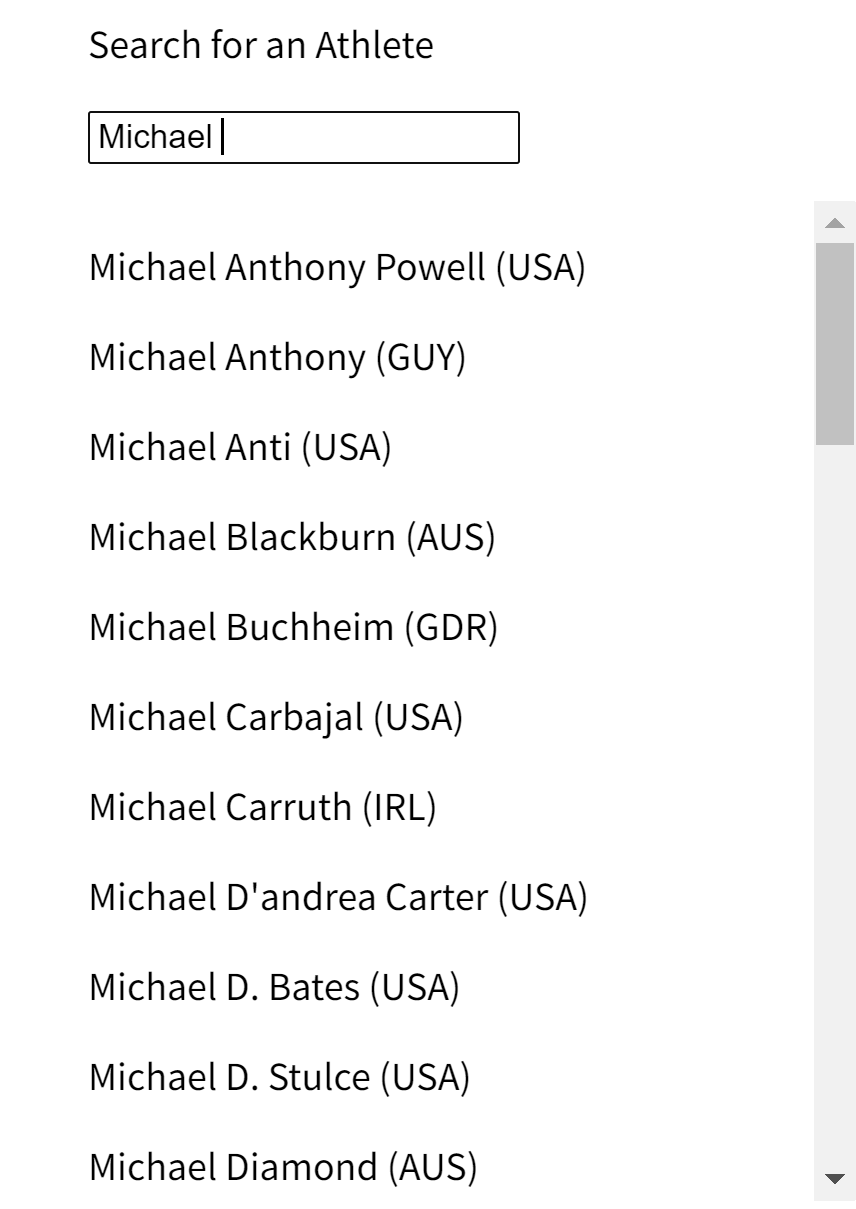
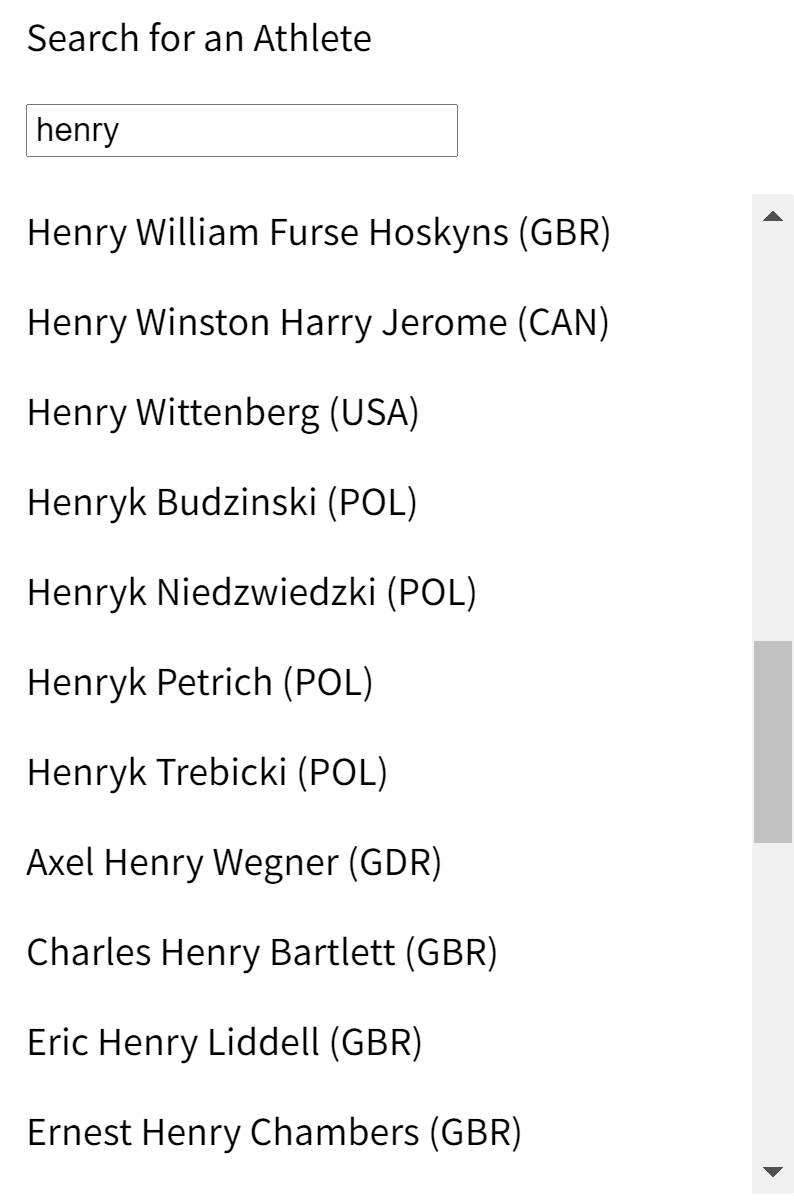
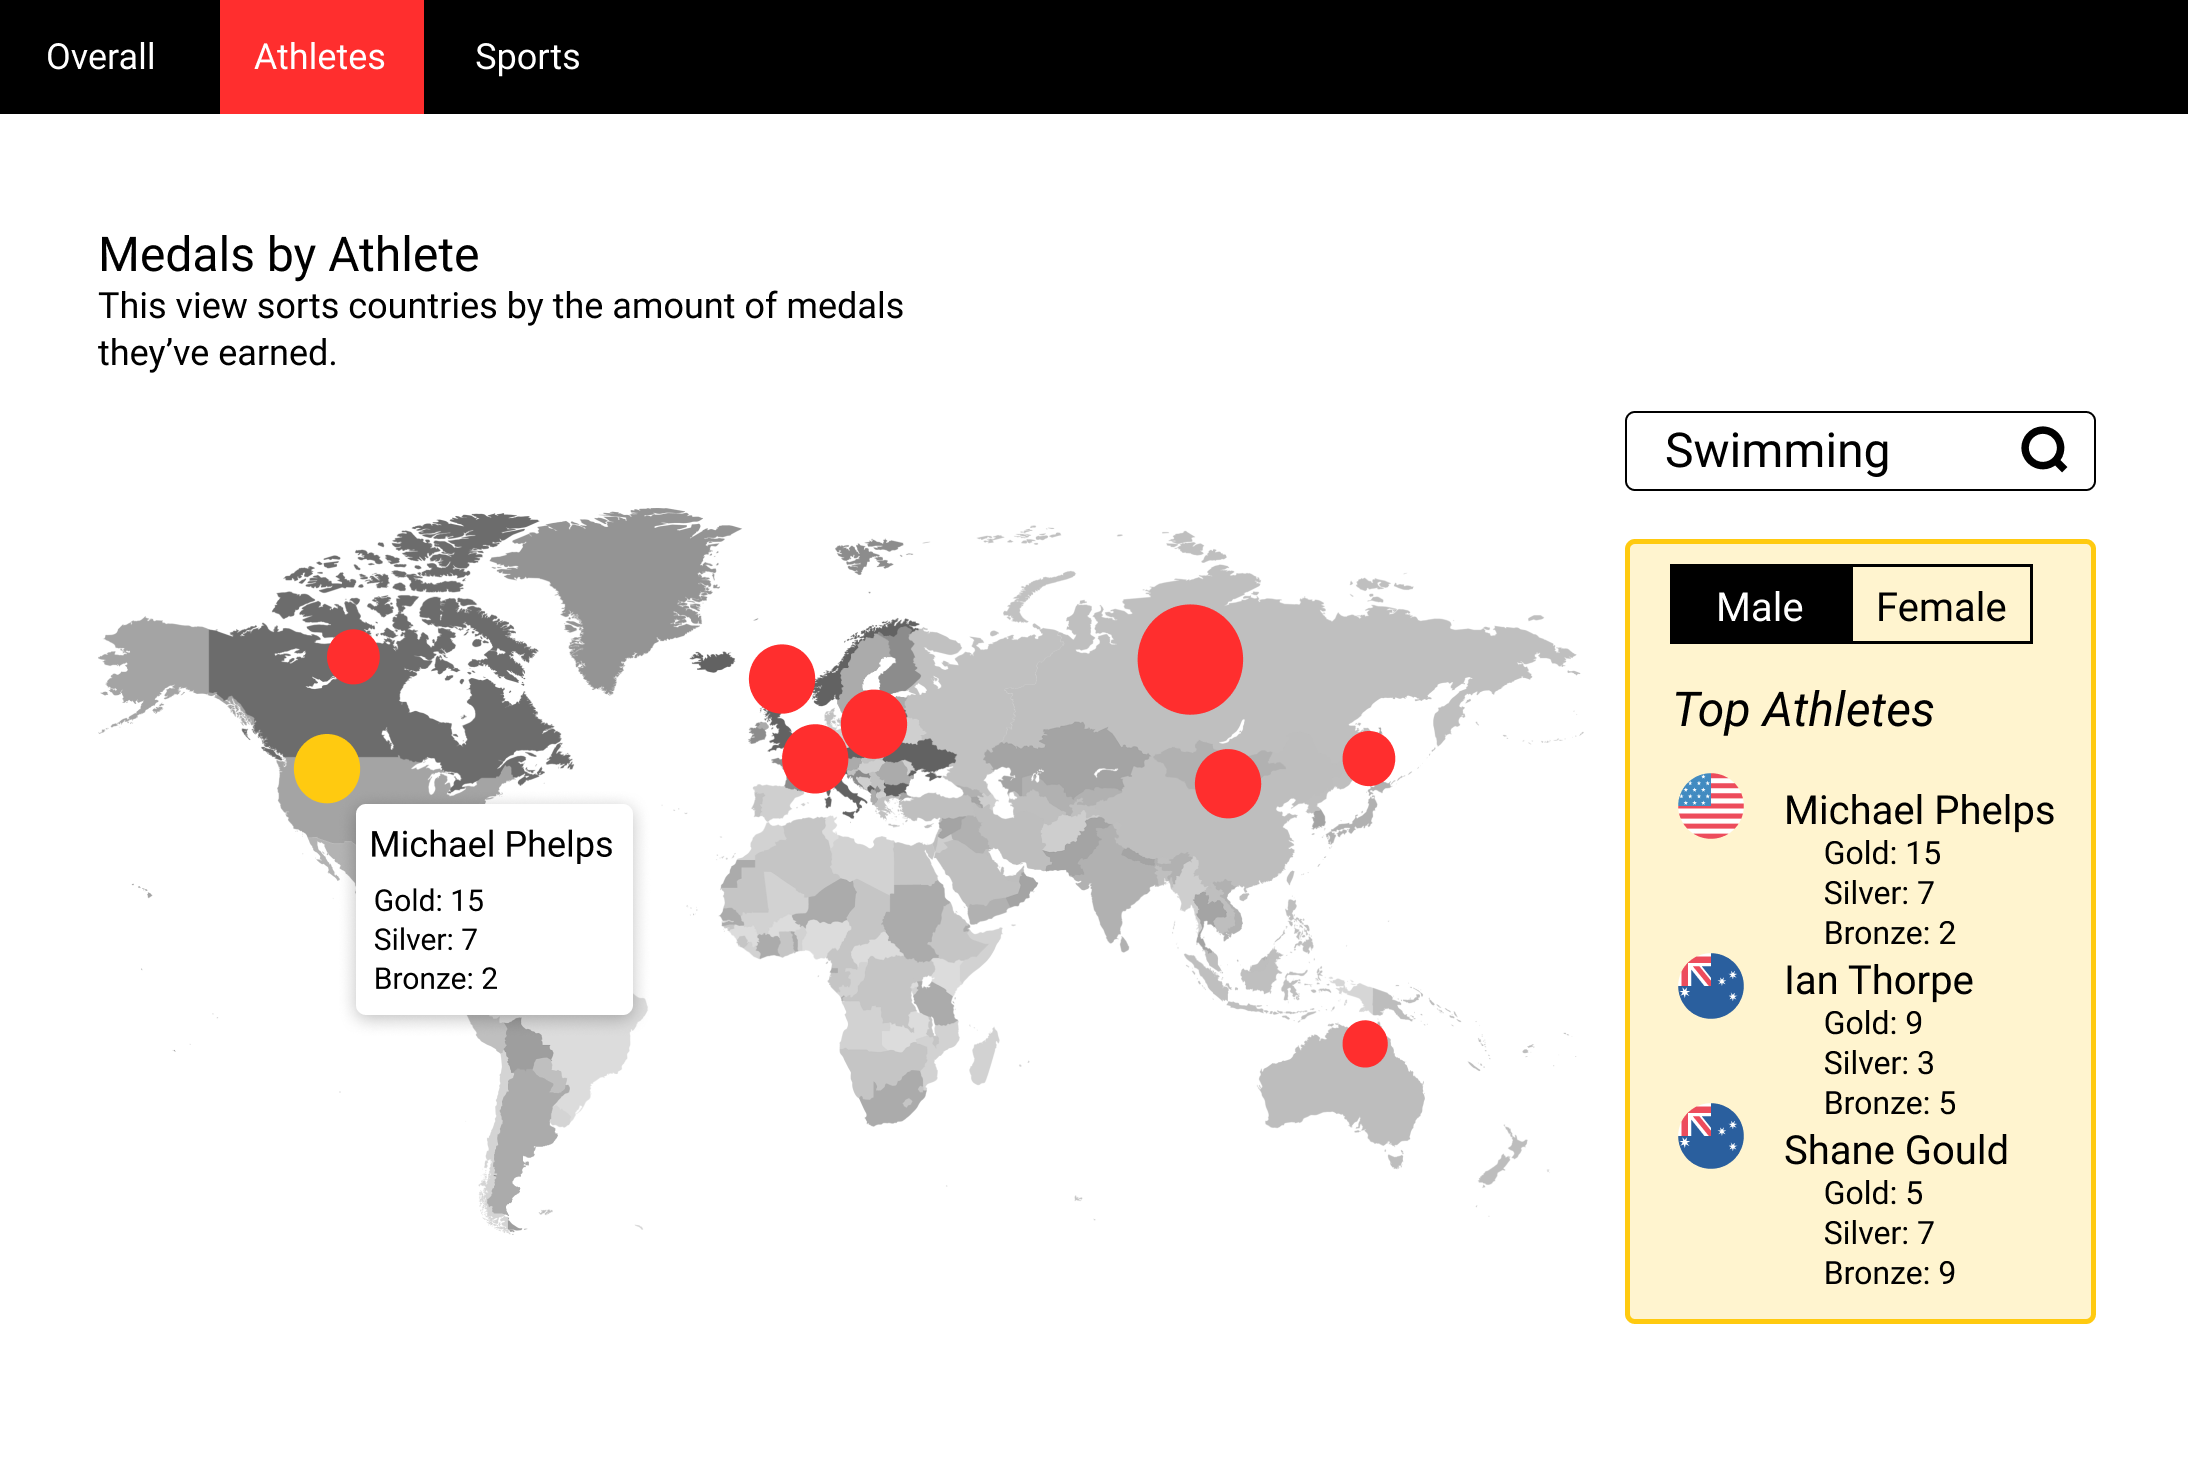
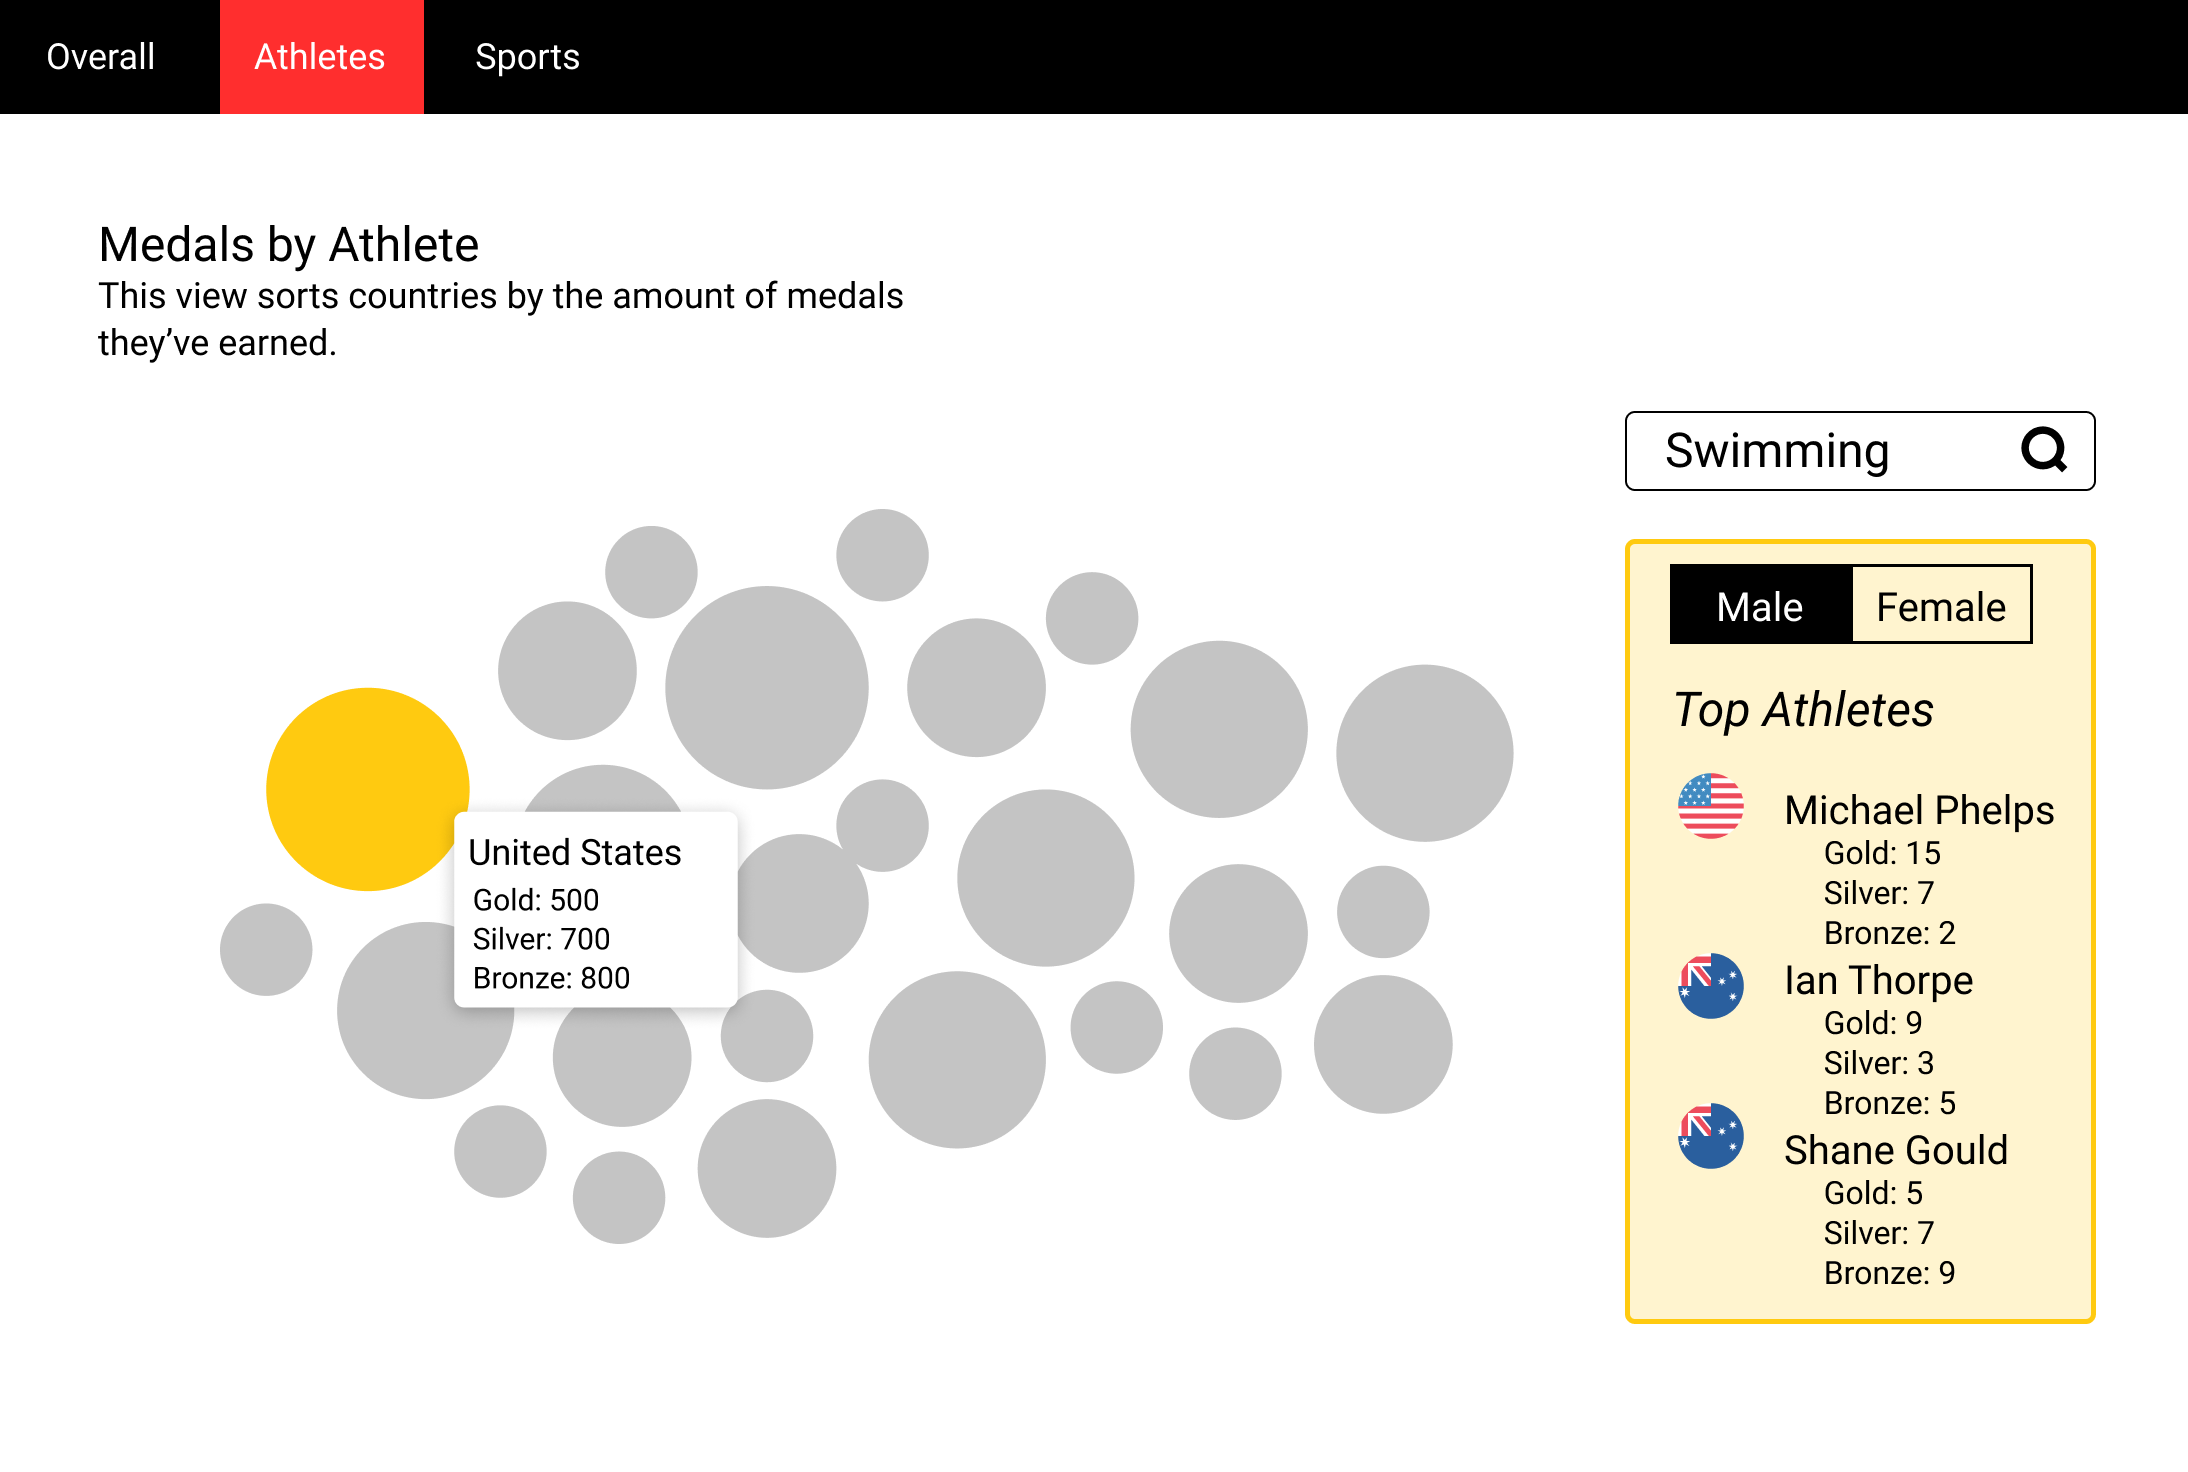
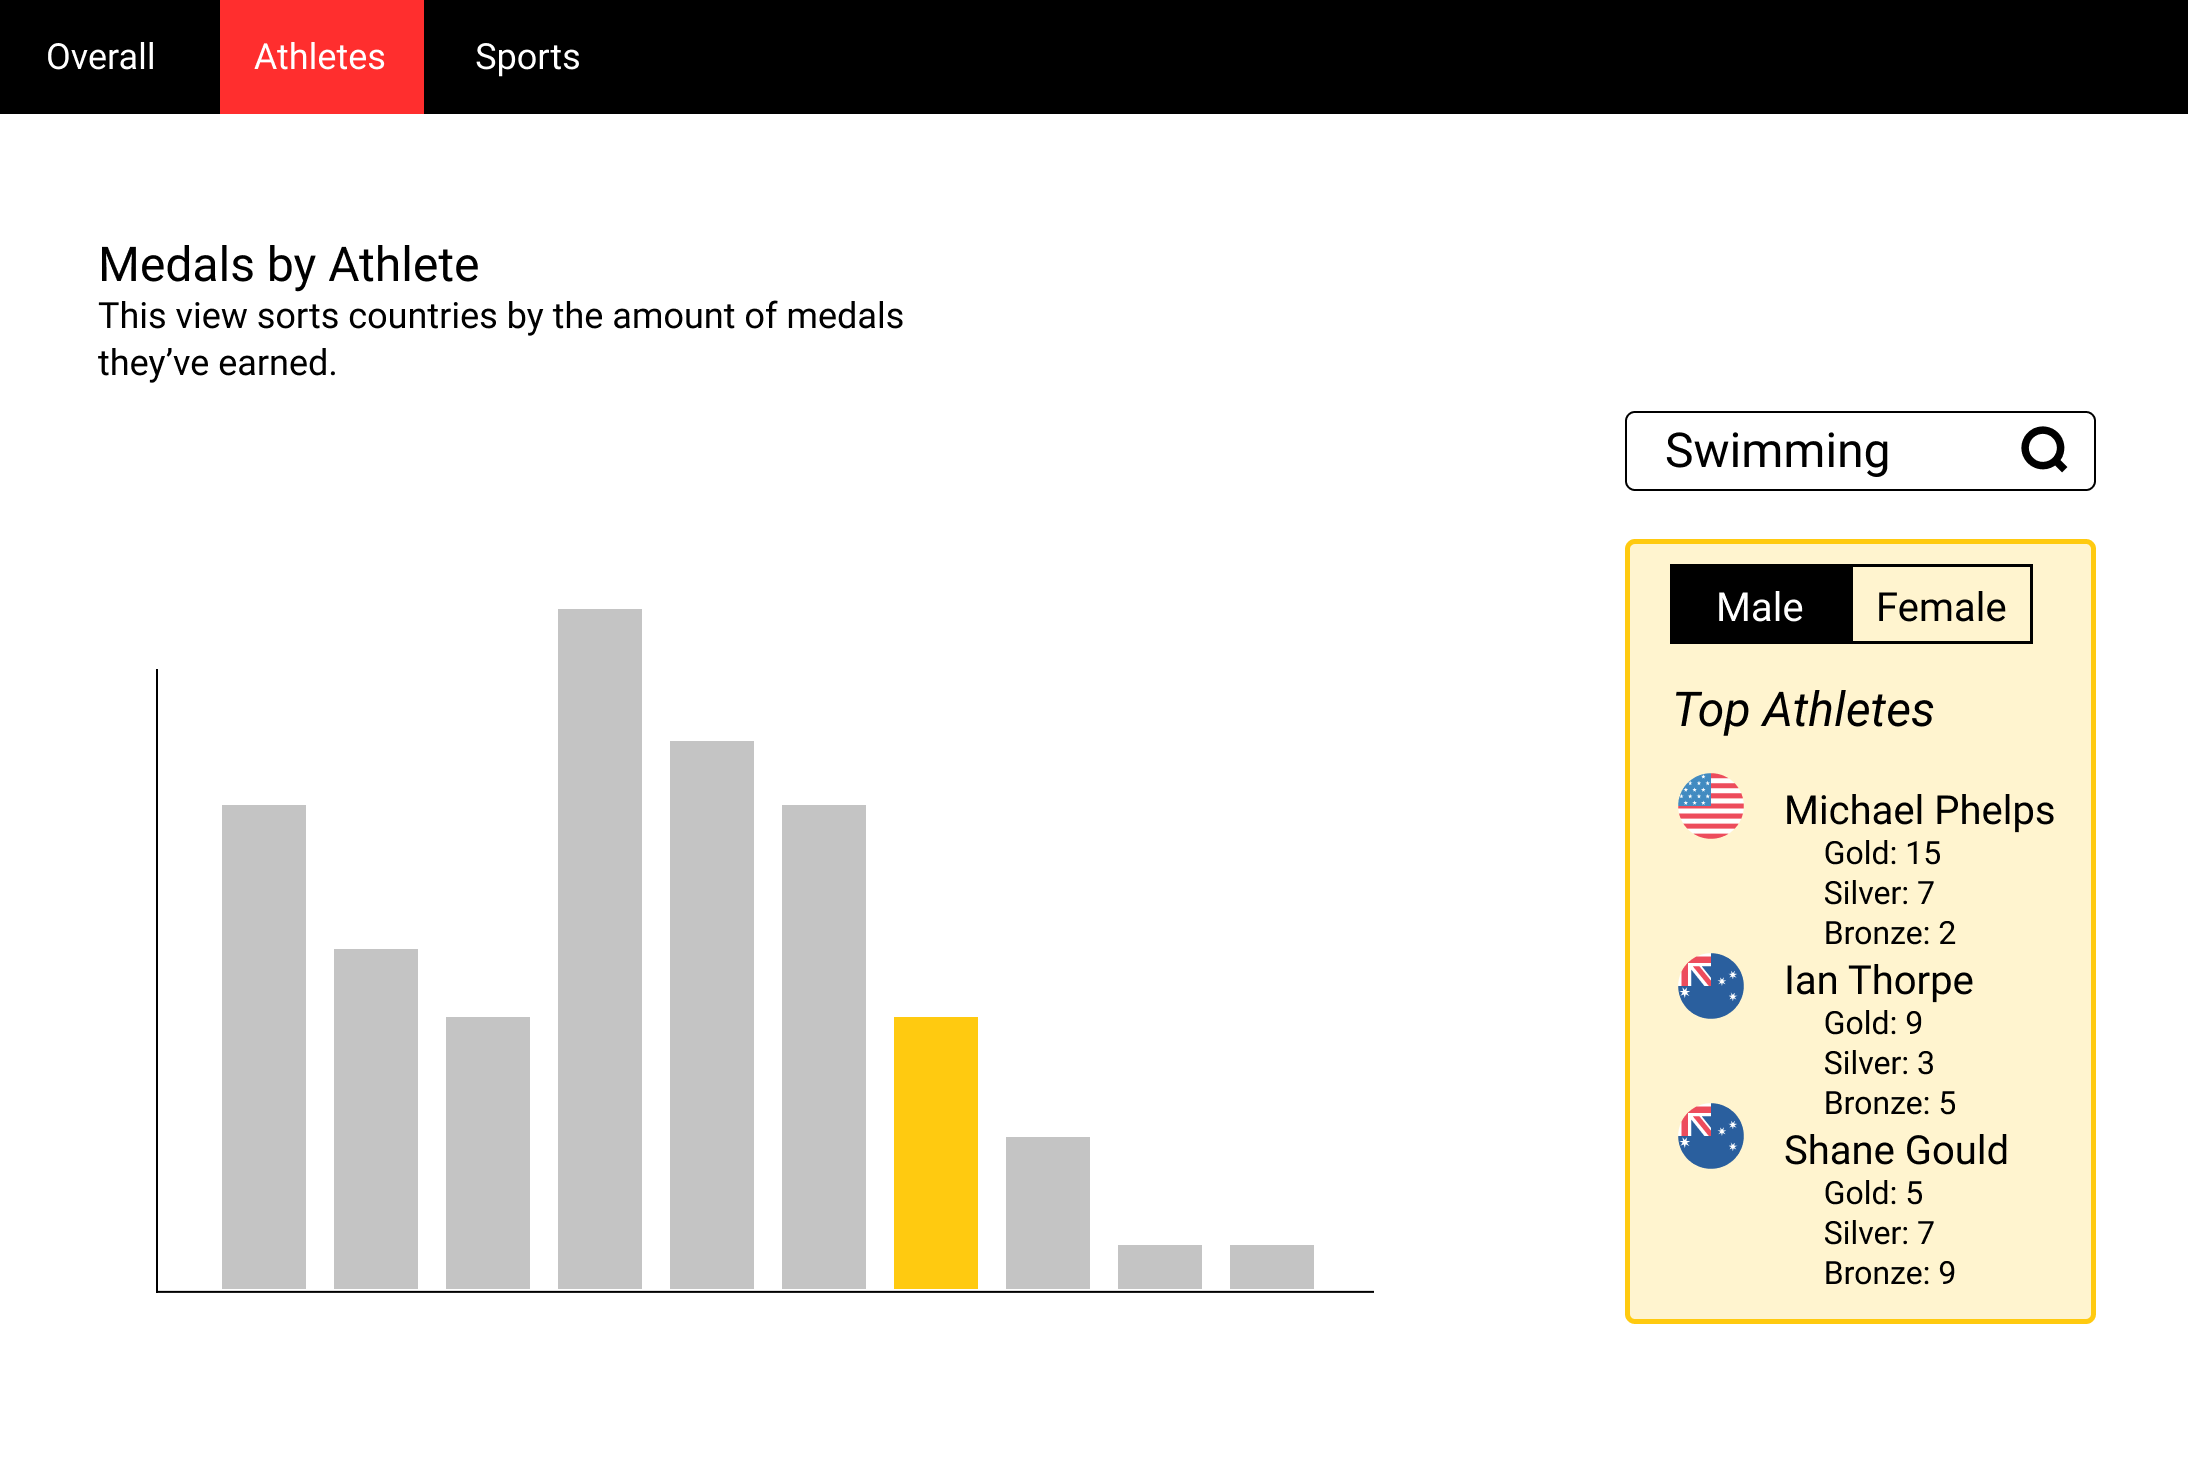
Athletes page:
The goal of the Athletes page is to allow users to search for an athlete by name and to see their Olympic medal
counts. In its current state, the only data that is shown is the pie chart of the athlete's medal earnings, and
a header stating how many medals they have won. We plan on gathering some additional data - the Olympedia ID of
each athlete - so that we can also add a link to each athlete's Olympedia
page for more information. The search sidebar will show up to 50 entries matching the input query, and will
pull up an athlete's data on click. The sidebar is ordered by alphabetical matches at the start of the string
followed by alphabetical matches anywhere in the string, as shown in the third image below. The scrollbar for the
sidebar appears when the mouse is in the sidebar, but hides otherwise. The primary interaction of this page is
the ability to search for any athlete, as the visualization itself is static for an individual athlete.
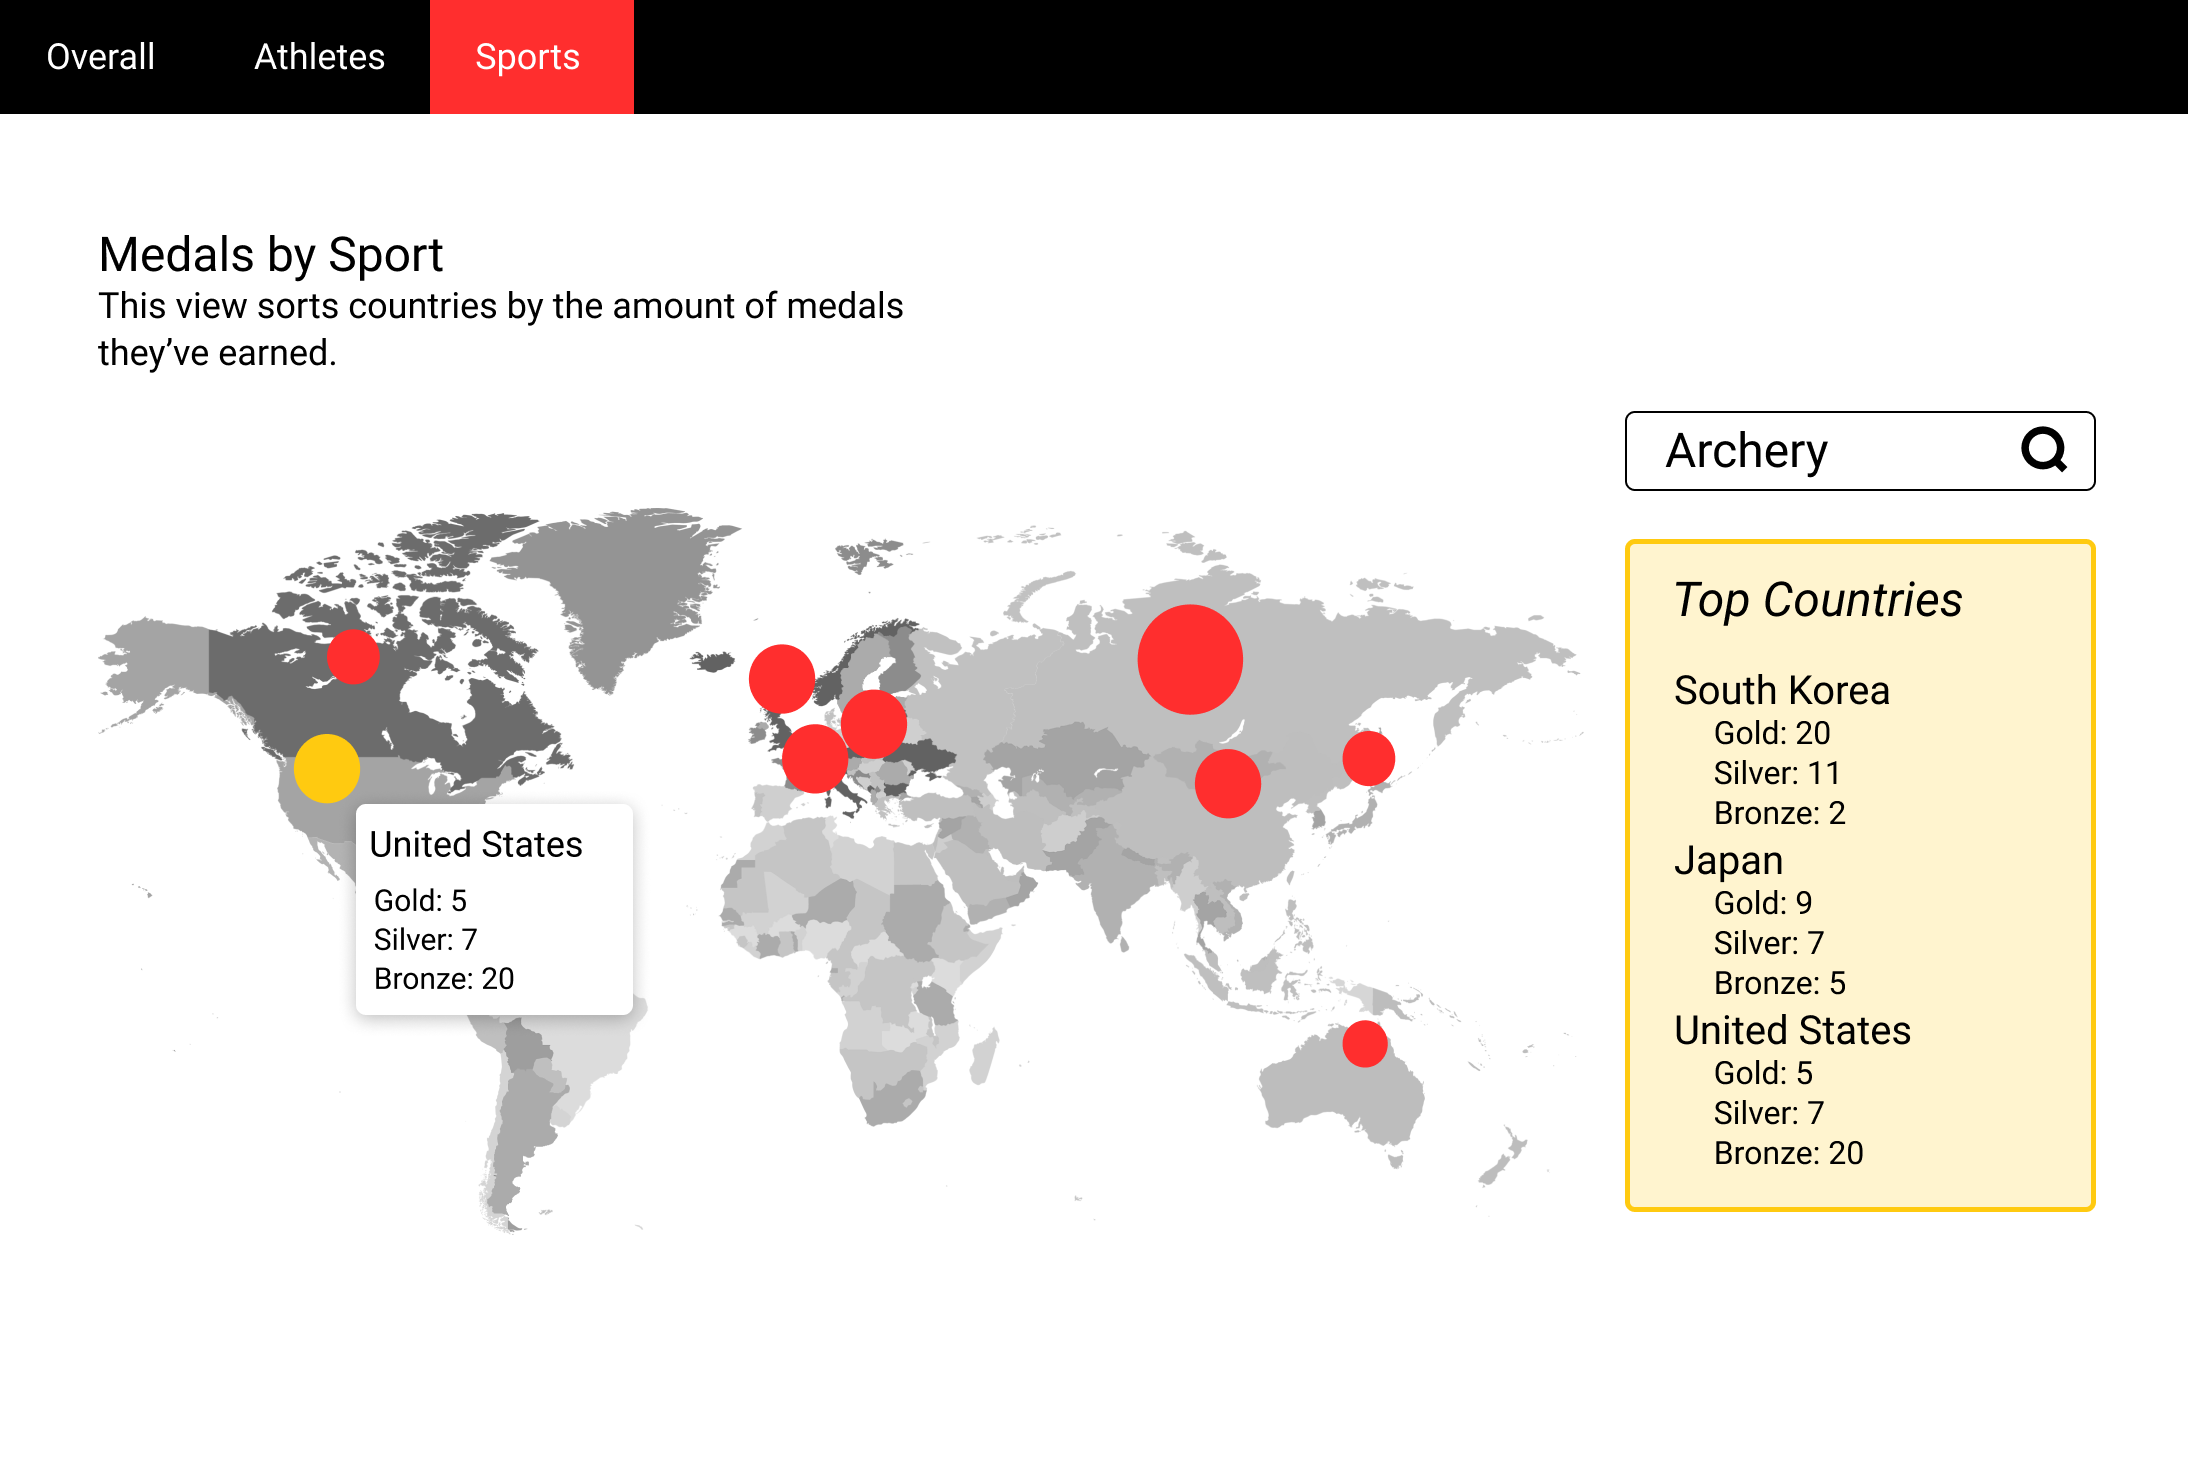
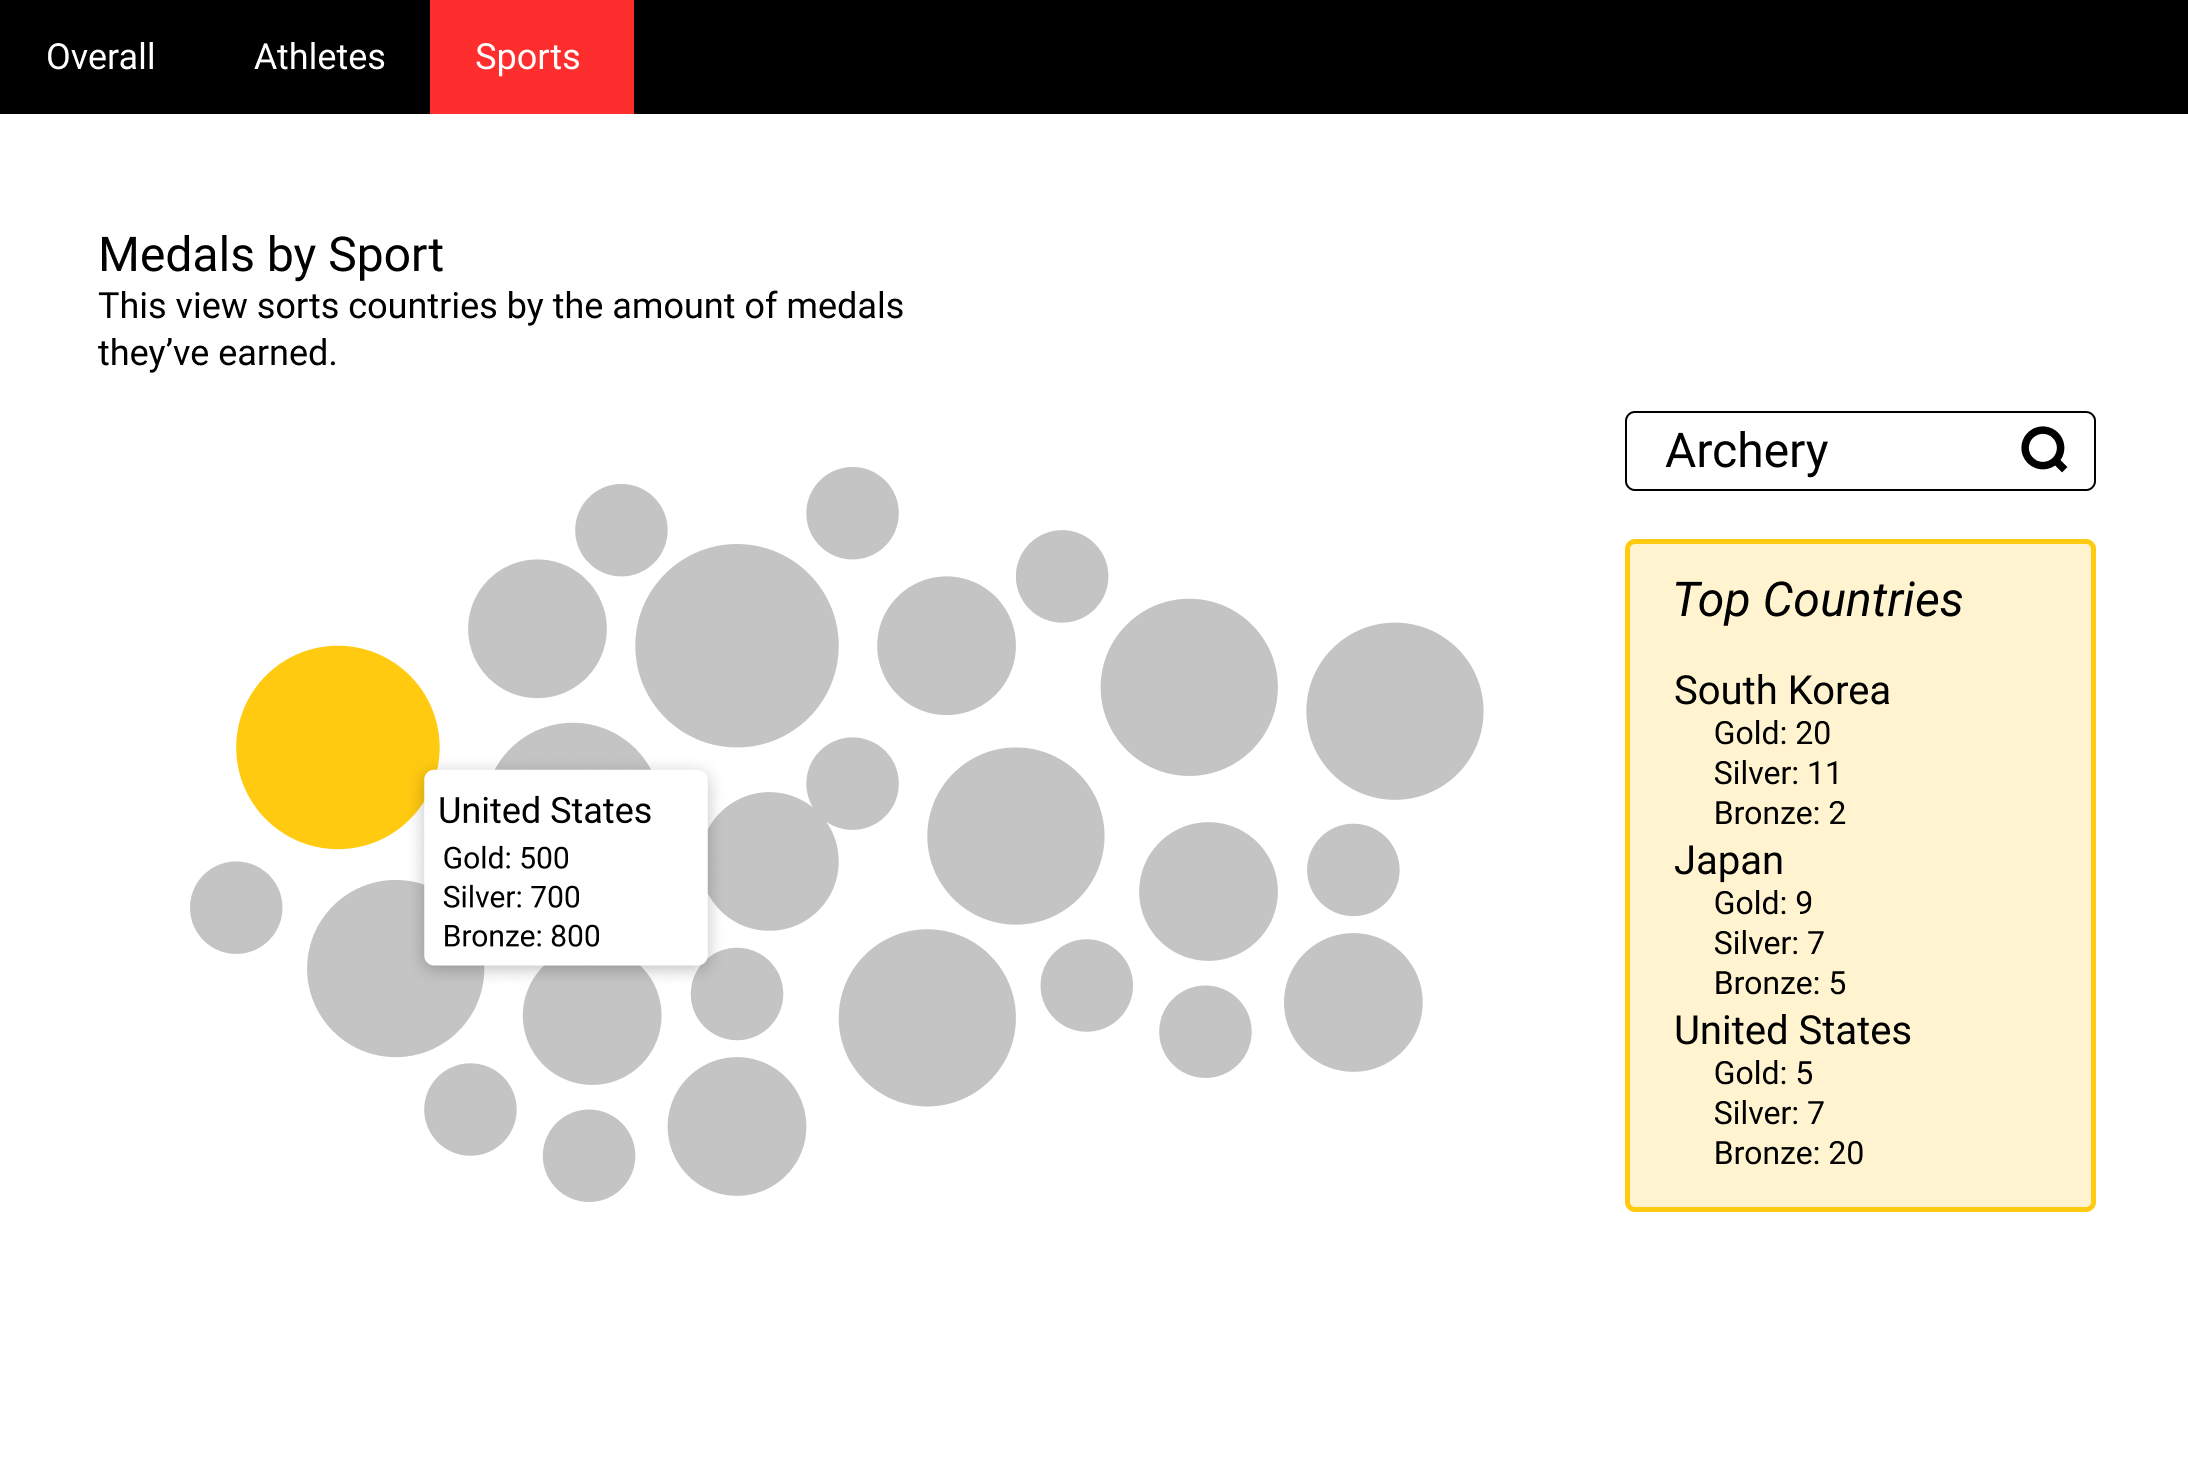
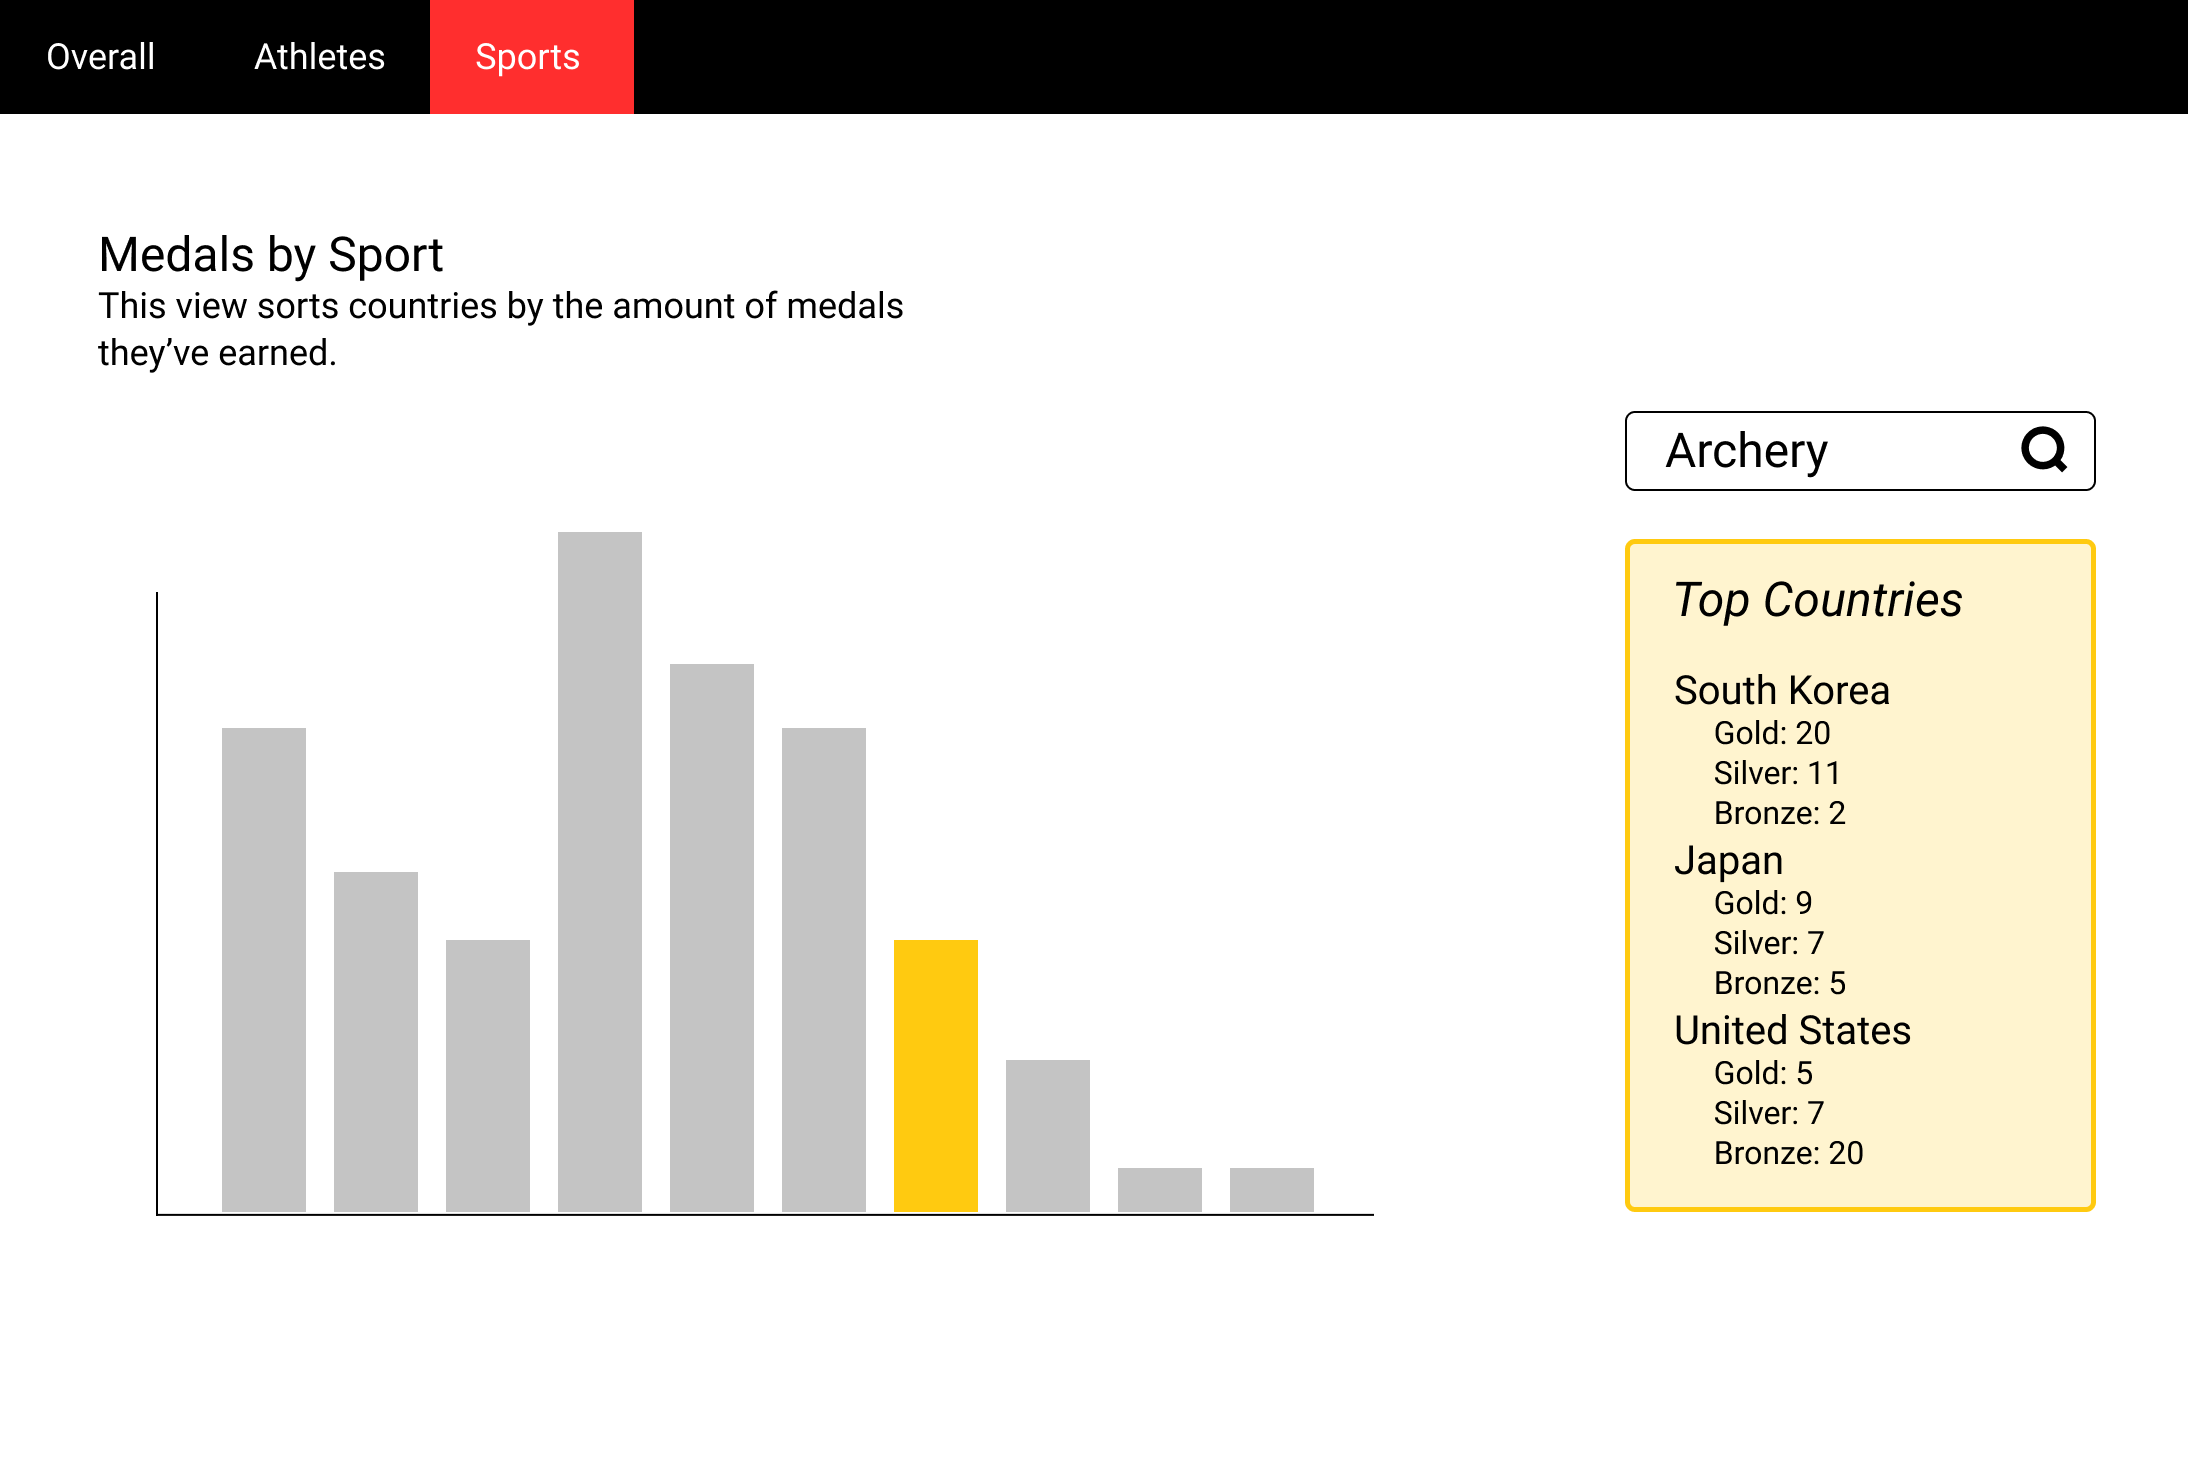
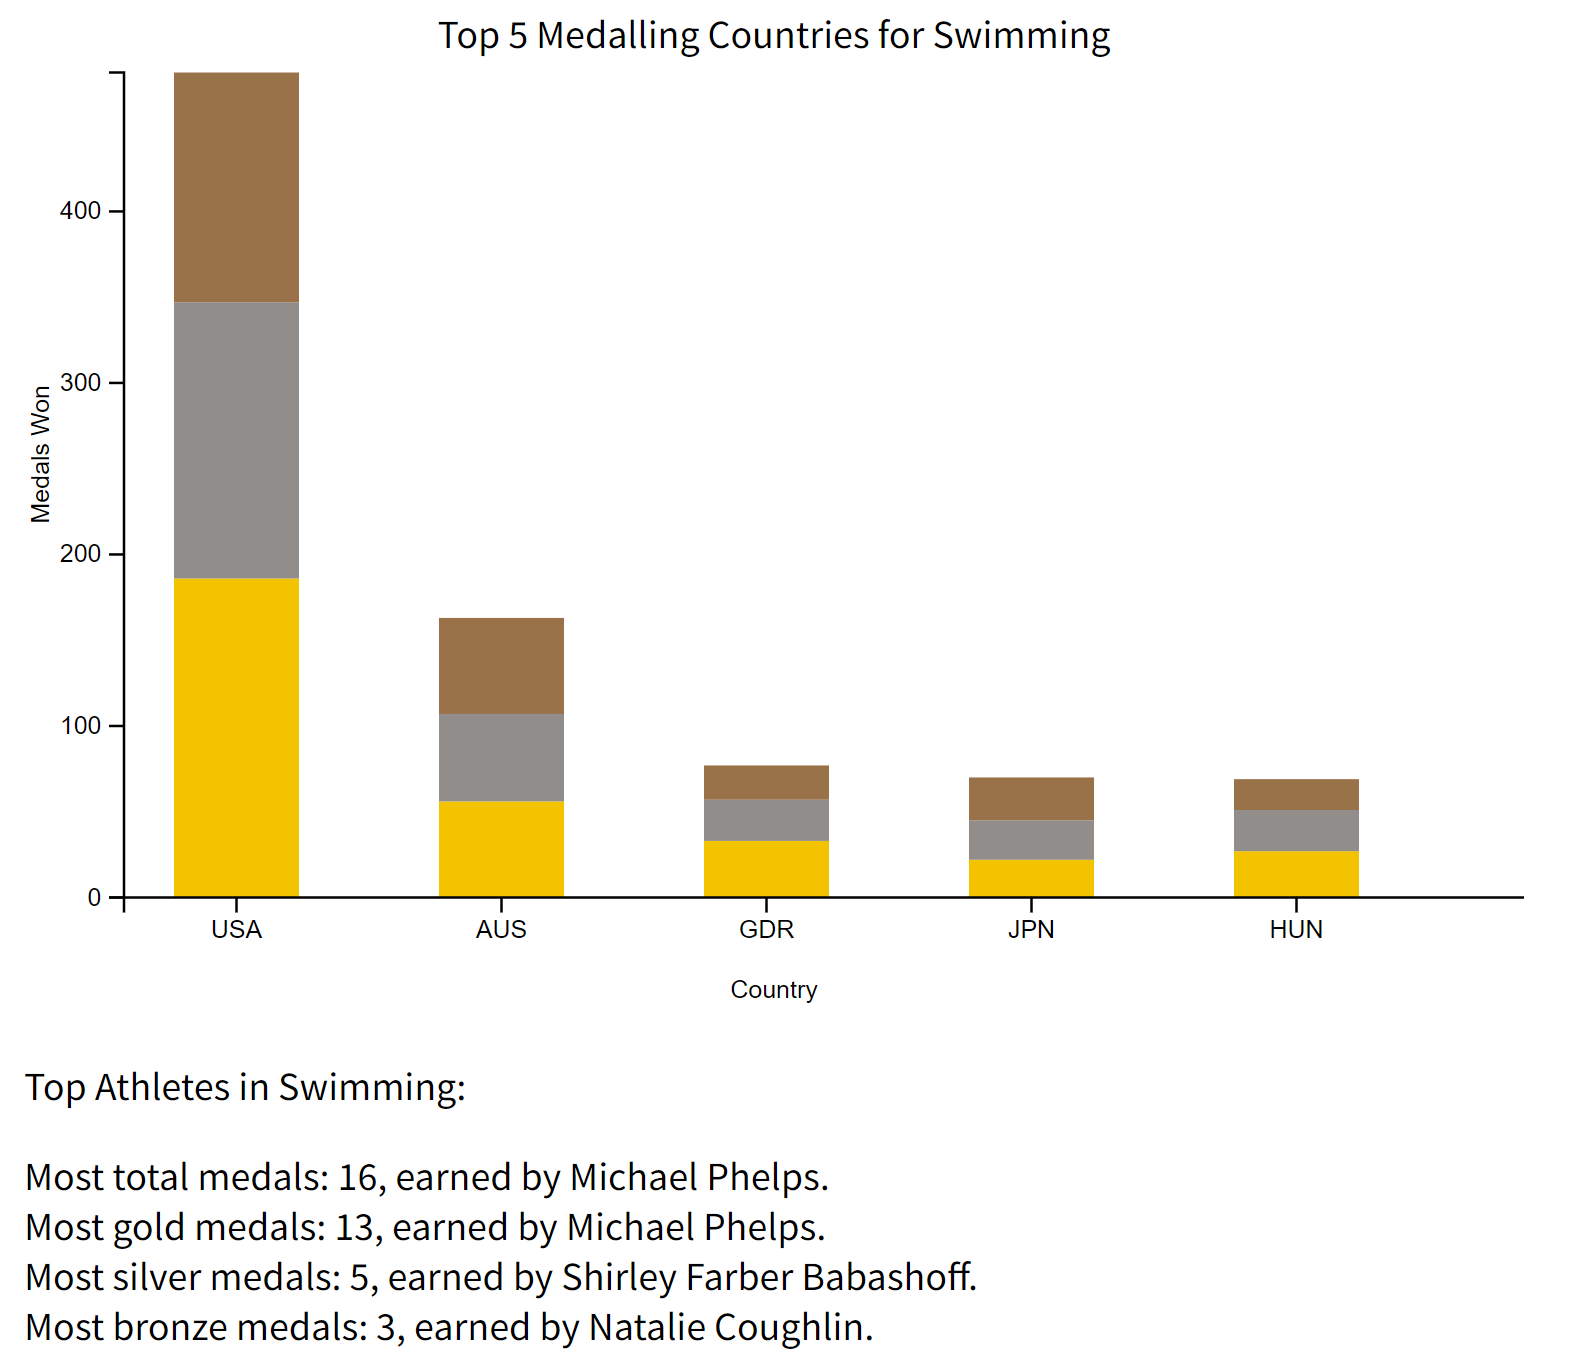
Sports page:
The sports page works similarly to the athletes page. Users can search a sport on the sidebar, and click on one
to load the data for it. The first 15 matches for the query are shown. This page helps to answer our "which
countries are the best in each sport" question via the top countries bar chart. It also answers the "which
athletes are the best in each sport" question through the text - the four athletes with the most total medals,
most golds, most silvers, and most bronzes are all listed. Additionally, clicking on any one of the athletes
takes you to the athlete page for that particular athlete. The unique view of this page is the stacked bar
chart of the top countries:
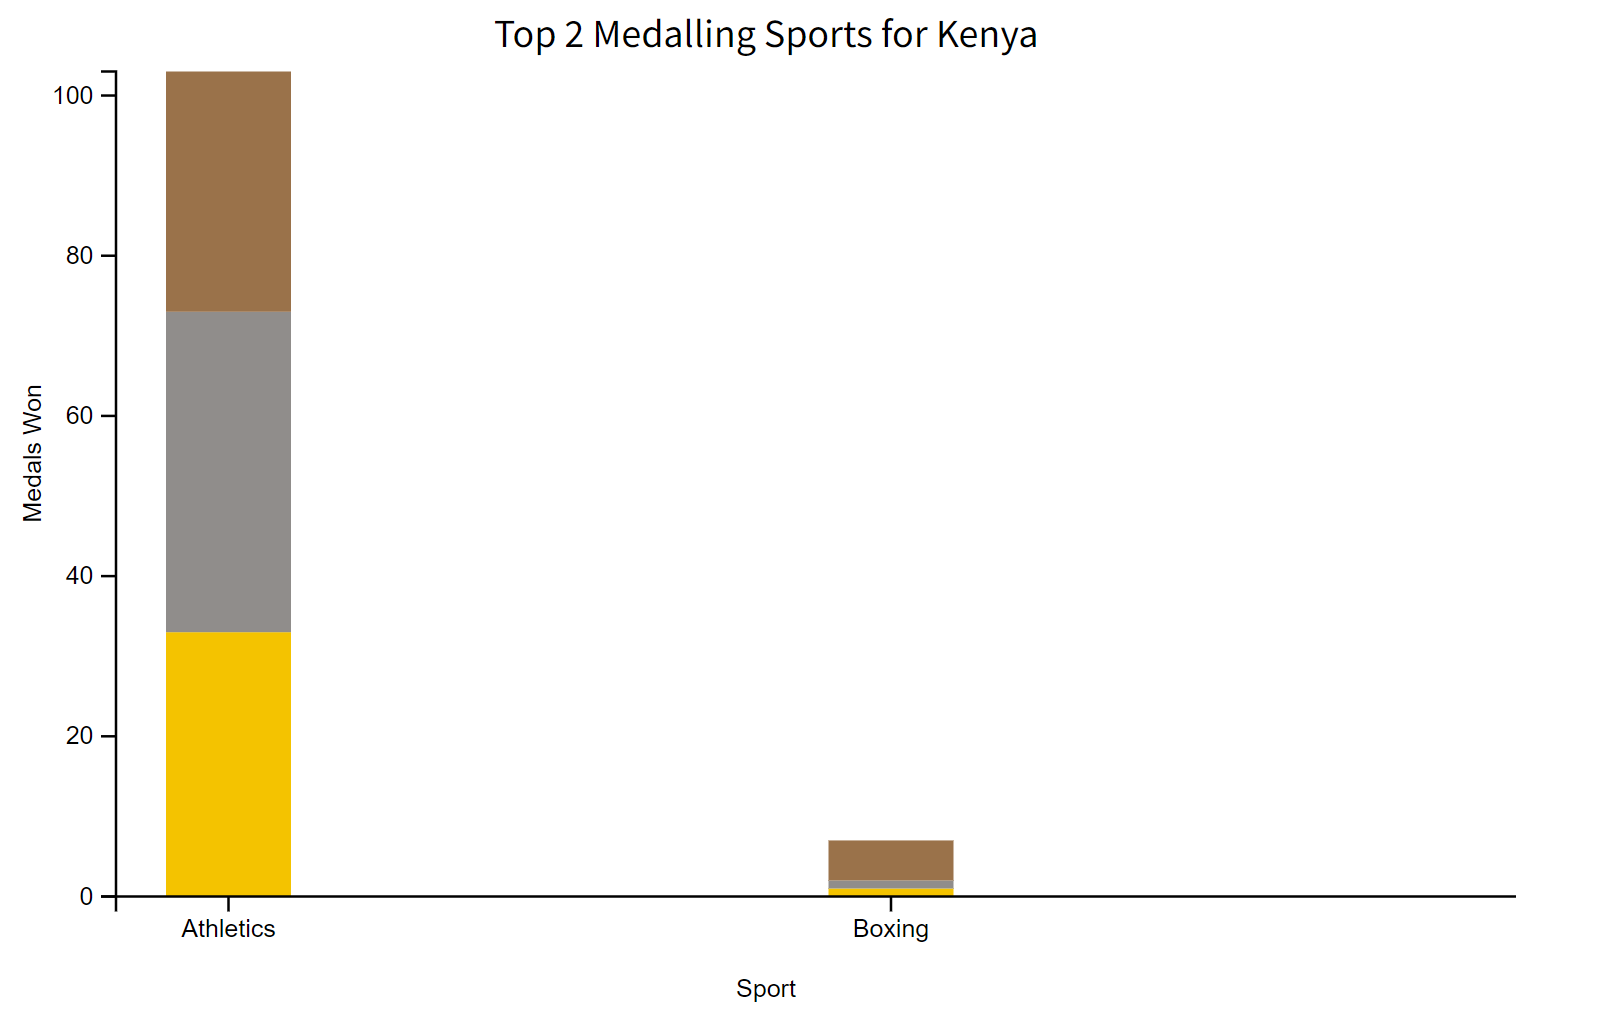
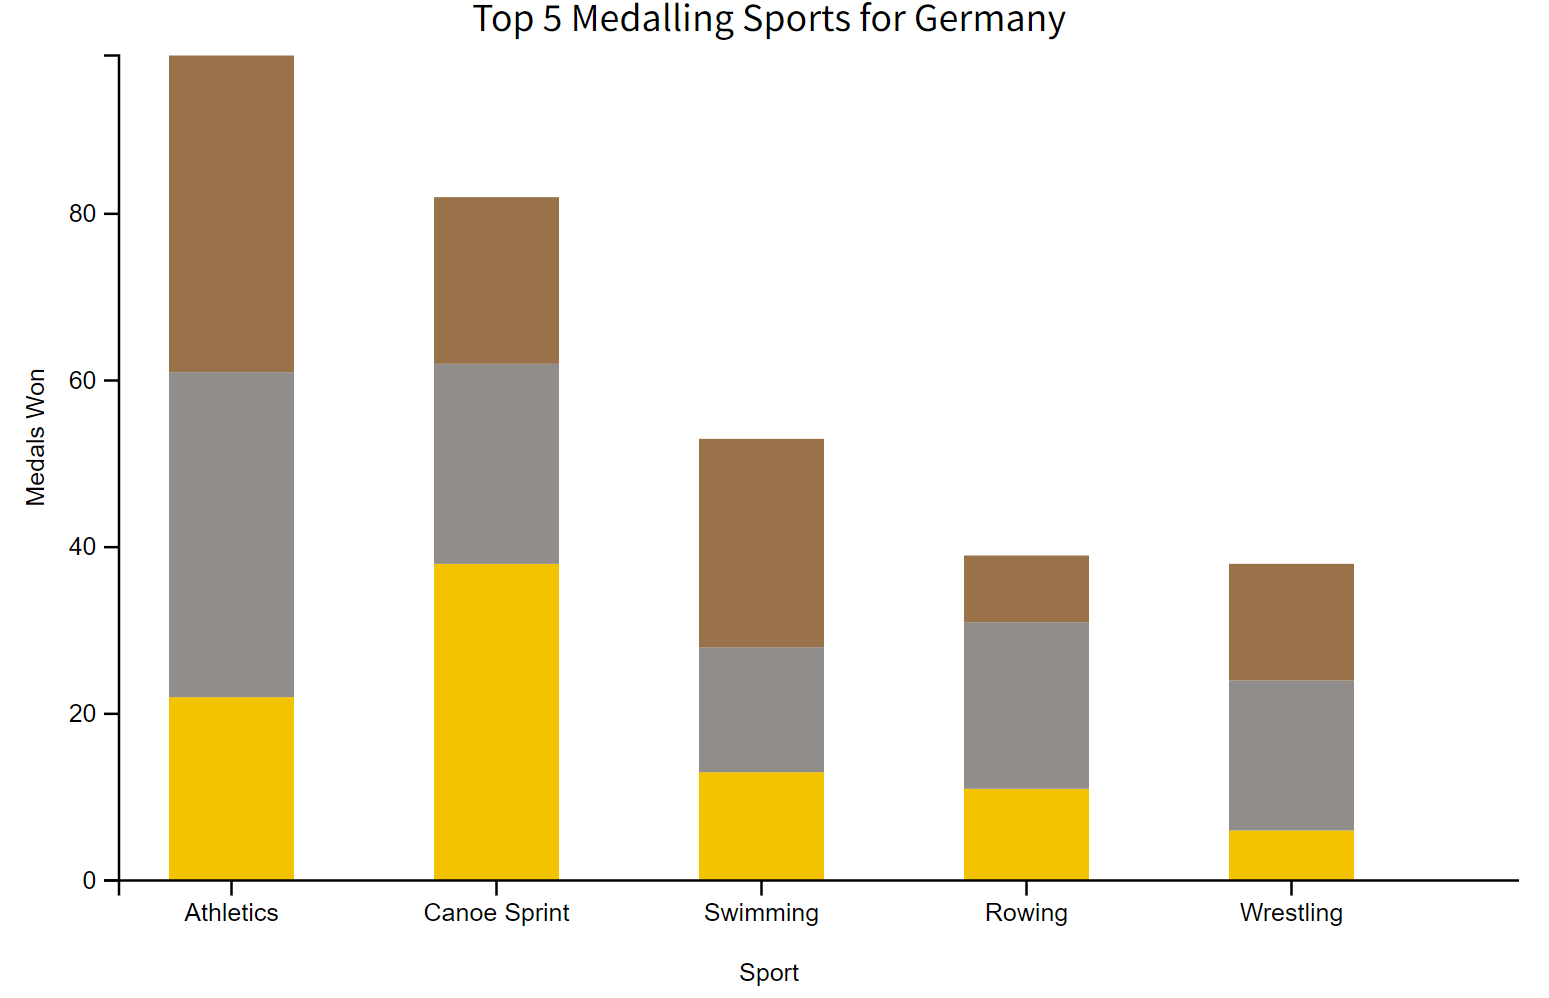
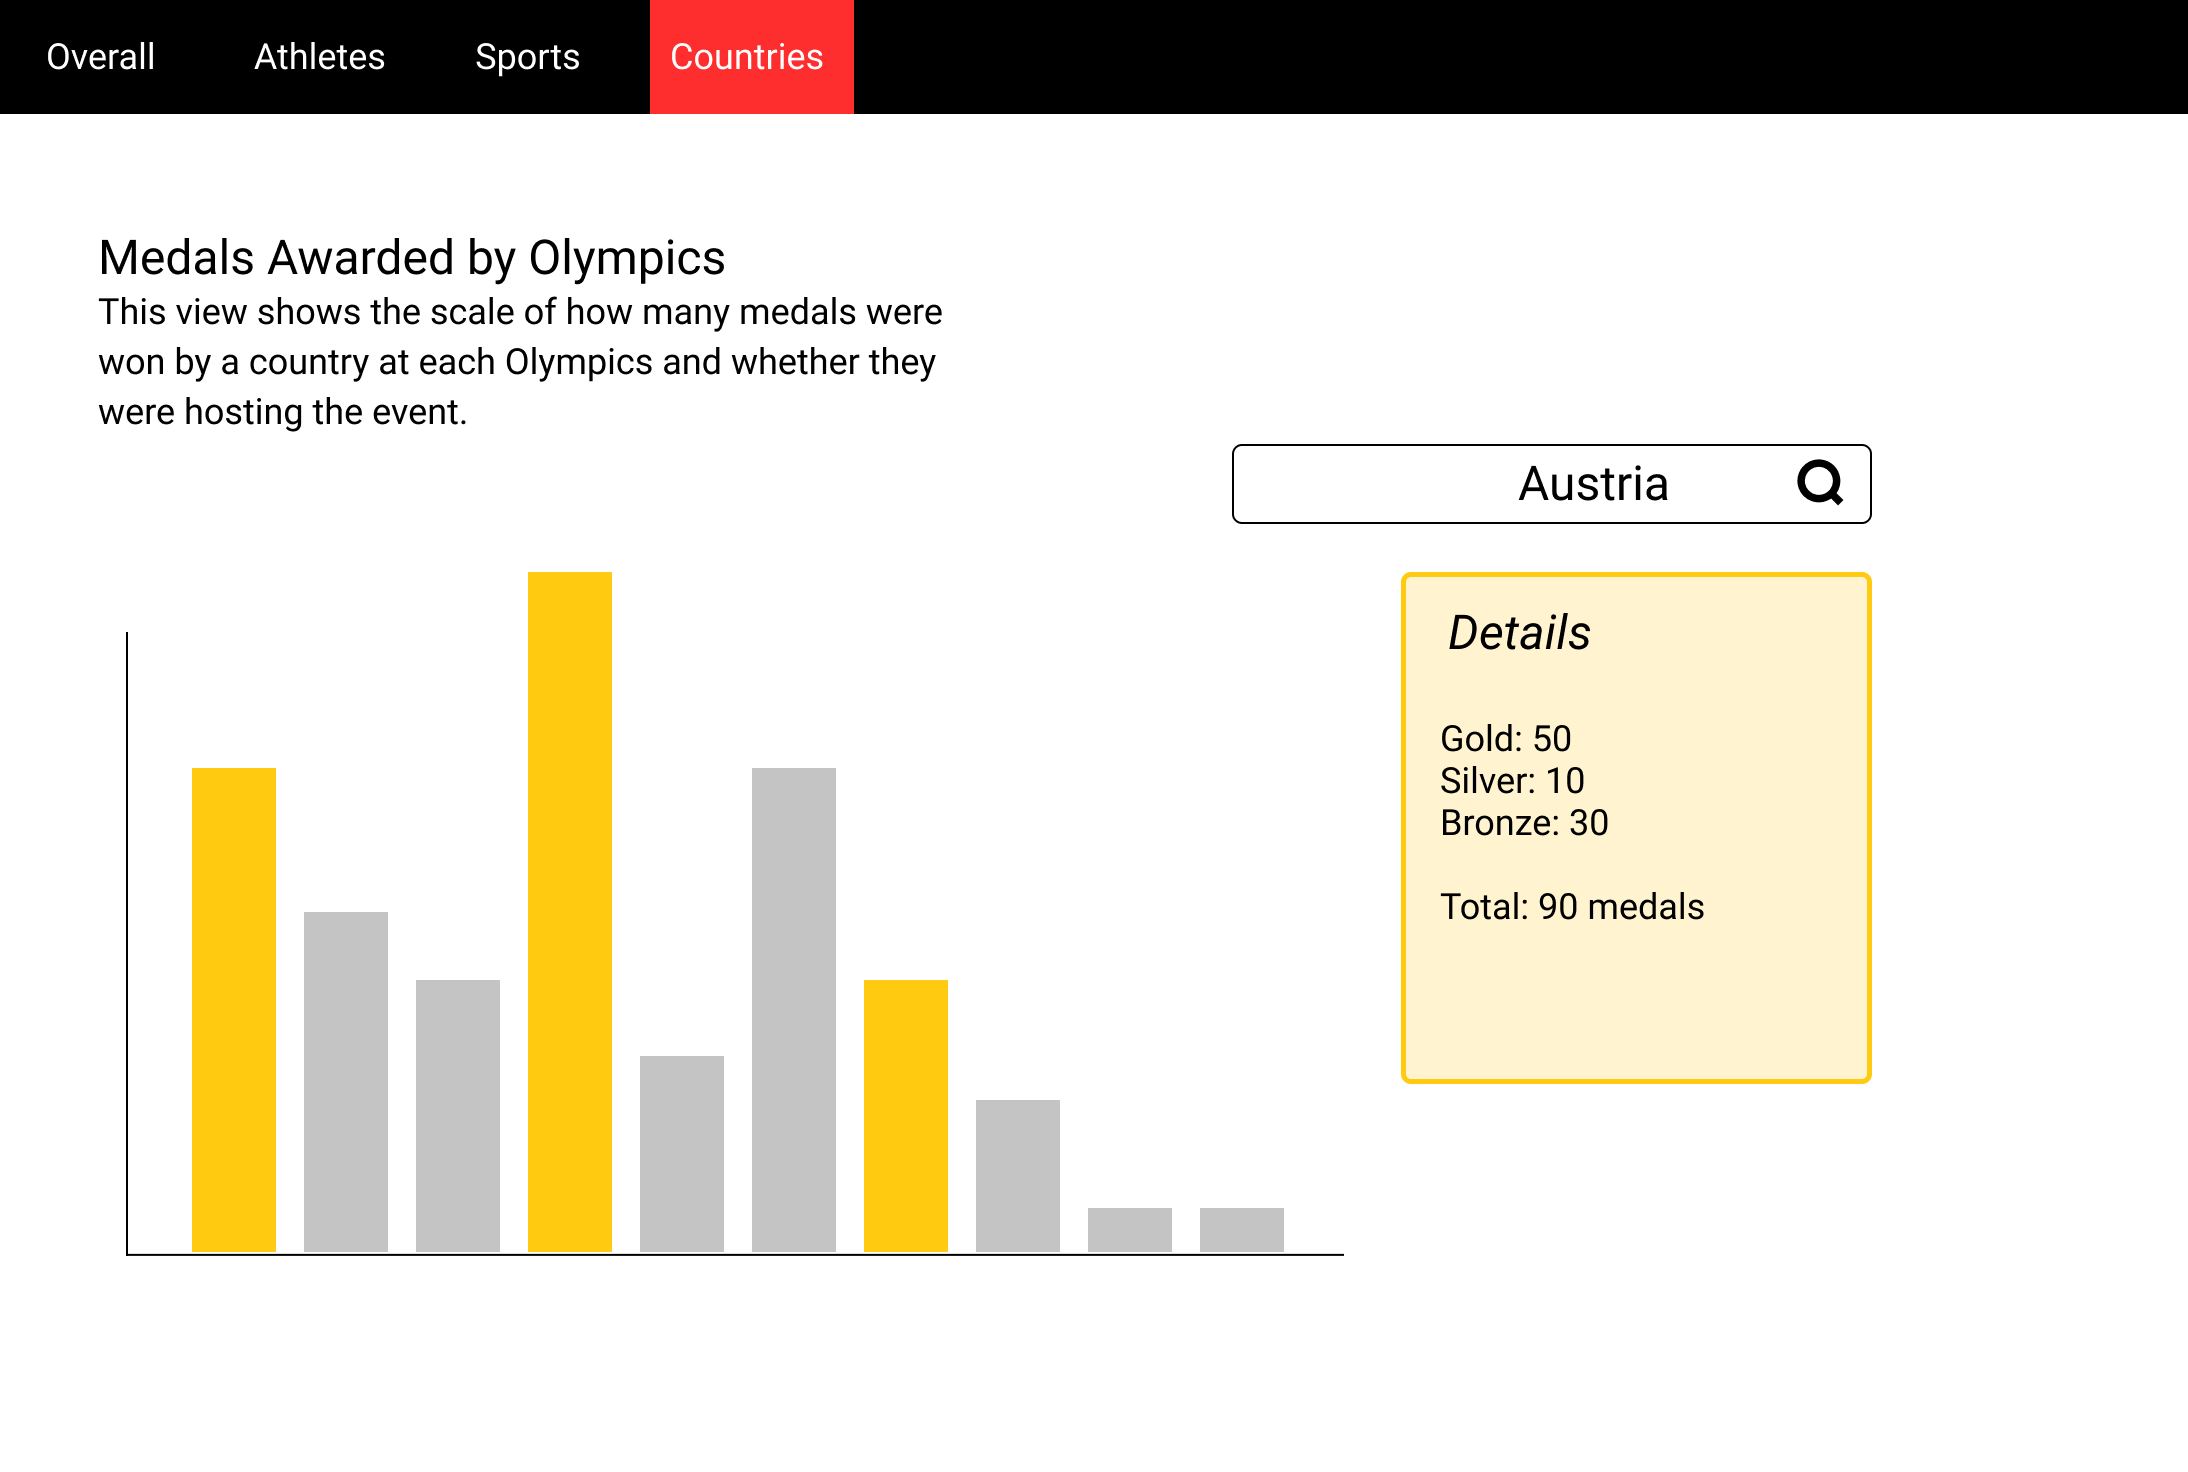
Country page:
The country page has a similar search style to the sports and athletes page. It loads the first 20 matches for the
search query, prioritizing countries that start with the input string followed by countries that contain the
input string. When a country is clicked, two visualizations are created: the top 5 sports for the country and the
medal history for the country. The top 5 sports is an upper bound - if a country has medals in fewer than 5 sports,
it will just display the sports that they have medals in, and will say however many sports it is rather than 5 (see
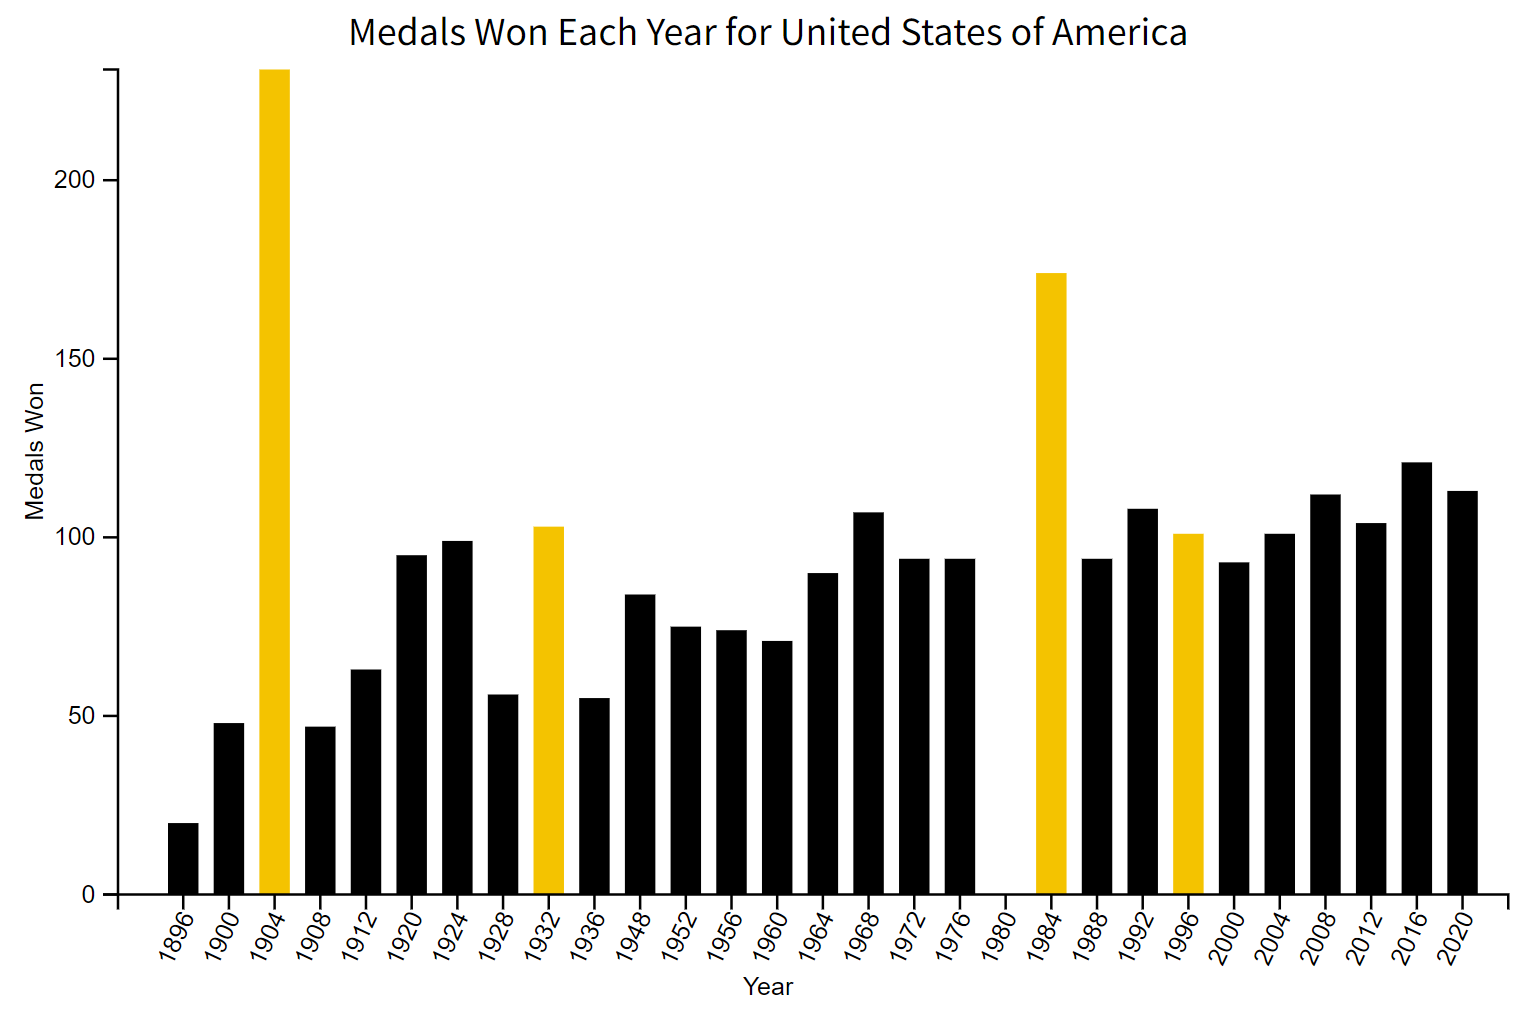
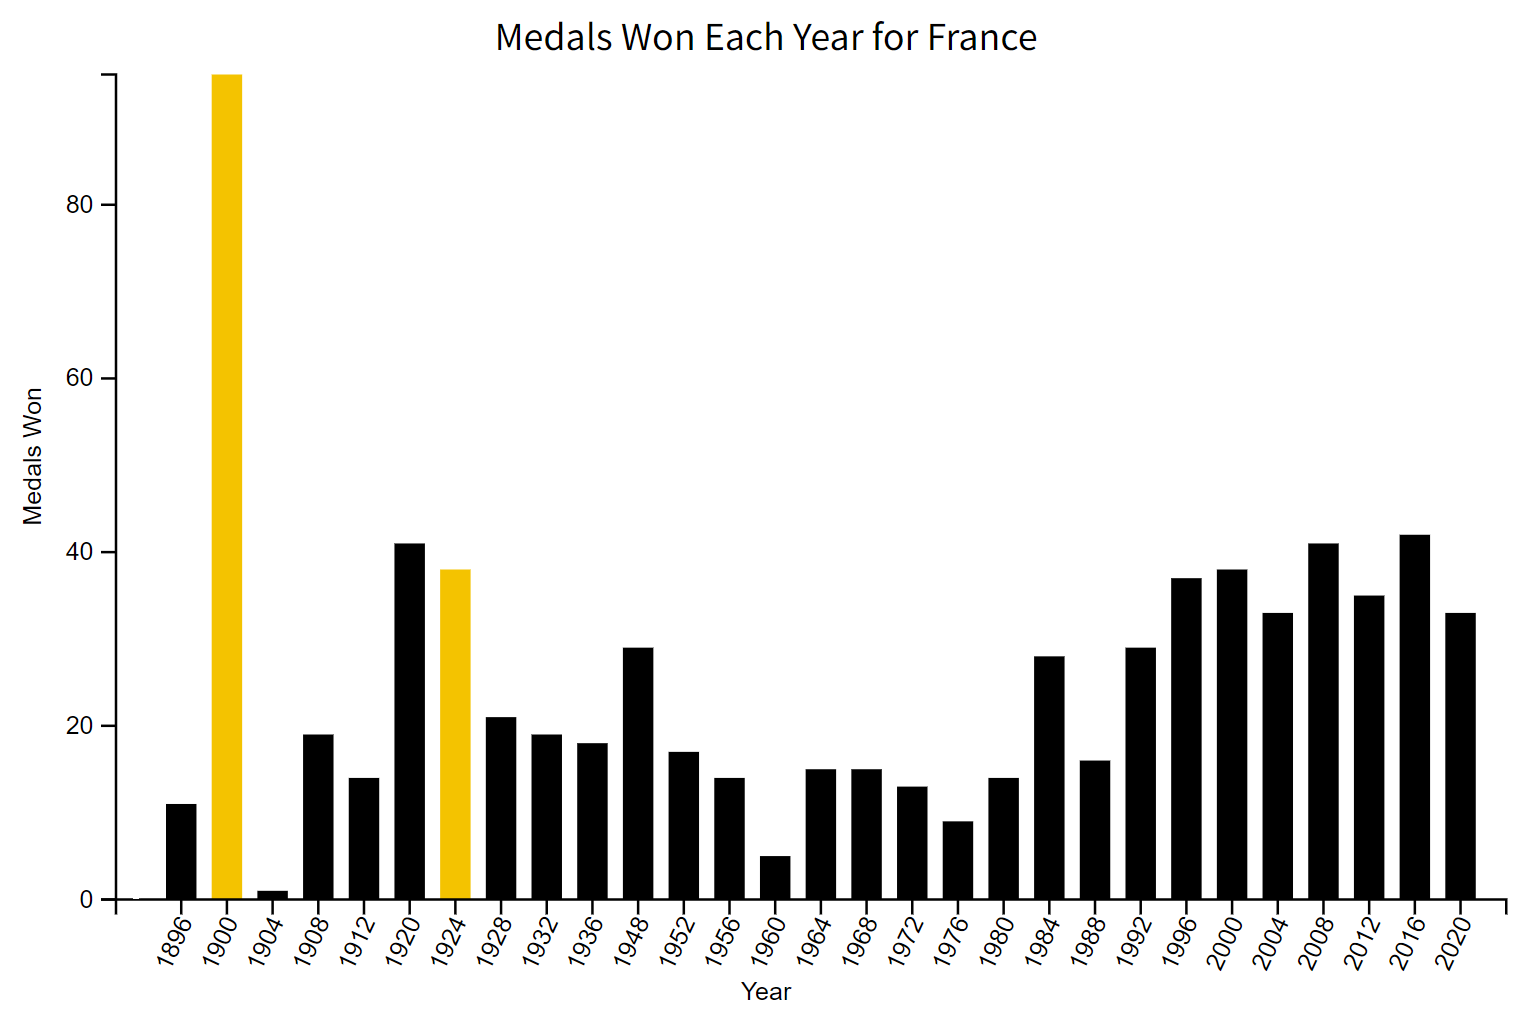
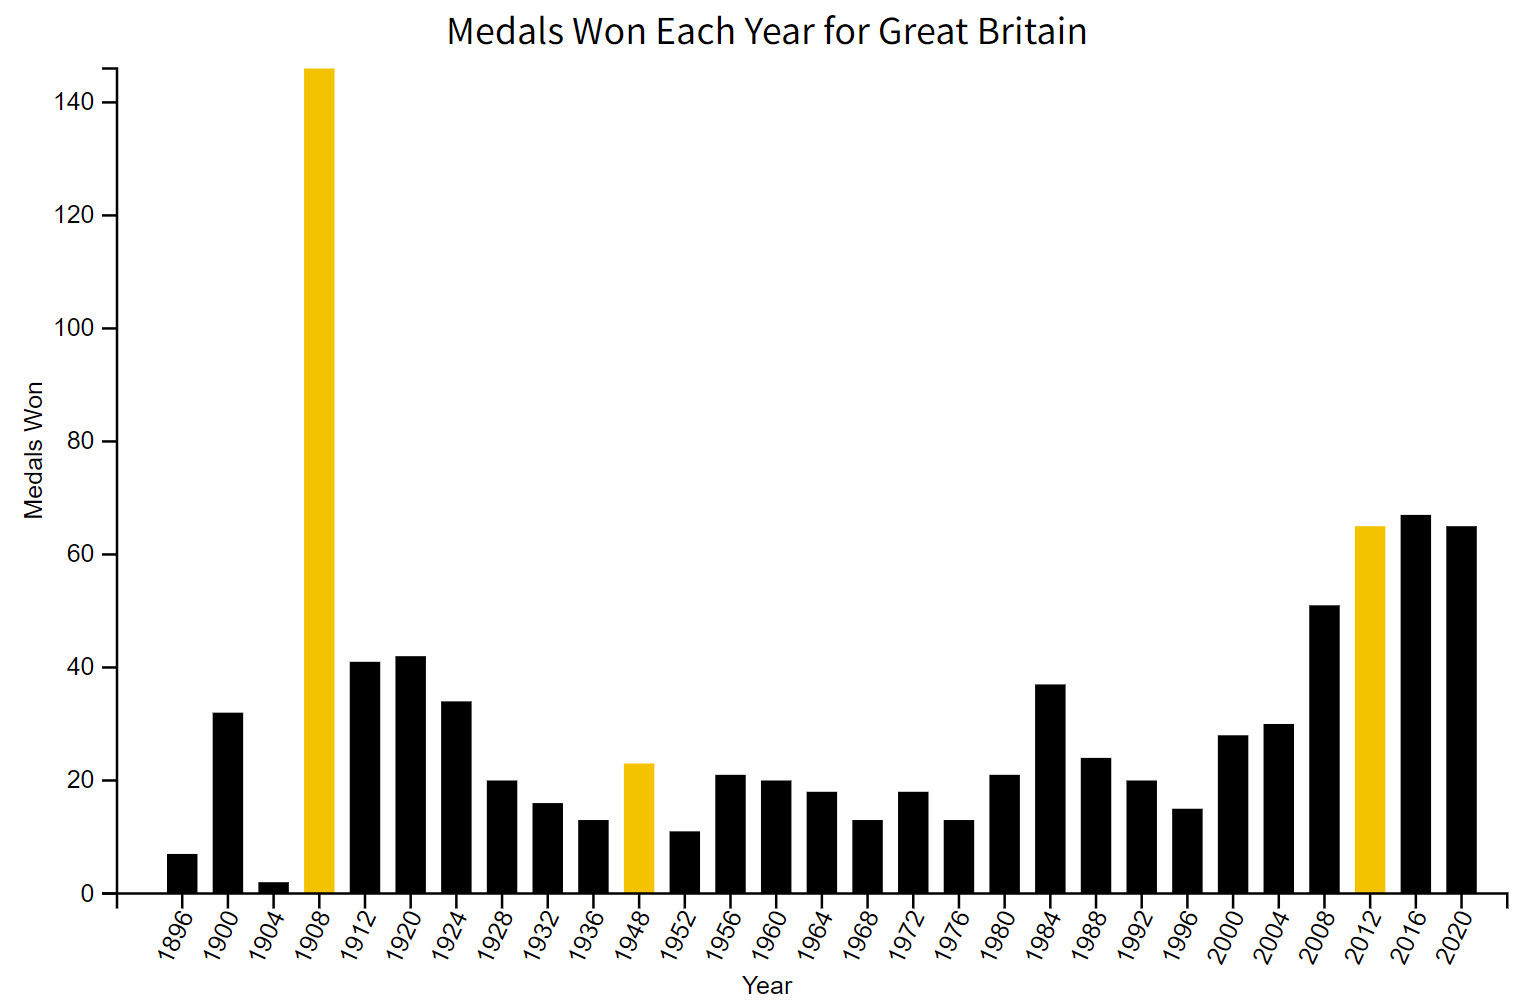
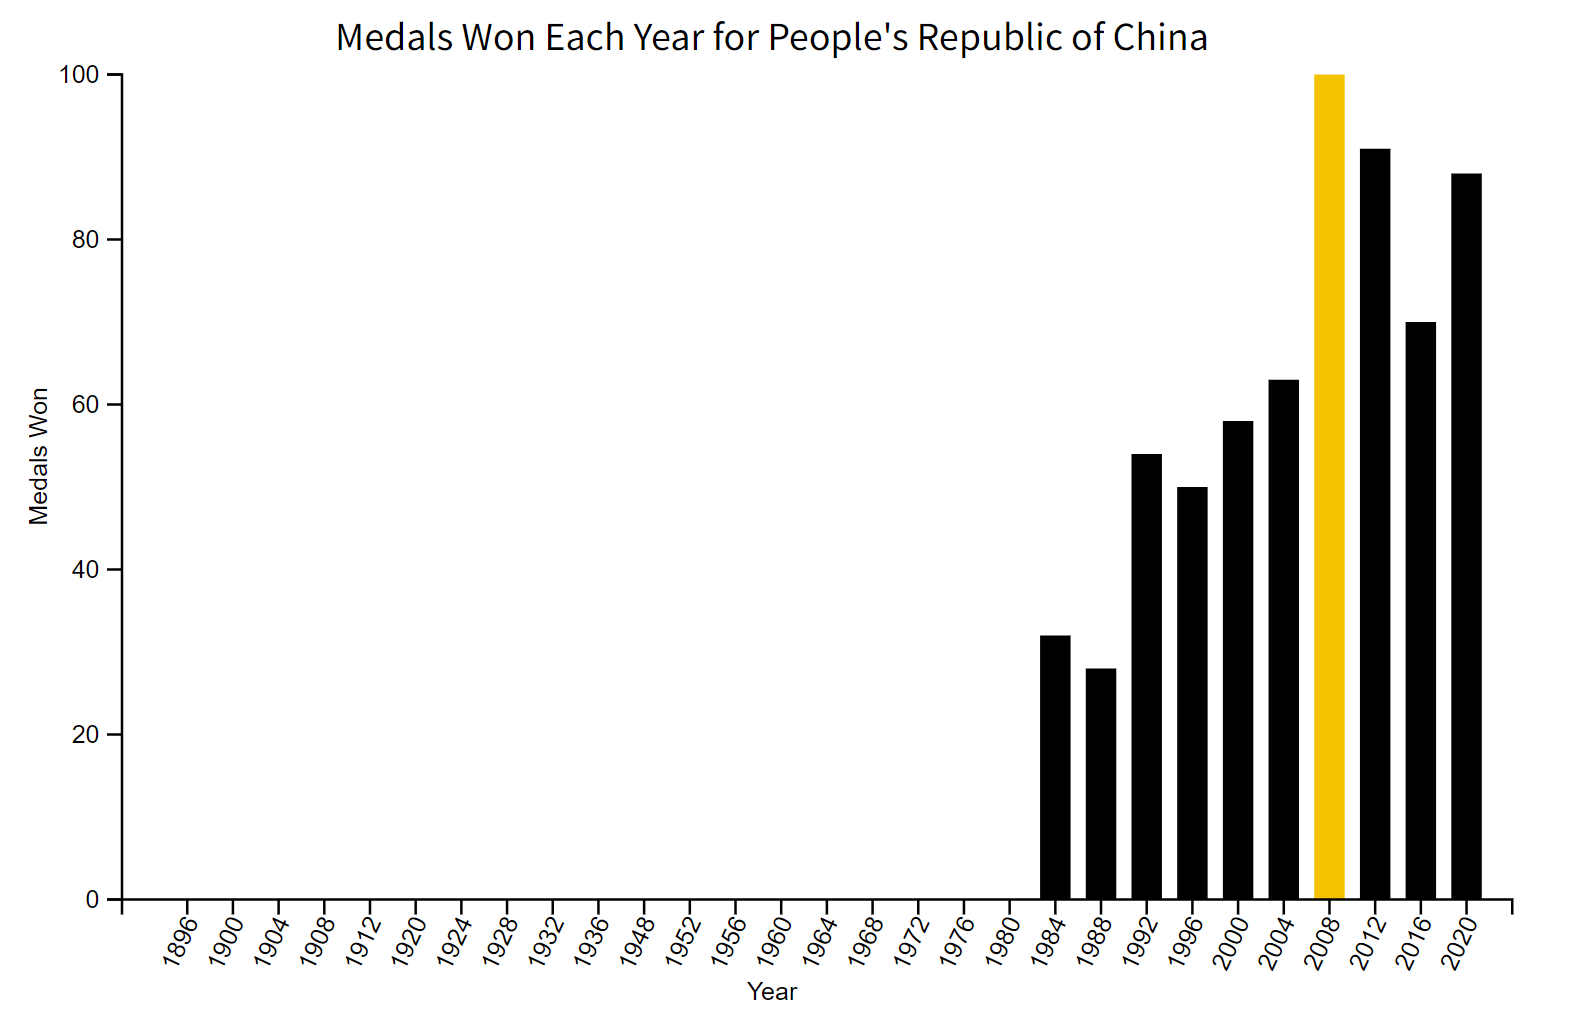
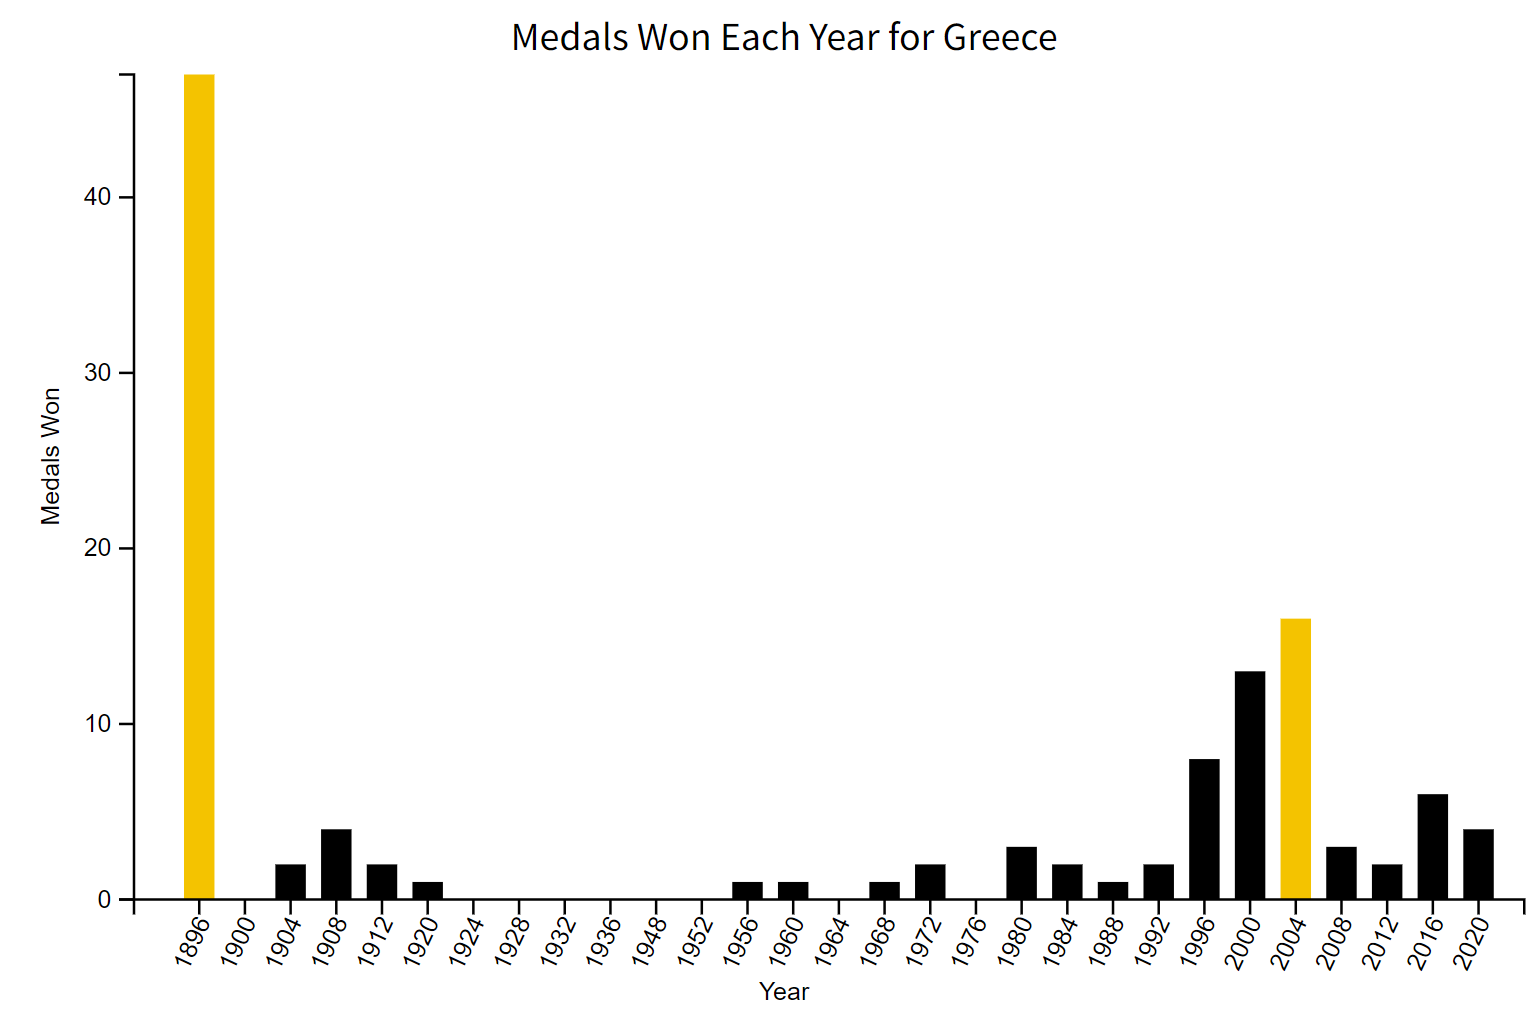
below for an example). For the medal history, a bar is placed for each Olympic games, with the height representing
medals won in that year, and the color indicates whether it was a home game. Home games are colored in gold, and
the bars are otherwise black. This helps answer the "home-field advantage" question. The views are shown below:
We are pretty happy with the state of the site at milestone 2. Our must-have features are met, and many of the
optional features have been implemented and tested. As a group we reflected on our feature list from the project
proposal, and none of us could think of why we made the "Country pages and rankings include their flags" a must-have
feature since it doesn't fit the theme of our project, so we decided to remove that. We felt it was fair to remove
because we have plenty of optional features already added, so we still have more than the original "must-have" list.
Potential changes for the final due date would be to finalize the winter olympic data and to get accurate team results.
We discovered that the data pulled from olympics.com (see data above) often does not include the
athletes for team events, so the medal counts for athletes are currently not 100% complete. Between Milestone 1 and
Milestone 2 we focused mainly on features with the current data, but can spend more time finalizing the dataset and adding
Winter Olympic results to the website for the final deadline.
We actually learned quite a bit from our visualization! It is cool to be able to see what the top sports of each country
are. It's not a perfect system for countries with very few Olympic medals, but for larger countries it is neat to see
what their strongest sports are and how they have performed over time. In total, the answers to questions
1, 2, and 4 are very quickly available on the sports page and the countries page. The top five countries in for any sport
are shown on the sports page. Up to the top five sports for any country are shown on the countries page. Top medalling
athletes are shown on the sports page. The only question that remains, then, is whether there is a home field advantage.
Answering the home-field advantage question requires looking at multiple different countries. Looking through some high-medalling
countries that have hosted the olympics, the trend has very consistently been that nearly ever home game for any country is among
their highest-medalling years. See below for examples: