“In the mid 20th century, a study was conducted that tracked down identical twins that were separated at birth: one child was raised in the home of their biological parents and the other in a foster home. In an attempt to answer the question of whether intelligence is result of nature or nurture, both children were given IQ tests.” (Kaggle) TWIN STUDY
For our project, we will use IQ data from mothers and their twin children to explore the question of nature versus nurture and identify which, if any, environmental factors influence intelligence. In addition to the twin dataset, we also use information on mother and (non-twin) child IQs, accompanied by details on maternal characteristics such as childbirth age and occupation.
We have different interests, so it was hard to find a topic we both wanted to visualize. We found this topic compelling and worth deeper exploration. The question of “nature vs nurture” is inherently intriguing, and this data offers many ways to tell a story. With many variables available, an interactive visualization will let viewers choose which features to include.
We are using four datasets from Kaggle. They include information on mother IQs, education level, occupation, childbirth age, and more. Source: Child vs Mother IQ (Kaggle).
We do not expect substantial cleanup since the datasets are well organized and contain no null values. We will, however, perform light preprocessing to ensure consistency across files.
We will standardize variable names (e.g., unify mom_age and momage to mother_age) and align shared variables such as child IQ, mother IQ, and education level.
This makes merging easier and ensures uniform data types for D3 visualization.
After cleaning, we will merge the datasets based on common variables (IQ scores and parental characteristics). From the combined data, we will derive several quantities to measure nature and nurture influences:
Data processing will be implemented in Python (Pandas and NumPy) for merging and feature creation.
We will export a single cleaned .csv for visualization in D3.js and compute descriptive statistics and correlations to guide which relationships to feature visually.
We will meet Tuesdays and Thursdays after class from 1:00–3:00, as well as Monday nights.
Four rough ideas:
Design Evolution The design changed quite a bit over the course of this project. For example, we were going to use 3js to have a 3d brain, but we eventually realized it didn’t fit well with the rest of the project so we did not implement it. Additionally, we wanted to have users click on different visualizations to enlarge them, but we decided against this; we thought it might be better to have a scrolling feature so we could decide which order we wanted the visualizations to appear in, and guide the story a bit more.
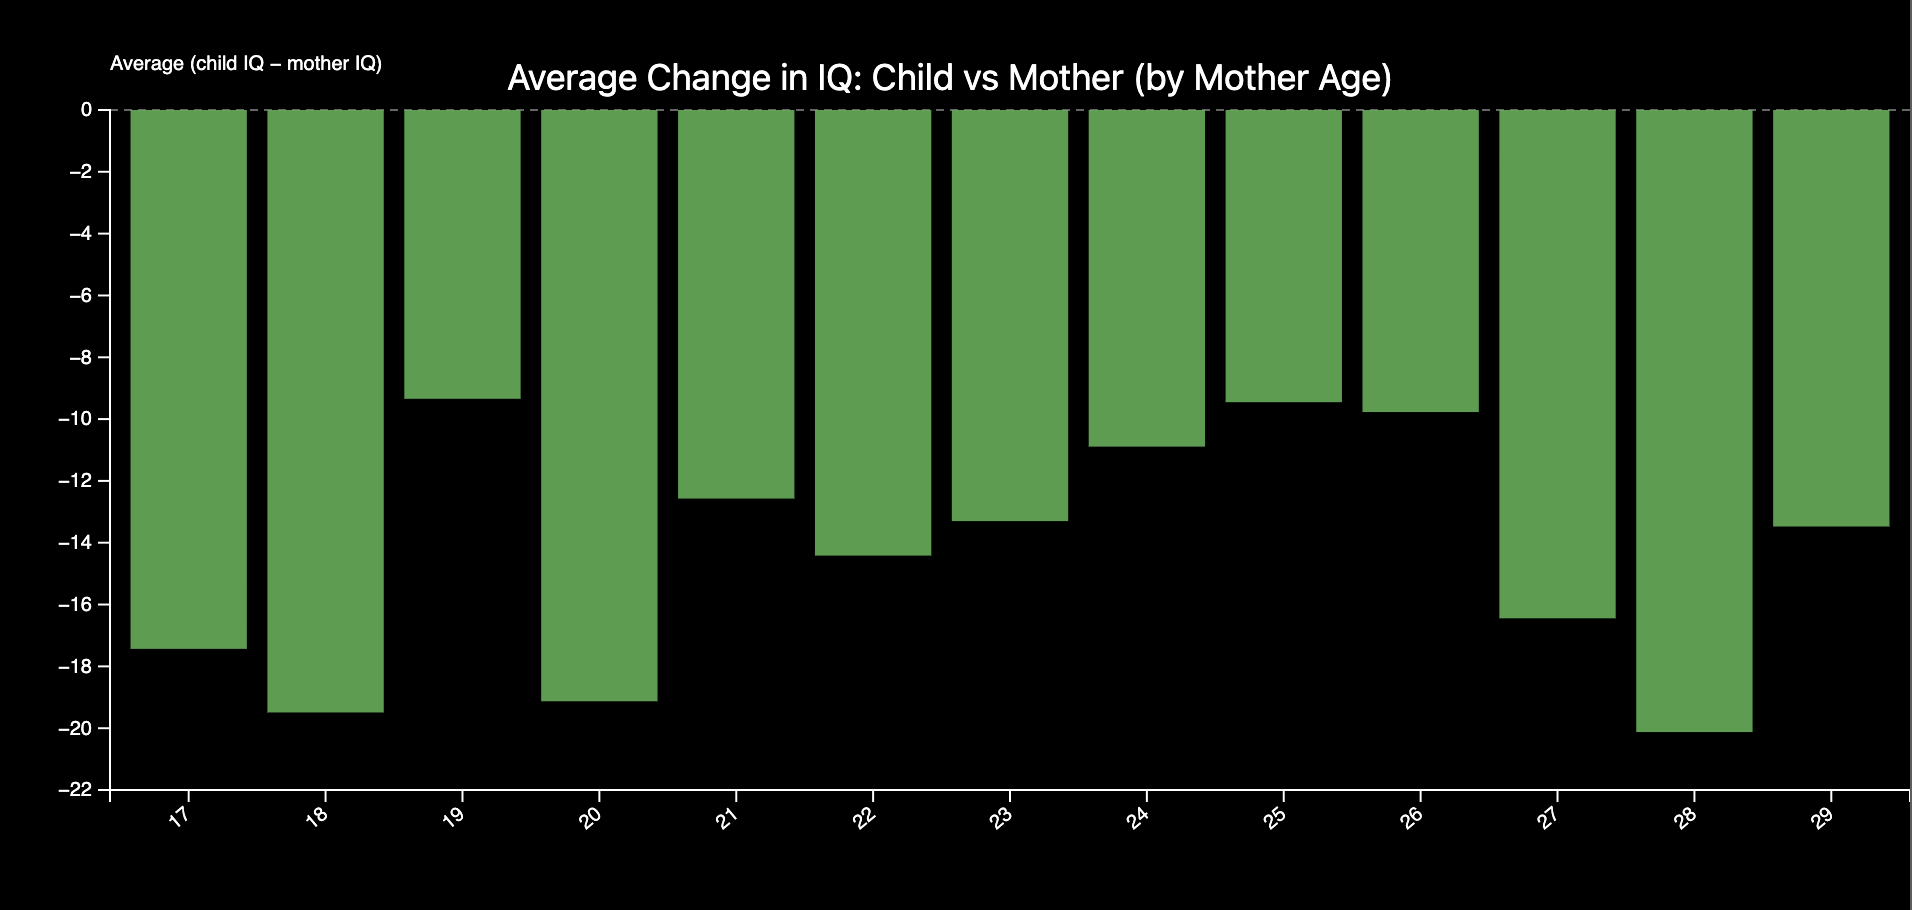
There were also visualizations that we made but did not include. For example, our line graph was originally a bar graph (photo attached below.) We switched it to a line graph so it would be easier to see a trend in the data. We also wanted to add an interactive spider graph for the last visualization, but unfortunately one of our laptops broke unexpectedley
Our first scatterplot allows the user to compare mother and child IQs. This is the user’s first introduction into the Nature vs Nurture debate using data, so we wanted the first visualization to be the most straightforward.
The second visualization, a bar graph, compares average IQs between kids whose mothers did and did not complete high school. While the first visualization suggests that nature plays a role in child iq, this visualization implies that nurture may also play a role. By this point, we want the user to have two somewhat conflicting pieces of evidence, and for them to be interested to move forward.
We used a linegraph to show how a mother’s age at childbirth may impact that child’s Iq. We also added dotted lines to make the graph a bit easier to read, and a tooltip on the points so users can inspect the values.
For our 4th visual we had a cross graph comparing biological kid IQ to their foster twin IQ based on socioeconomic status. After creating this visual we realized that it was hard to see how different socioeconomic status affect IQ so we decided to make a 5th chart that would show this difference in a clear and effective way. This became the bar chart showing the difference between biological and foster twins based on each type of socioeconomic status.