Final Project Process Book
Jianing Ding d.jianing@wustl.edu 511617
Peiqi He h.peiqi@wustl.edu 515725
Background and Motivation
The goal of this project is to enhance the travel planning experience for Delta Air Lines' frequent flyers
by creating an interactive visualization of international flights operated by Delta in October. The motivation
is to provide a user-friendly tool for members to efficiently redeem their points and select the most convenient
flights based on location, time, and other specific preferences. Meanwhile, the available designed tools also
allow user to explore how Delta airline operate international flights within 13 domestic airports in regard of
flight fleet, date of week, issued date and end date.
Related Work
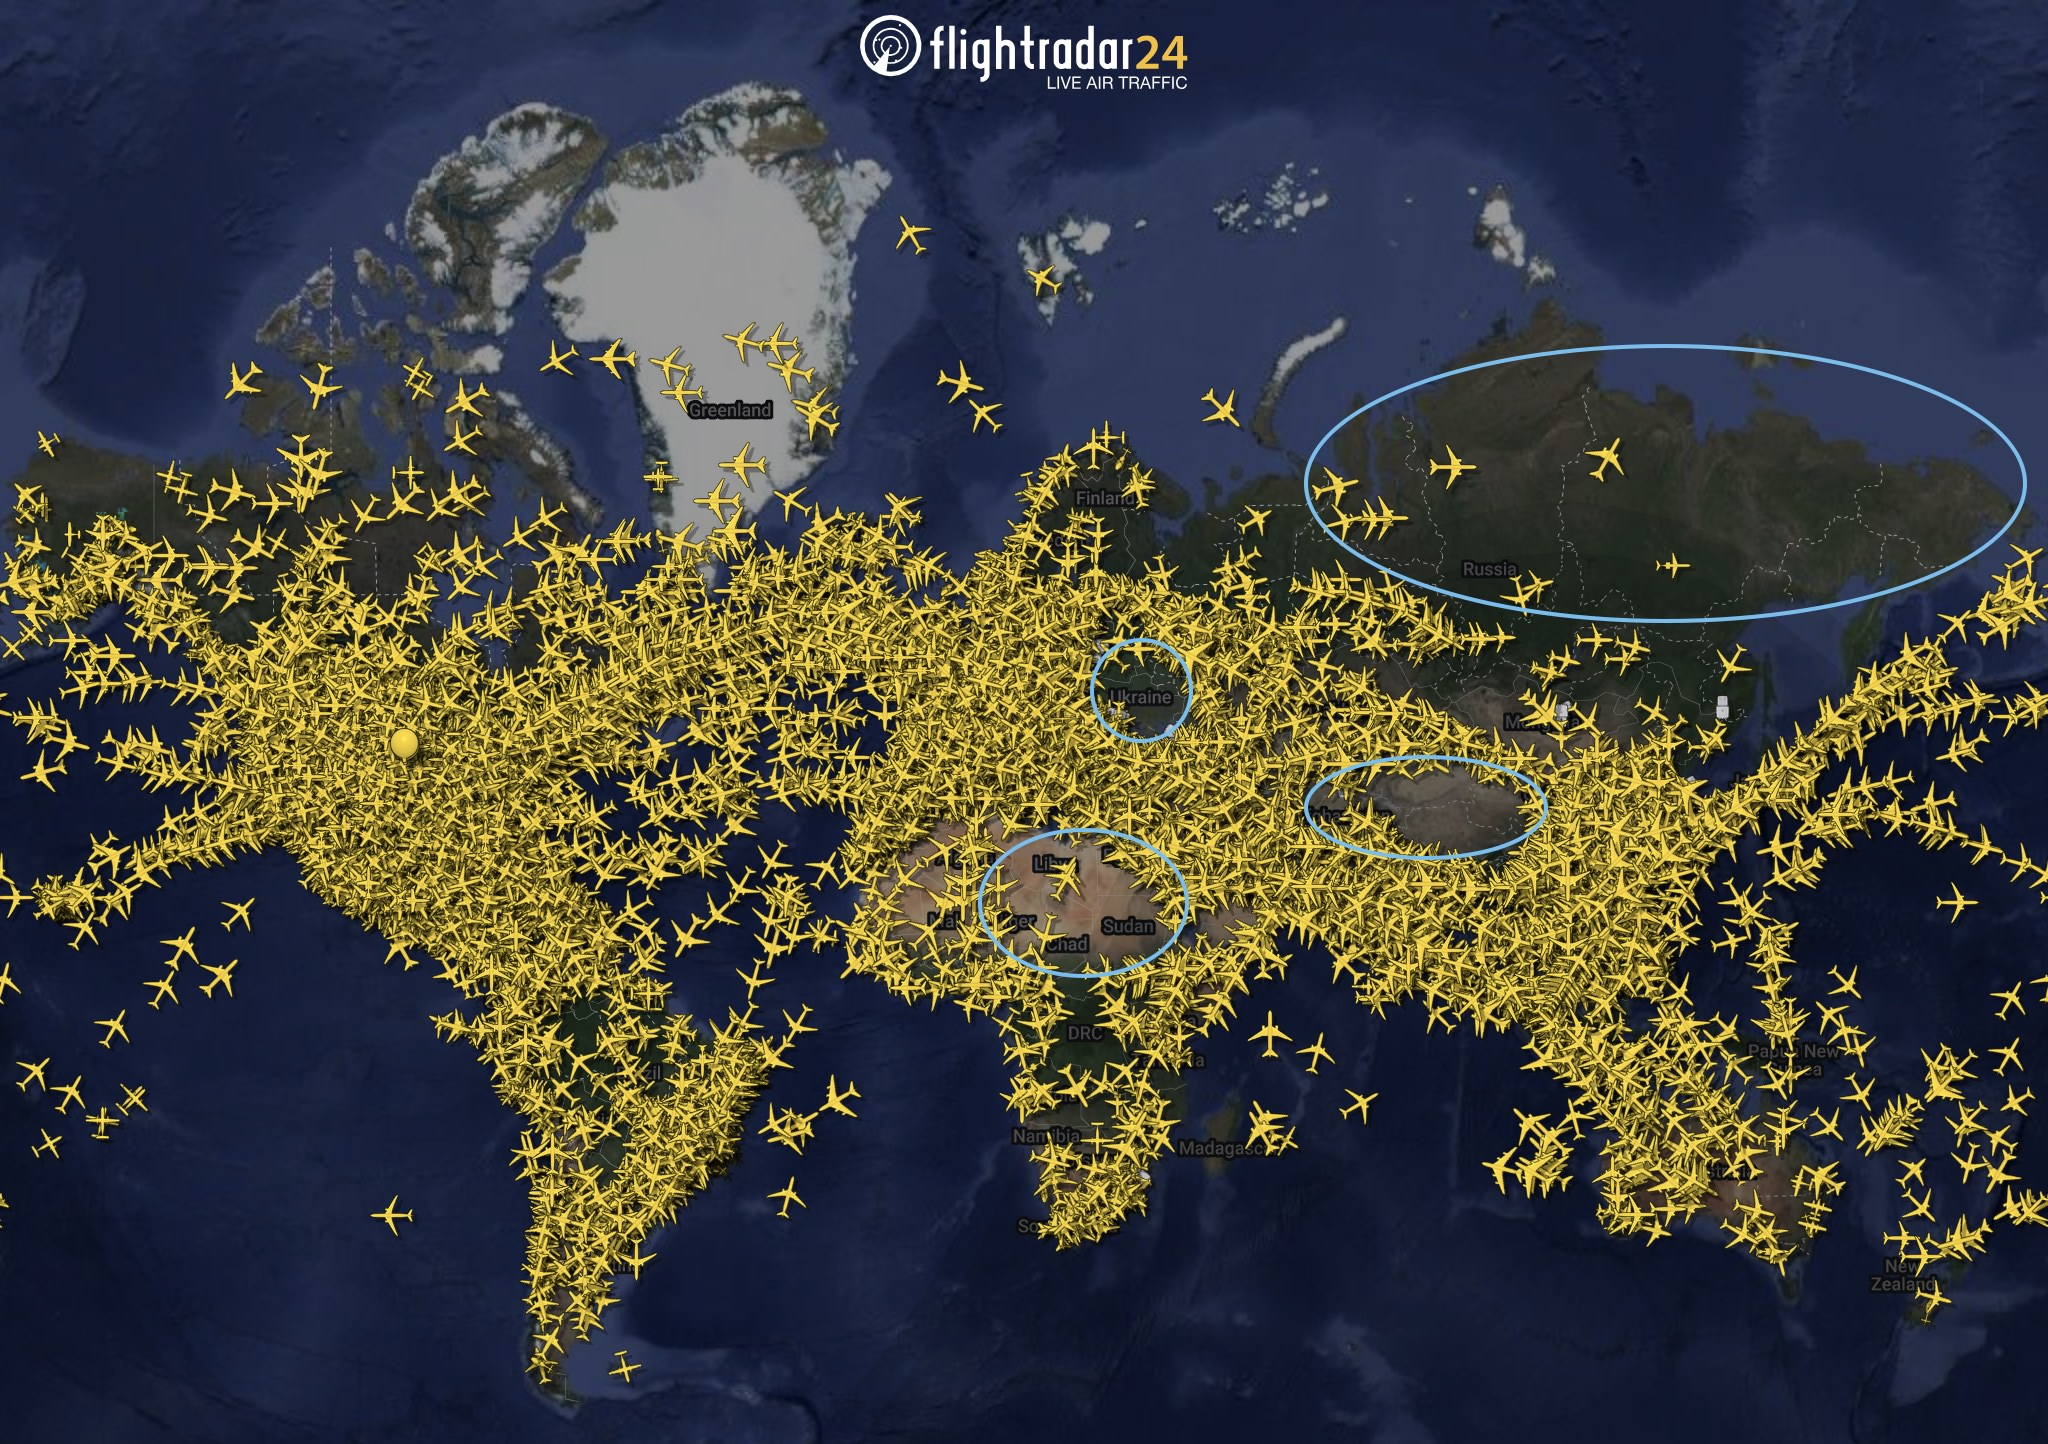
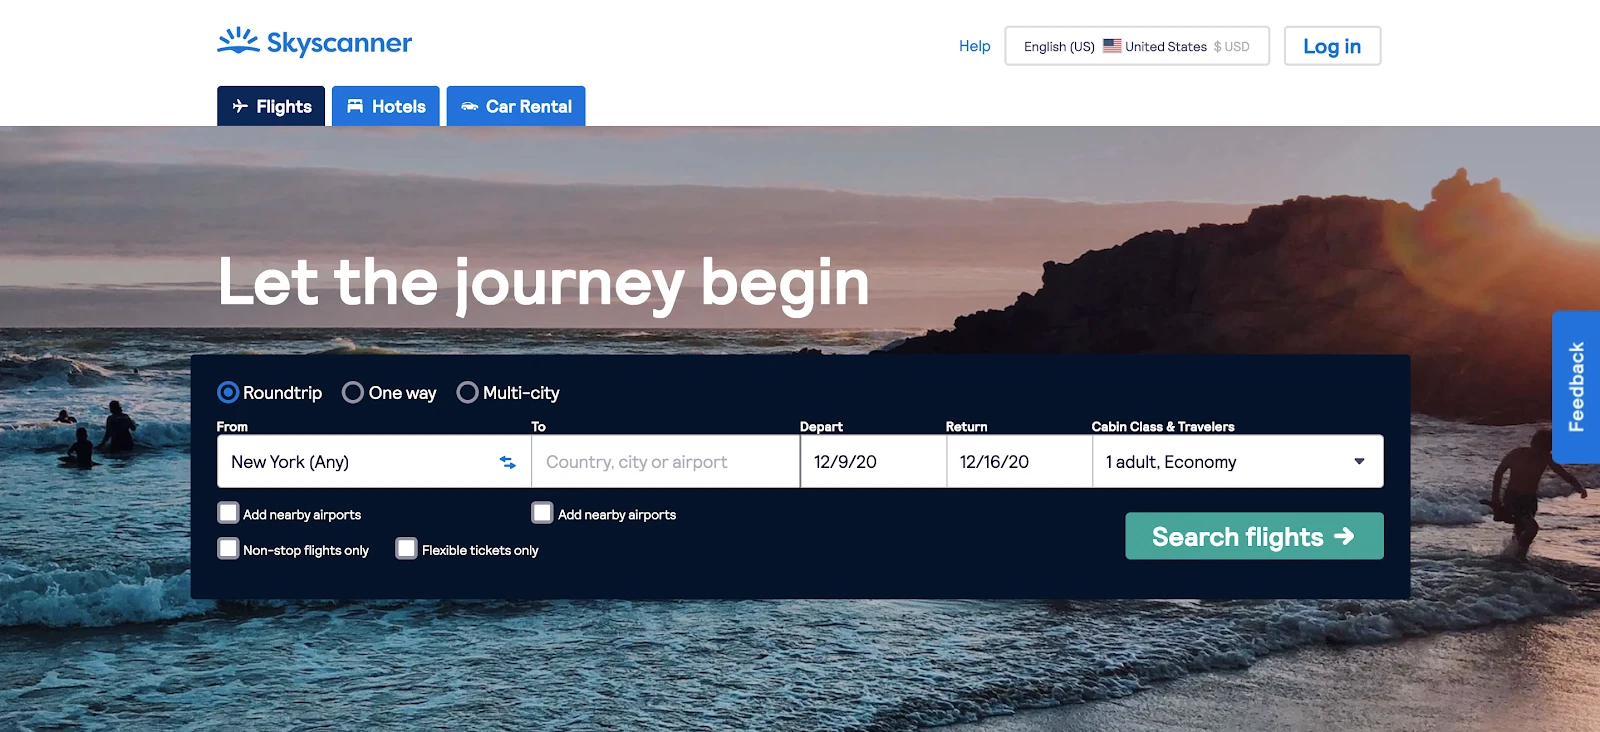
This project is inspired by various flight visualization tools and heat maps that showcase global flight
patterns. Resources such as the 'FlightRadar24' website and academic papers on GIS (Geographic Information
System) applications in aviation have informed our approach. Discussions in class about interactive data
visualization have also played a pivotal role in shaping our design.
Questions
1. Where do international Delta flights depart from and arrive at?
2. What are the specific dates, times, and frequencies of these flights?
3. Which direct international routes are available?
Throughout the project, these questions evolved to consider the user experience and the visual
representation of data. New questions included how to make the visualization more interactive and
informative, such as incorporating a search function or showing flight details on hover.
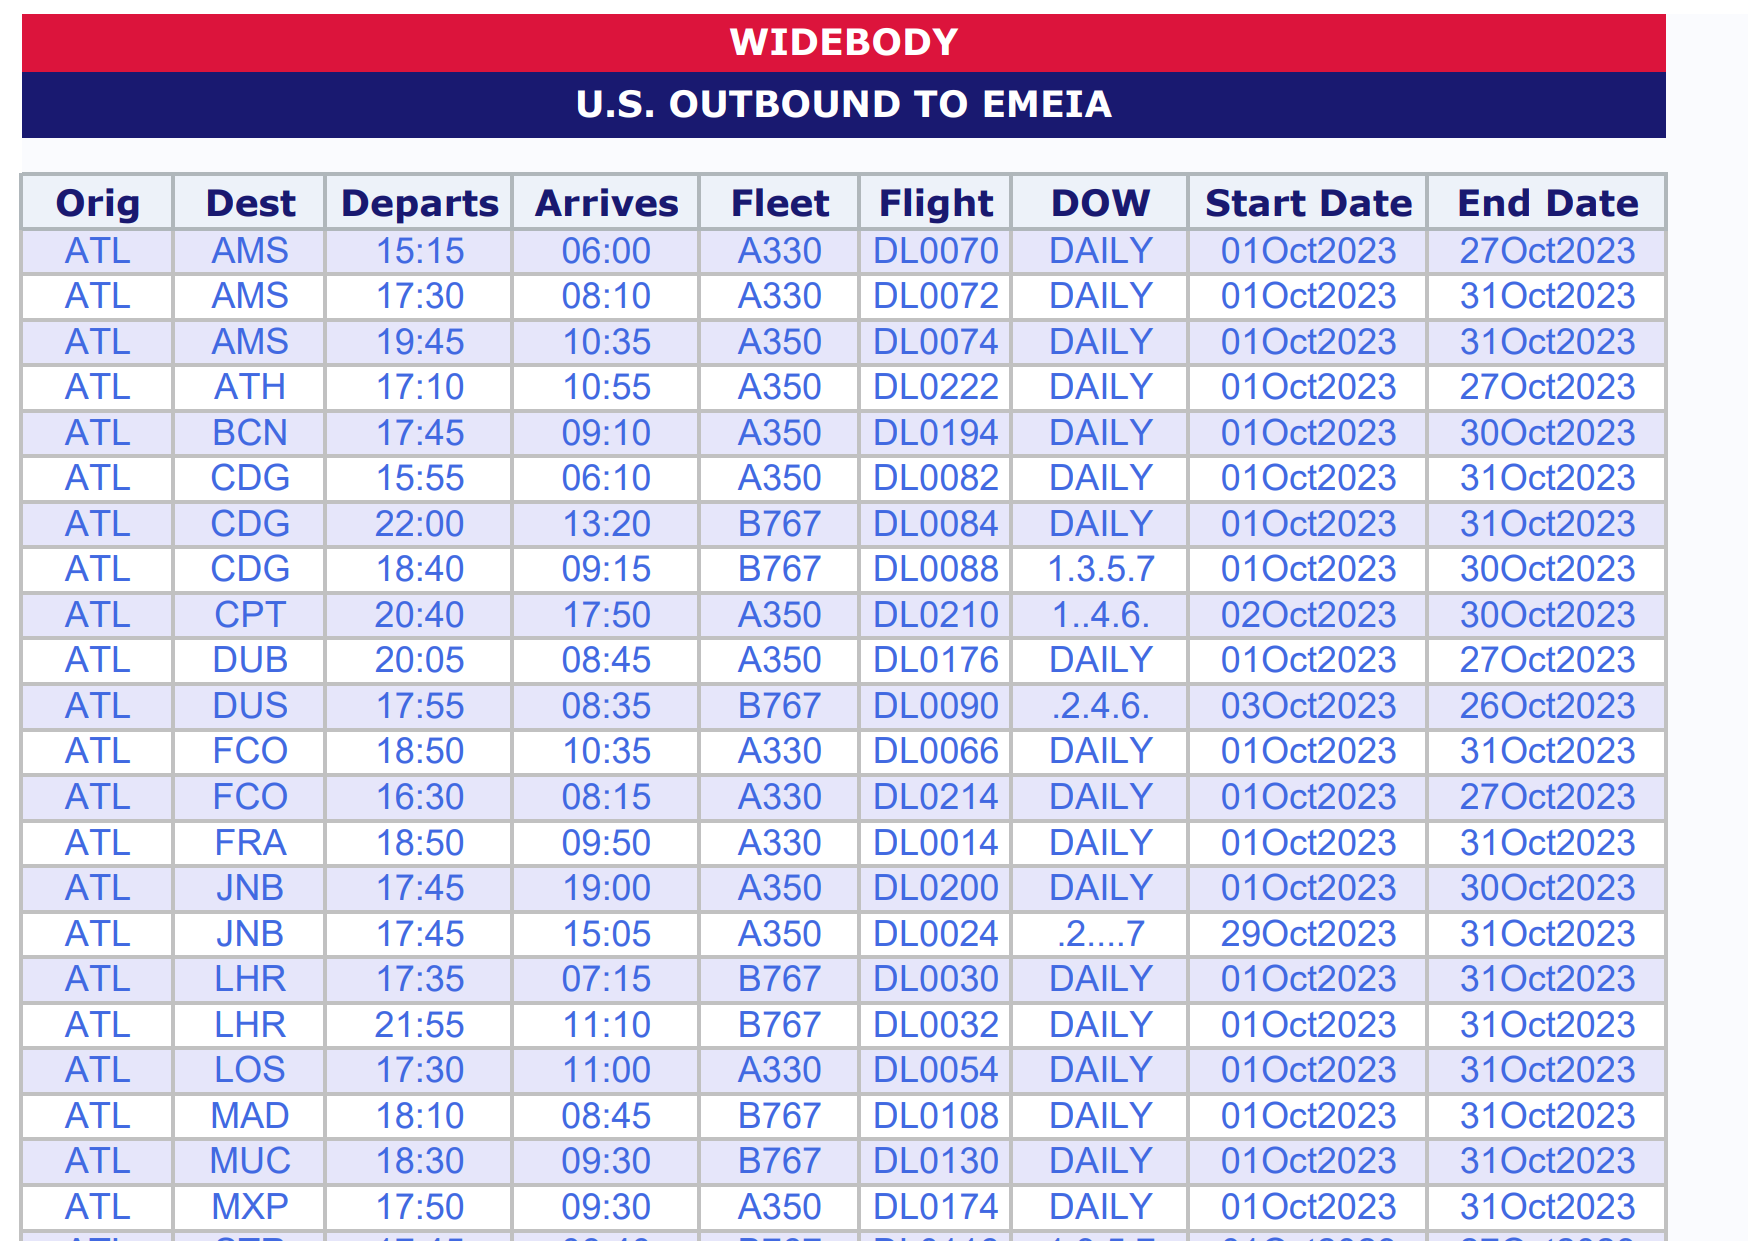
Data
The data was sourced from Delta Air Lines' international flight schedule, available at Delta's official
website Delta Cargo. The initial dataset was in an Excel format,
containing information such as origin, destination, flight time, etc. This was cleaned and processed to
enhance readability and utility.
Data Processing:
Initial visualizations included basic maps with plotted routes. Insights from these early visualizations
indicated the need for a more interactive approach, leading to the adoption of GeoJSON for more sophisticated
geographic representations.
- Grouping domestic airports have scheduled international flights
- Combining all the flights regardless of their final destination
- Supplementing the associated latitude and attitude for each airport
- Including the start date and end date for each flight
- Including Date of Week(DOW) for each flight schedule
- Calculating the amount of flights originated from each domestic airports
Design Evolution:
1. A global map highlighting routes between the selected country and America.

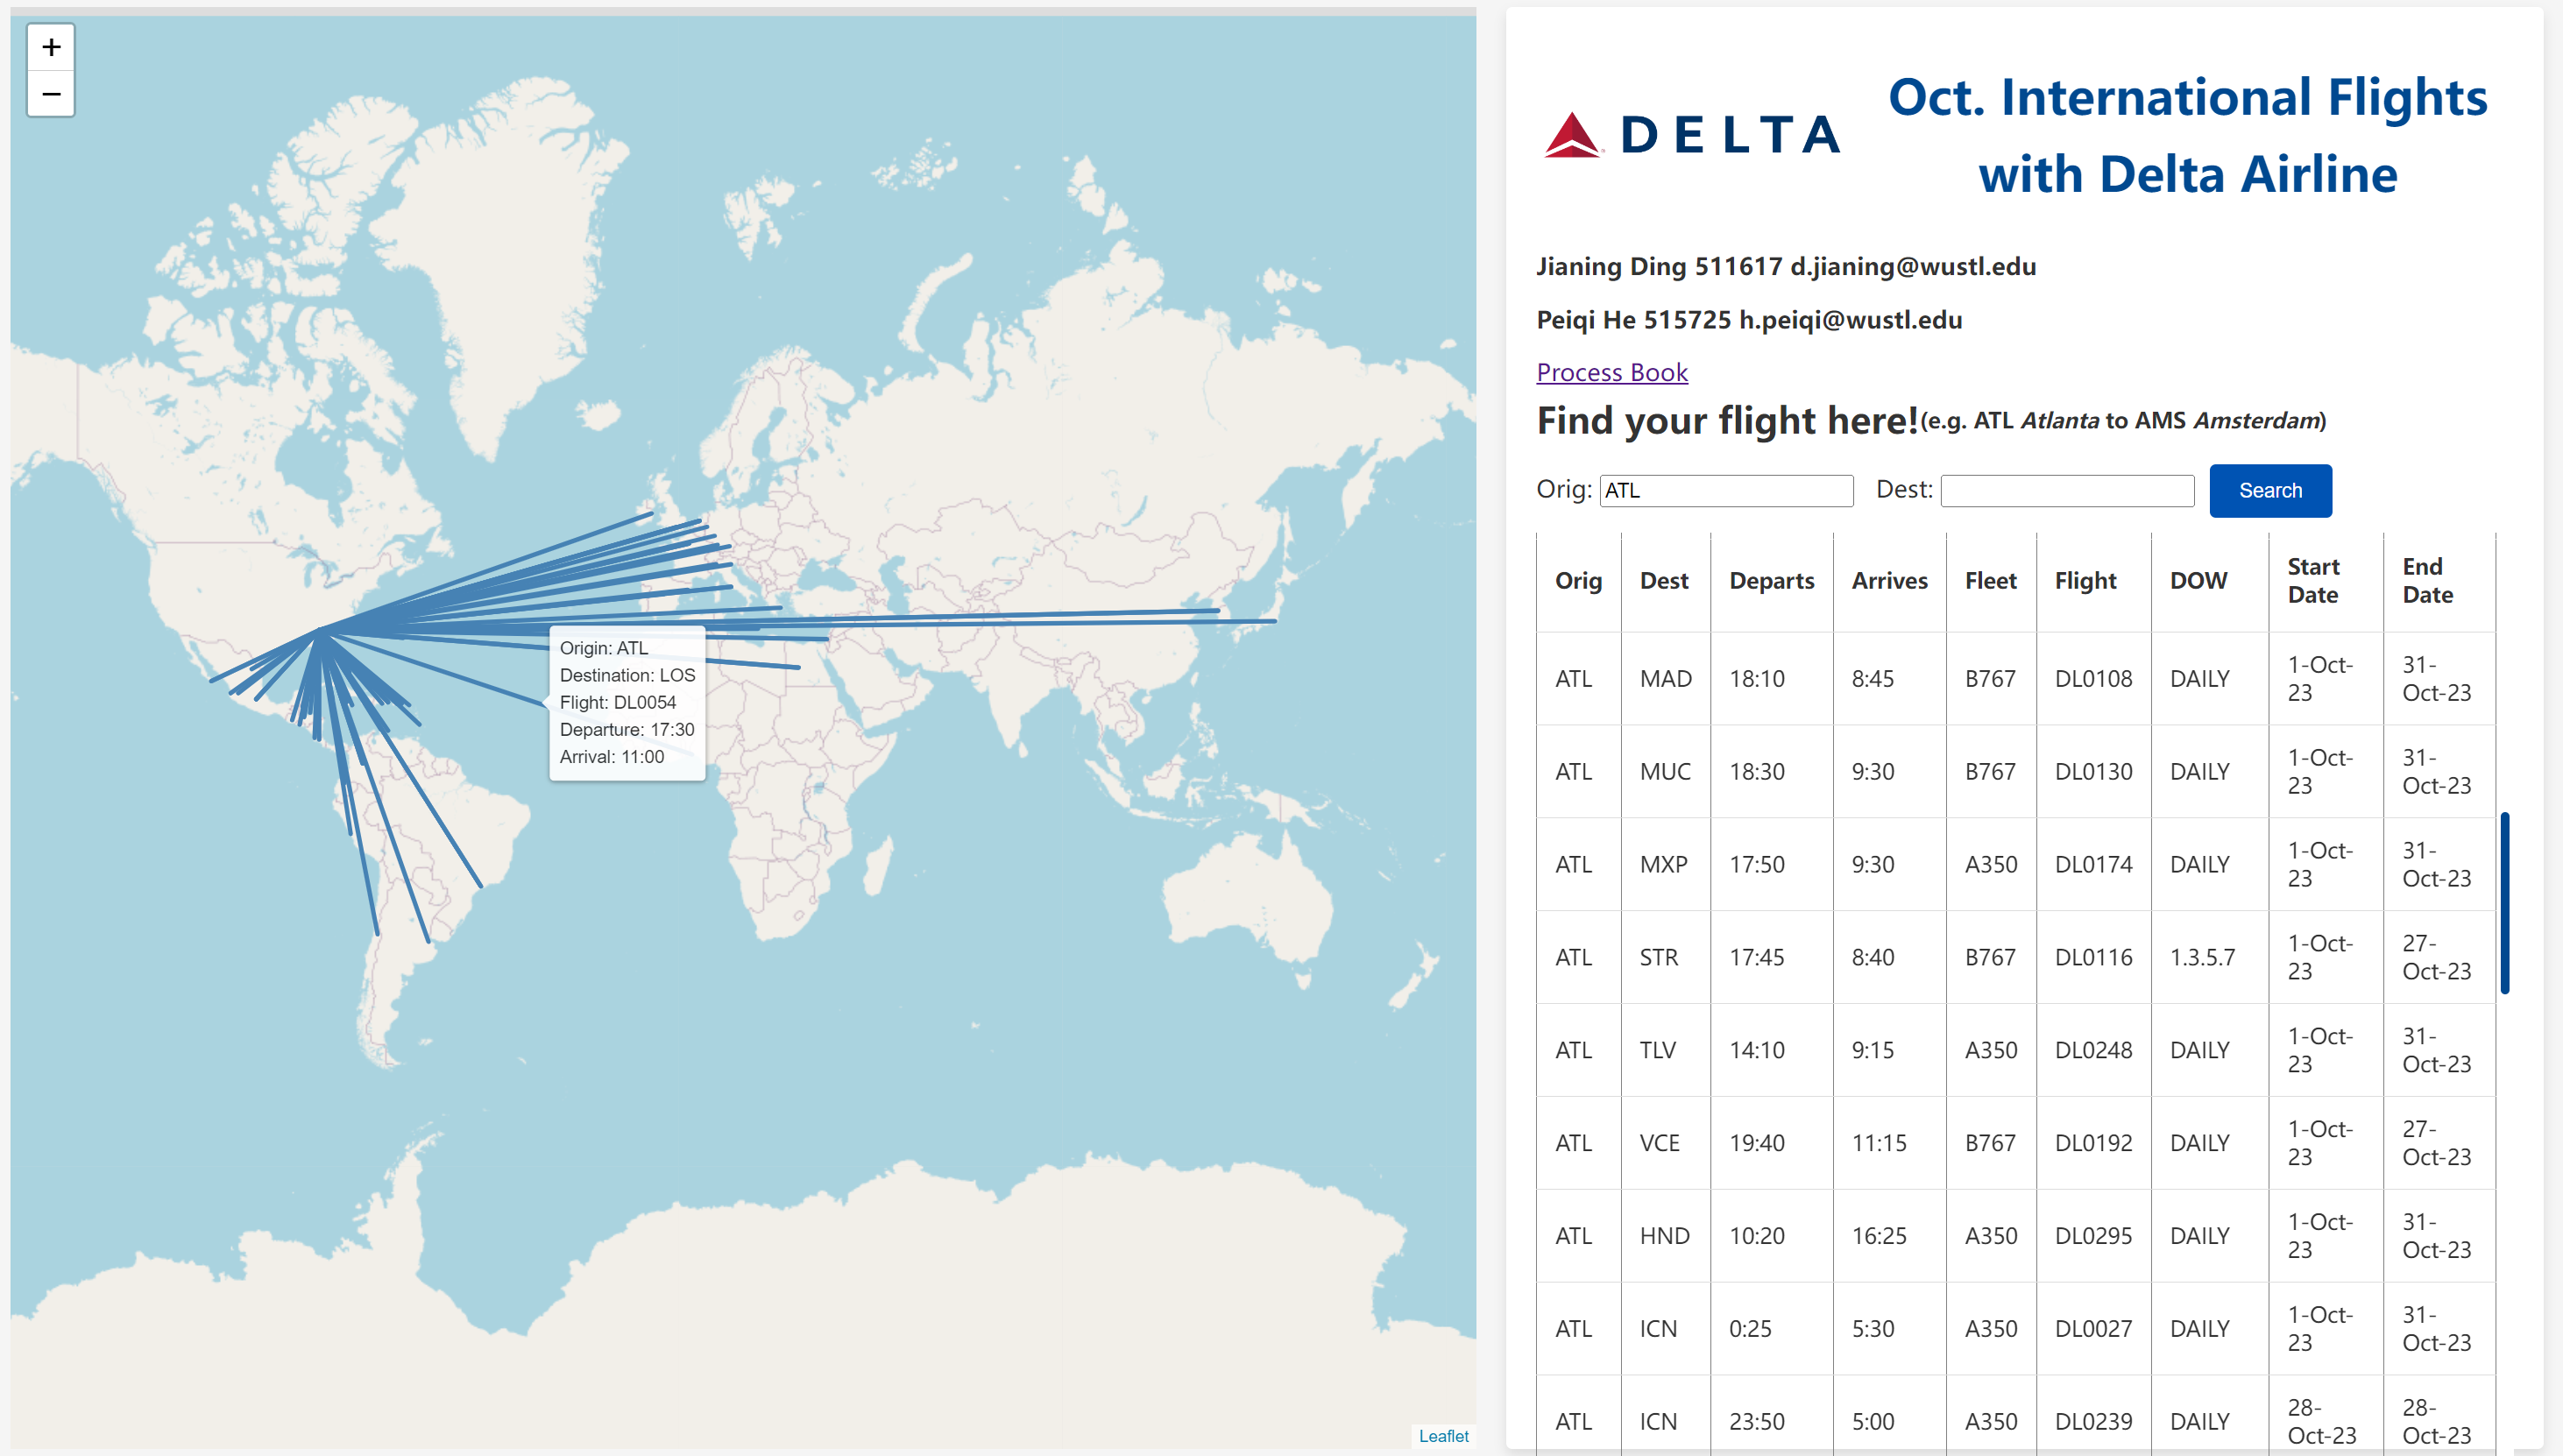
2. A design showing all routes from a chosen departure city.
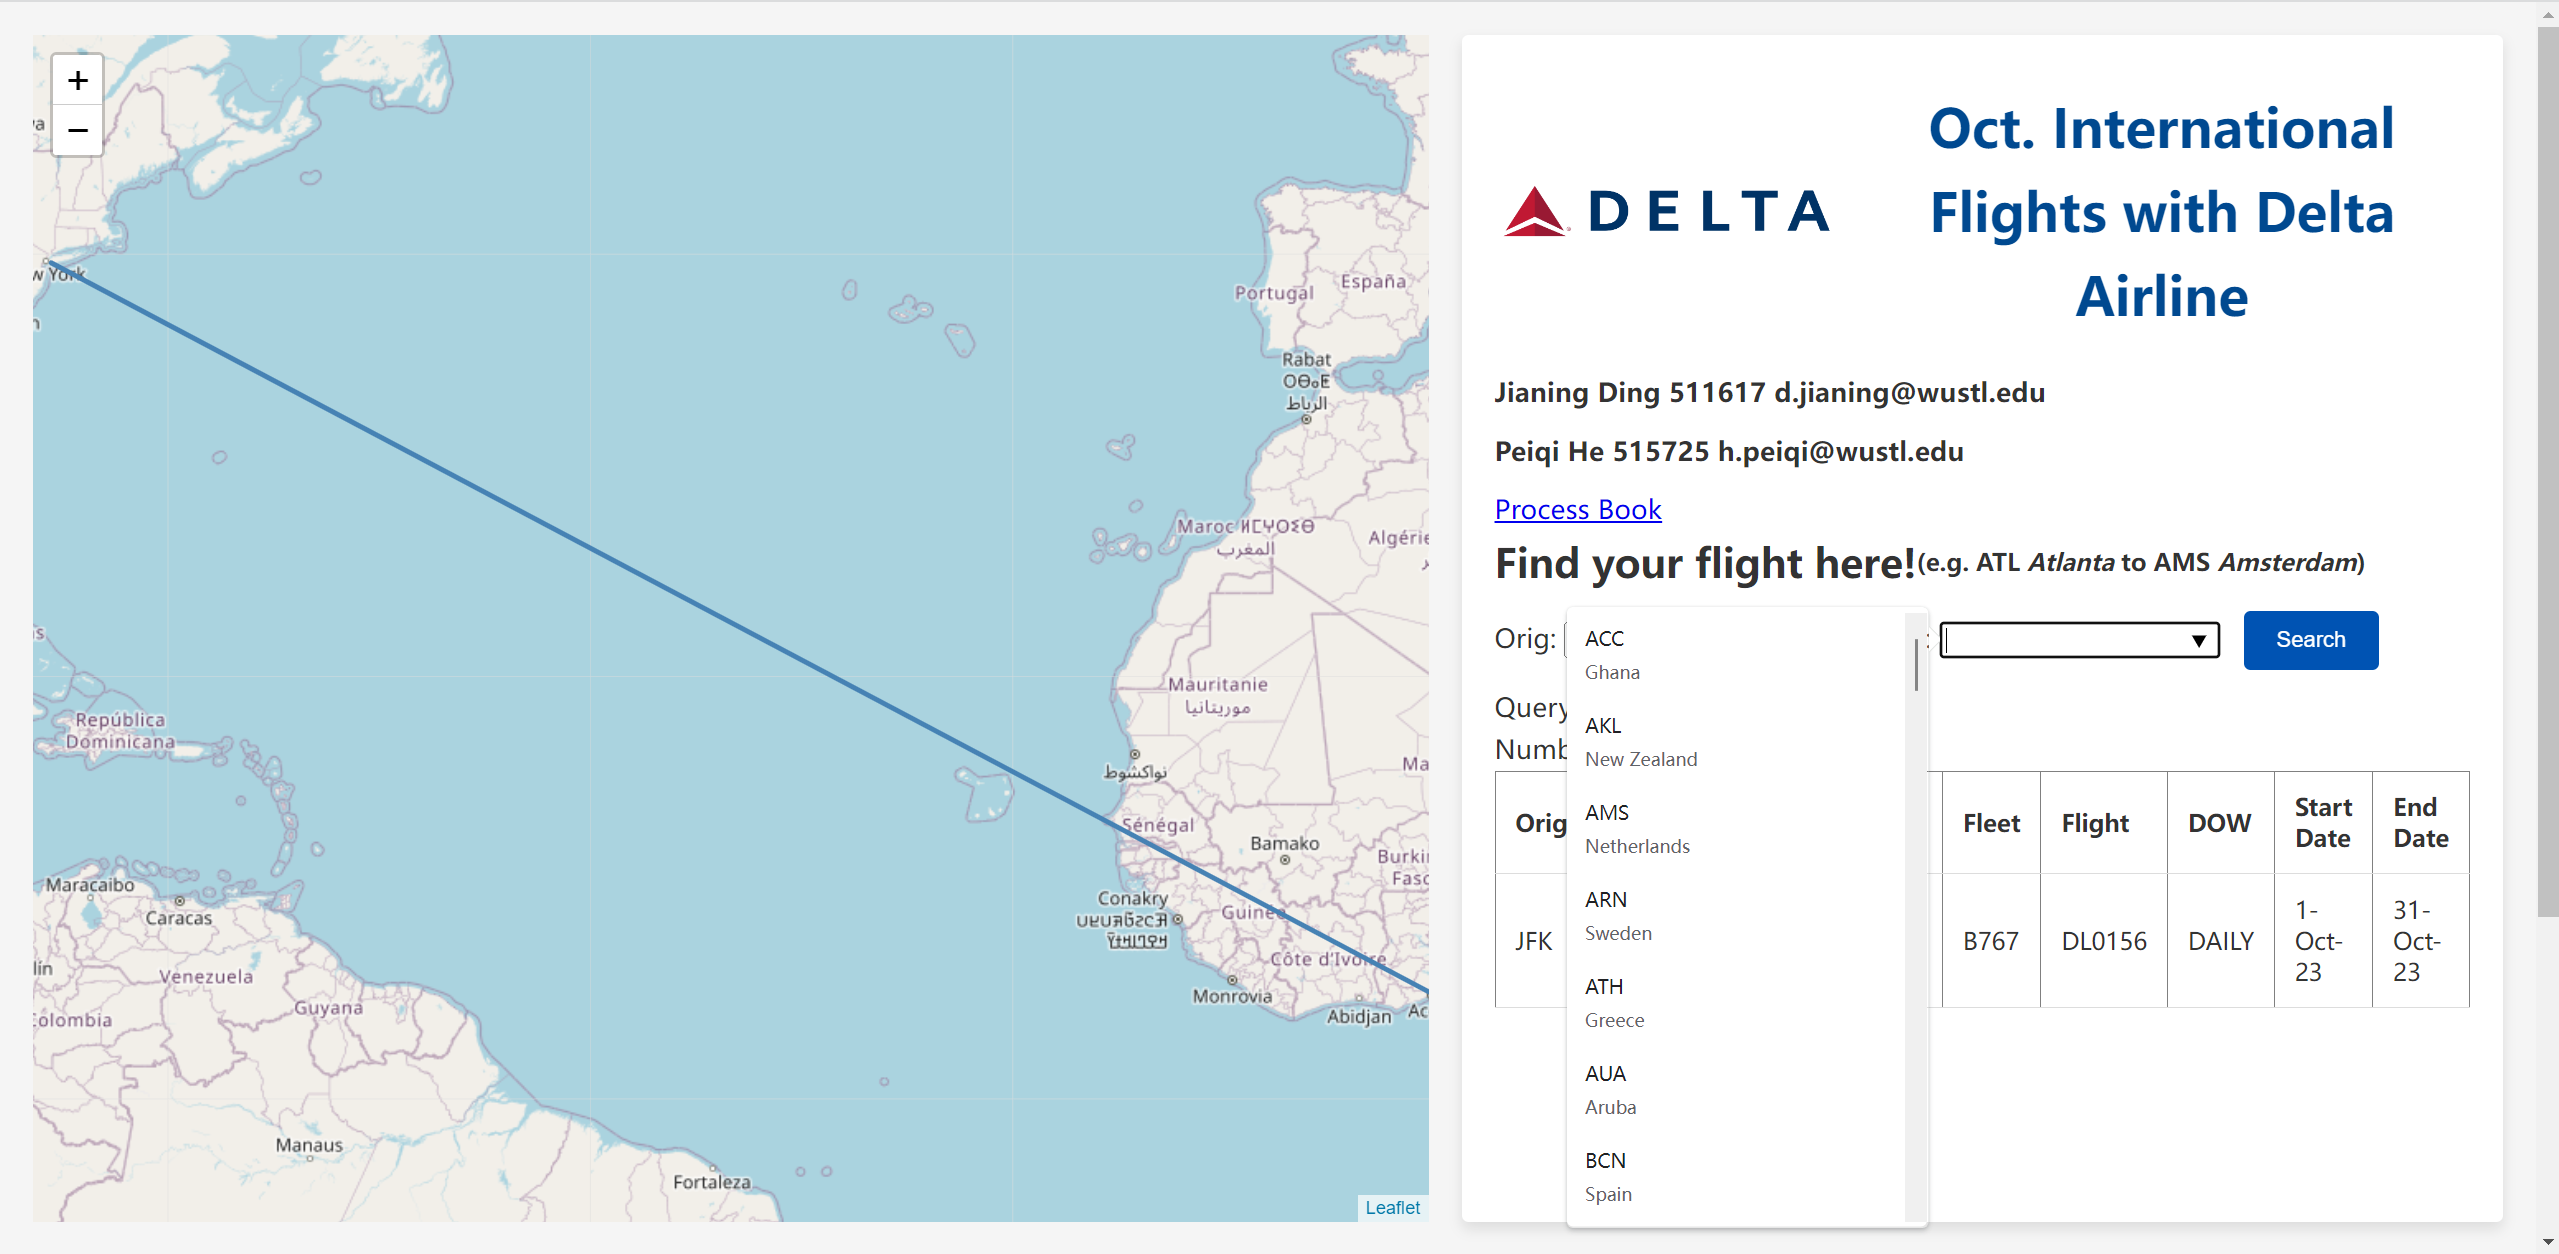
3. A searchable bar allowing users to input departure and arrival cities to display corresponding routes.
The final design chosen was the third option, providing a balance between interactivity and information
clarity while showing the direct flight on the heat map.
User Testing:
- How intuitive did you find the navigation on our website?
- Do you find the features easy to implement? Was there any confusing tool?
- When interacting with the map on the left, do you find it useful to explore available international flights?
- Did you think the right chart useful for you to design what specific flight you desire?
- Do you encounter any technical issue while using the tools?
- Do you think the available tools make it sufficient to design your international trip with Delta?
Evaluation:
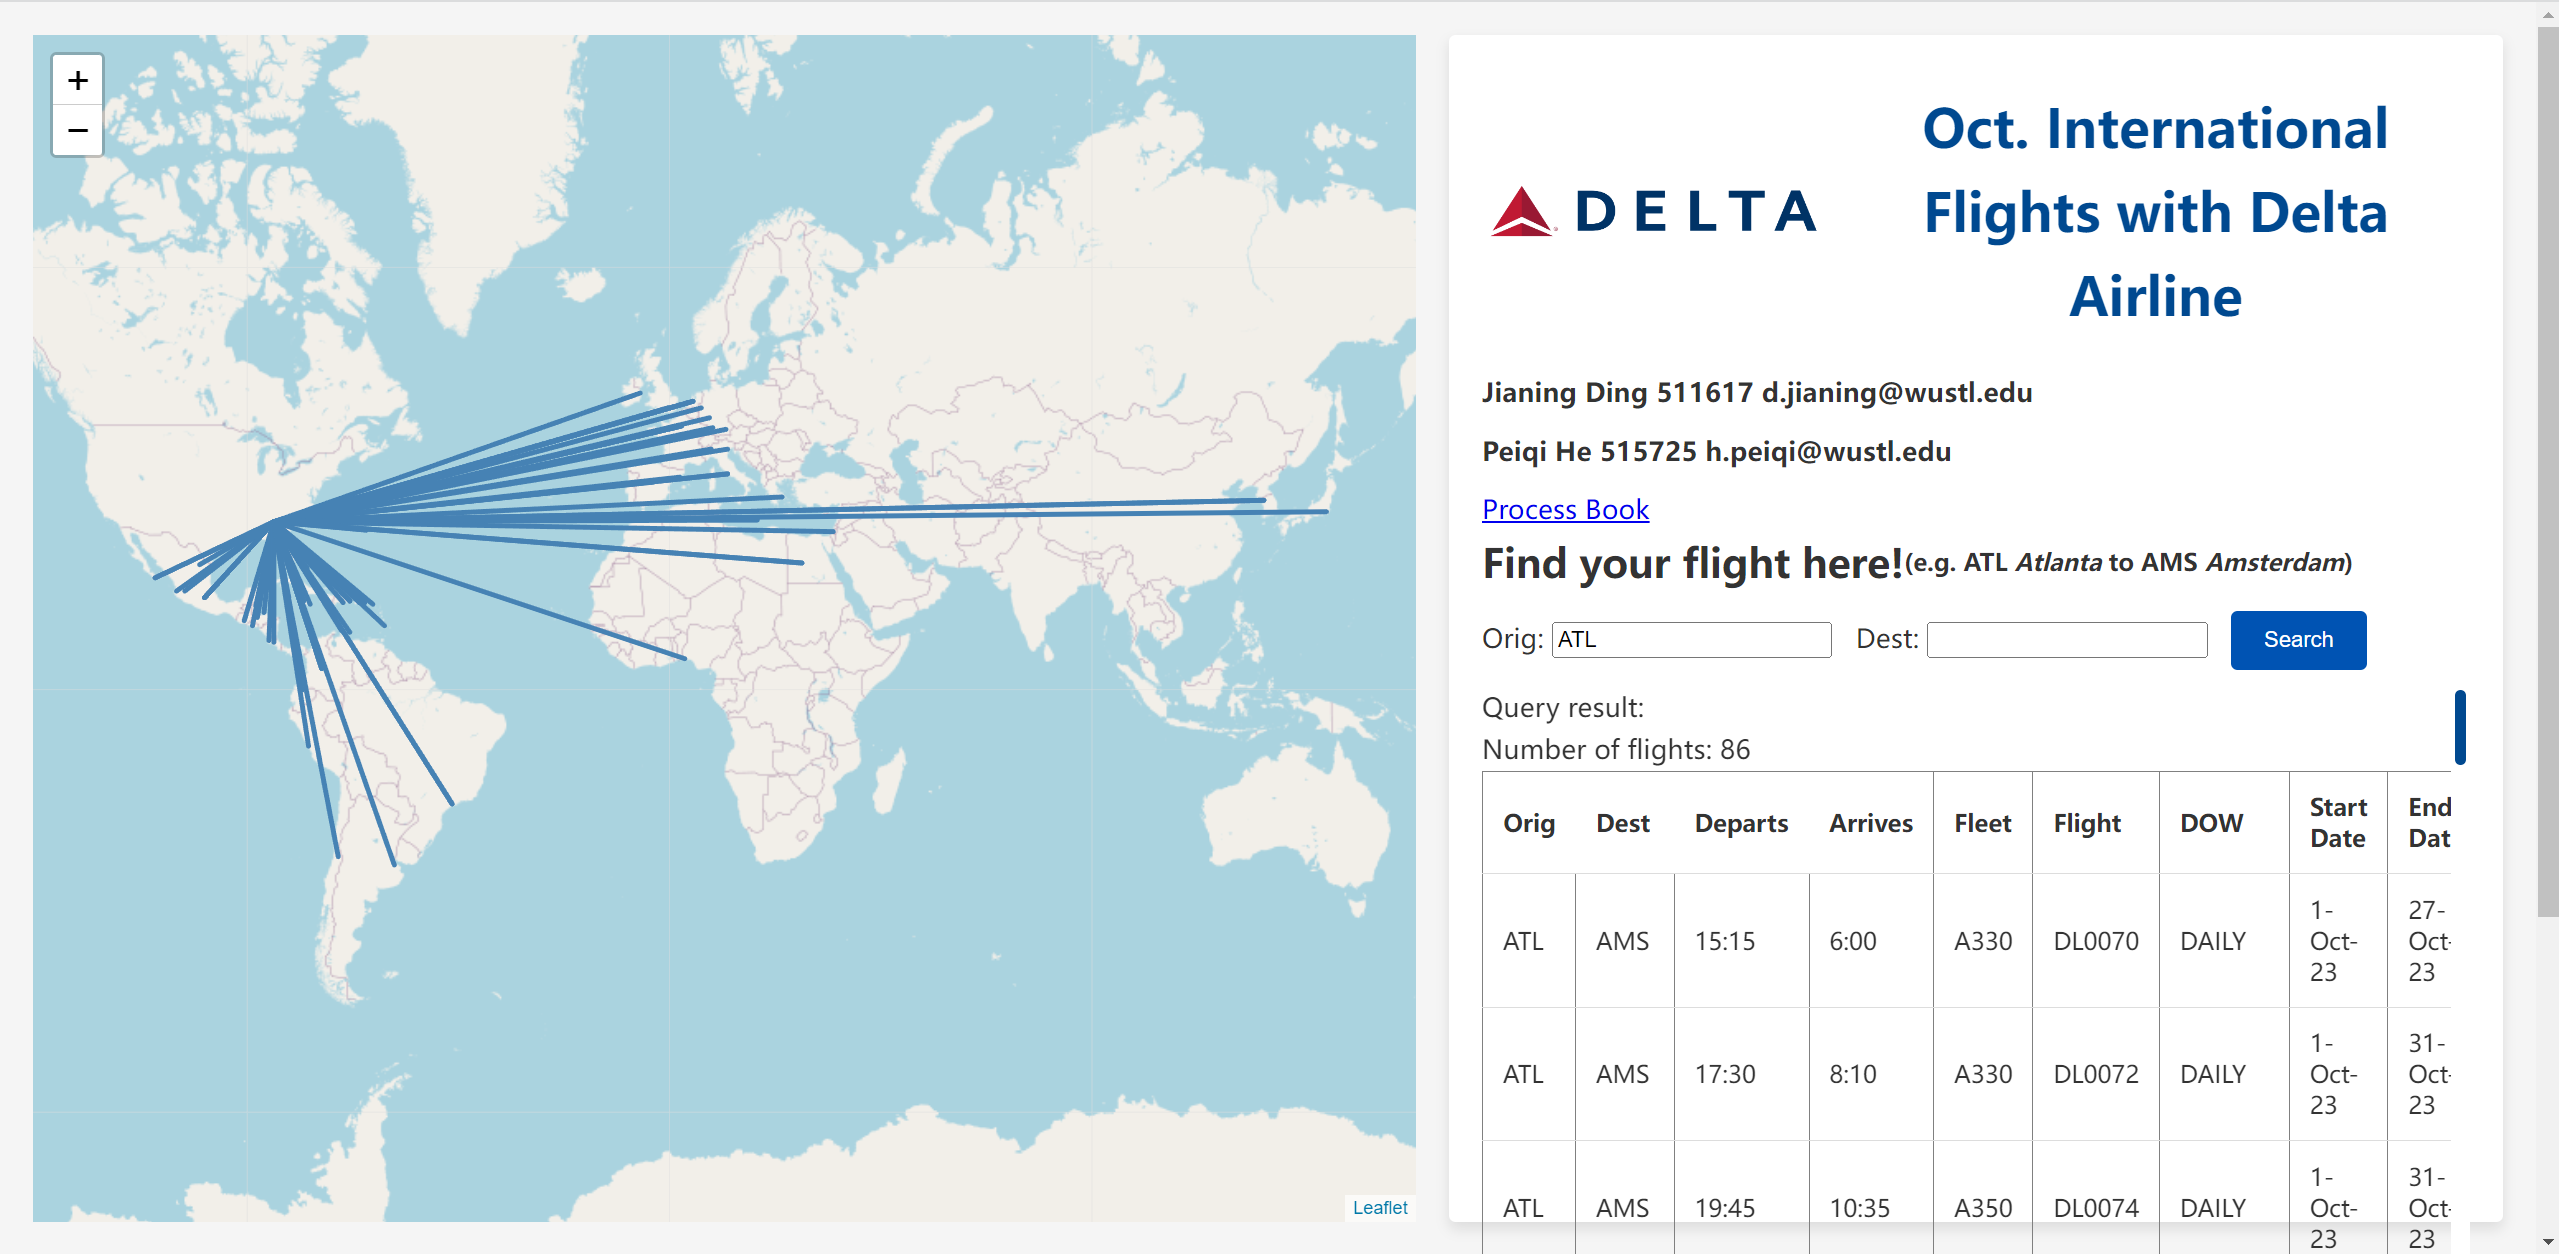
- We found that there are 13 domestic airports have international flights with Delta Airline, while Atlanta
and New York have the most flights with respect to their status of travel hubs. Meanwhile, Boston, Seattle
and Minneapolis also have dense flight schedule that we believe Delta Airline has design them to be new transit hub.
Lastly, Delta airline operate most international flights with final destination to Europe.
- Through the interactive visualization, the user could navigate which desire flight they prefer by exploring
on the left map, searching the available flights on the bar on the right, and select the suitable flight number.
The user could also explore how Delta operate and the number of international flights within the States by
exploring 13 airports on the search bar.
- Current visualization works well to satisfy the basic needs for users to explore available international flights.
To further improve the user experience, we believe providing further information such as price and delay status
could be useful if we acquired those information.