Rat Pack: Process Book
CSE 4507 Introduction to Visualization, WashU, Fall 2026 · Jacob Kupferman and Eliana Sobel
Last updated 2026-11-09. Covers the project from proposal through the built visualization (index.html). The user study planned for 11/24 is still to come and will be added to Evaluation.
Overview and Motivation
New rankings of the “rattiest” cities appear every year. Some are built by counting pest-control customers, a sample that skews toward people who can afford pest control. That raised the question this project is about: who is actually most affected by rats, and does the city's attention follow the need?
The underreporting of rats in low-income areas is an old story. A 1969 review estimated that reported rat bites were less than a third of the real total, because poor residents rarely reported them (Clinton 1969). A 2016 Baltimore study found low-income residents were less likely to report daily rat sightings, partly because they didn't know how and partly because they didn't believe the city would respond (German & Latkin 2016).
New York City publishes every rat inspection it performs, and it is the city most associated with rats, so we use it as a modern test of that old claim. The project is an interactive visualization that links rat inspection results to neighborhood income and housing across all 2,325 census tracts, and that separates the effect of where rats are from the effect of where the city chooses to look.
The original topic was broader (rats and infrastructure damage, biodiversity, disease, climate). We narrowed it because no NYC data exists at the right scale for those outcomes; they remain context, not findings (see Questions).
Related Work
| Source | What we took from it |
|---|---|
| Clinton (1969), Rats in Urban America | Historical hook. NYC reported ~600 rat bites a year in 1955-63, and surveys put reported cases under one third of the true number. Bites clustered in crowded, substandard housing (in Atlanta, 70% of 499 bites fell in 12 of 86 tracts). |
| German & Latkin (2016), Exposure to urban rats as a community stressor | Mechanism for the complaints-vs-inspections question. In their Baltimore survey only 31% of residents in high-rat areas believed the city would respond, vs. 53% elsewhere. Caveats: Baltimore, a non-representative sample, self-reported measures. |
| CDC (2006), Integrated Pest Management: Conducting Urban Rodent Surveys | Defines the active rat signs behind an inspection “failure,” which justifies using inspections as the main rat measure. It also notes that complaints are only used to pick survey areas, and that targeted inspections aren't comparable to random surveys. |
| Walsh (2014), Rat sightings in NYC are associated with neighborhood sociodemographics | Prior tract-level NYC analysis; a method to compare against. |
| Richardson et al. (2025), Increasing rat numbers in cities; Firth et al. (2014), mBio; NYC 2024 leptospirosis advisory | Context for why rats matter (climate, health). City-level or too few cases to correlate (human leptospirosis rose from ~3 a year to 24 in 2023 and 33 in 2024), so these are cited, not visualized. |
Questions
Primary questions (from the proposal)
- Where are rats concentrated, and do those areas line up with low-income tracts, even outside the city's proactive rat mitigation zones? If lower-income tracts have higher failure rates outside the zones too, rats line up with income. If the pattern only appears inside the zones, it reflects where the city chose to look.
- What else do the highest-rat neighborhoods have in common, and does income still explain the pattern? If housing traits still track rat failures with income held fixed, income isn't the whole story.
- Do 311 rat complaints and inspection failures tell the same story, and where they don't, what does the gap reflect? A high failure rate with few complaints per 1,000 residents would suggest a reporting gap.
How the questions evolved
- Narrowed: infrastructure damage, biodiversity, disease and climate are background only; there is no NYC data at tract scale for them.
- Sharpened by the data: the mitigation zones turned out to be much poorer and far more heavily inspected than the rest of the city, which makes the “outside zones only” comparison in question 1 the central test.
- Limits: we do not claim that a complaint gap proves under-reporting (complaints trigger inspections, so the two signals aren't independent), that rats are getting worse, or that anything downstream follows from rats.
New questions that came up while building
- Renter share and income are correlated (−0.52), so we checked whether income still predicts failures once renter share is held fixed (see Evaluation).
- The 30-inspection cutoff removed more than half of the tracts in Queens, so we looked for a way to keep thinly inspected tracts (see Data).
Data
Status: collection and wrangling complete (2026-11-09). Everything is one row per 2020 NYC census tract (2,325 tracts) over 2019-01-01 to 2023-12-31, matching the ACS 2019-2023 5-year release, so every view can be linked through the same table.
Sources
| Data | Source | Role |
|---|---|---|
| Rat inspections | NYC DOHMH Rodent Inspection (Socrata p937-wjvj), SODA API | Main rat measure: share of initial inspections that failed for rat activity |
| 311 complaints | NYC 311 (76ig-c548 for 2019, erm2-nwe9 for 2020-23) | “Rat Sighting” and “Signs of Rodents” per 1,000 residents |
| Housing violations | NYC HPD Housing Maintenance Code Violations (wvxf-dwi5) | Housing-condition variable, excluding rodent violations |
| Income, population, housing | U.S. Census ACS 2019-2023 5-year, tract level (B19013, B01003, B25003, B25034), Census API | Income (with margin of error), denominators, renter share, share built before 1940 |
| Tracts | NYC DCP Census Tracts for 2020, clipped to shoreline (ArcGIS FeatureServer) | Base map and the polygons all points are joined to |
| Mitigation zones | DOHMH Rat Mitigation Zones (nychealth/EHDP-data) | Flags tracts the city inspects proactively (4 zones) |
Method
Three scripts, run in order with uv, so the whole dataset can be rebuilt from scratch:
scripts/01_fetch.pydownloads everything todata/raw/(gitignored cache): resumable, paged SODA requests filtered to 2019-2023, recording the server's row count for each dataset.scripts/02_build.pyassigns every point to a tract by point-in-polygon, computes the per-tract variables, and writes the only two files the front end loads:tracts.csvandtracts.topo.json.scripts/03_check.pyasserts the output is sane (unique 11-digit IDs, rates within 0-1, failures never exceed inspections, all four zones populated, CSV and TopoJSON tract sets identical).
Cleanup decisions and why
| Issue | What we did | Why |
|---|---|---|
| Re-inspections | Count only Initial inspections | Compliance re-inspections revisit lots that already failed (since 2024 they fail 56% of the time vs. 19% for initial ones) and would inflate rates where rats already were. |
| Rat failure definition | “Failed for Rat Activity” and “Failed for Rat Activity and Other Reason” are failures; “Failed for Other Reason” stays in the denominator as a non-rat result | Matches the CDC's definition of active rat signs. |
| Tract assignment | Point-in-polygon on lat/long; ignore the dataset's built-in census_tract column | That column has no county code and an unstated vintage. |
| Missing coordinates | Dropped (inspections: 14,579 of 624,596 bad or missing, plus 51 outside every tract; 311: 1,457 + 18; HPD: 537 + 10) | Cannot be placed on a tract. Kept: 97.7% of inspections, 98.9% of 311, 100.0% of HPD. |
| Circularity | Removed 131,750 rodent-related HPD violations (descriptions mentioning rats, mice, mouse, rodent) before counting housing violations | Otherwise “housing violations vs. rat failures” partly measures rats against rats. |
| 311 stitching | Combined the 2019 and 2020+ datasets; asserted no shared keys; checked monthly counts across the seam | The two datasets have different IDs. Dec 2019 had 939 complaints and Jan 2020 had 1,246, within the 0.5-2× tolerance we assert, so the seam is not a break. |
| Census sentinels, topcode | Negative values (e.g. -666666666) become missing; income capped at $250,001 (13 tracts) | Suppressed and topcoded values would otherwise read as real numbers. |
| Small denominators | reliable flag: at least 30 initial inspections and at least 500 residents. Unreliable tracts keep their values but are greyed out and excluded from correlations and tertiles | A rate from 5 inspections is noise. |
| Zero denominators | Rates are empty, not 0 | 0 is a real rate; “no data” must not look like “no rats.” |
| Zone flag | Tract is in-zone if its center point falls inside a zone, for the whole window | The zone file has no dates. Harlem started in 2023, so it is over-flagged for 2019-22; the visualization will say so. |
The final table has 2,325 tracts, of which 1,516 (65%) are reliable and 210 fall in a mitigation zone. Citywide it covers 609,966 initial inspections (20.3% failed for rats), 127,620 rat-related 311 complaints and 3,147,824 non-rodent HPD violations.
Changes from the proposal: 311 is pulled for 2019-2023 only, and 2.3% of initial inspections lacked coordinates (the proposal estimated 1.4%).
Changes made while building
| Change | Why |
|---|---|
| Replaced the 30-inspection cutoff with a small-count adjustment: each rate adds 30 inspections at the city average (20.3%). Tracts under 30 inspections are drawn as open squares. | The cutoff removed more than half of Queens' tracts. The adjustment keeps them while preventing a tract with only a few inspections from getting an extreme rate. |
Added Census county boundaries (cb_2023_us_county_500k) for the surrounding region. | Used to draw water and the neighboring counties on the map. |
Exploratory Data Analysis
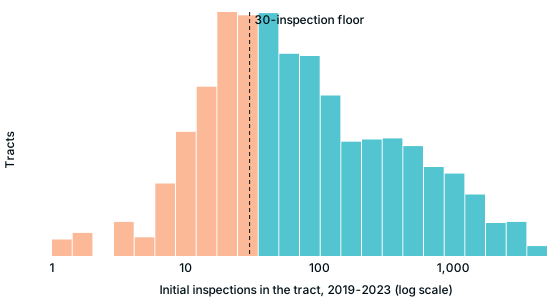
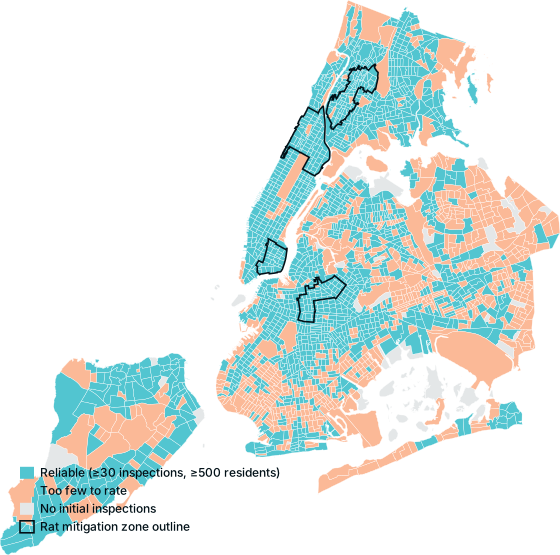
- A third of tracts can't support a rate (809 of 2,325 have under 30 inspections or 500 residents; the median tract has 55 inspections). The map needs a distinct “too few to rate” state, and these tracts are excluded from tertile cut points and correlations.
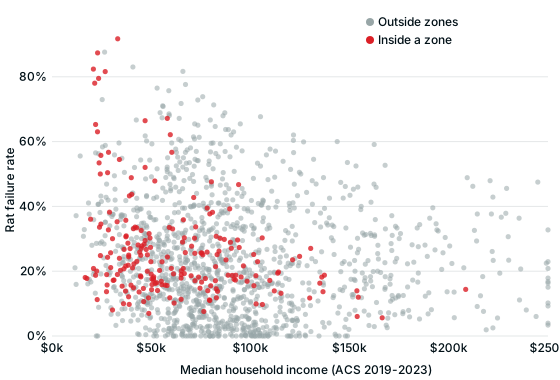
- The zones are a different part of the city. Median income is $53,191 inside zones vs. $83,984 outside, and inspections per 1,000 residents are 228 vs. 15. A pooled income-vs-rats relationship mixes “poor” with “heavily inspected,” which is why we added the “outside zones only” toggle and draw zones as outlines.
- Income explains little on its own. Fig. 3 shows the full range of failure rates at every income level. Counts and rates are heavily right-skewed, so color and axes need quantile or log scales.
Design Evolution
We used the Five Design Sheet method: three alternatives, an extra sketch, and a final design. Click an image to enlarge.
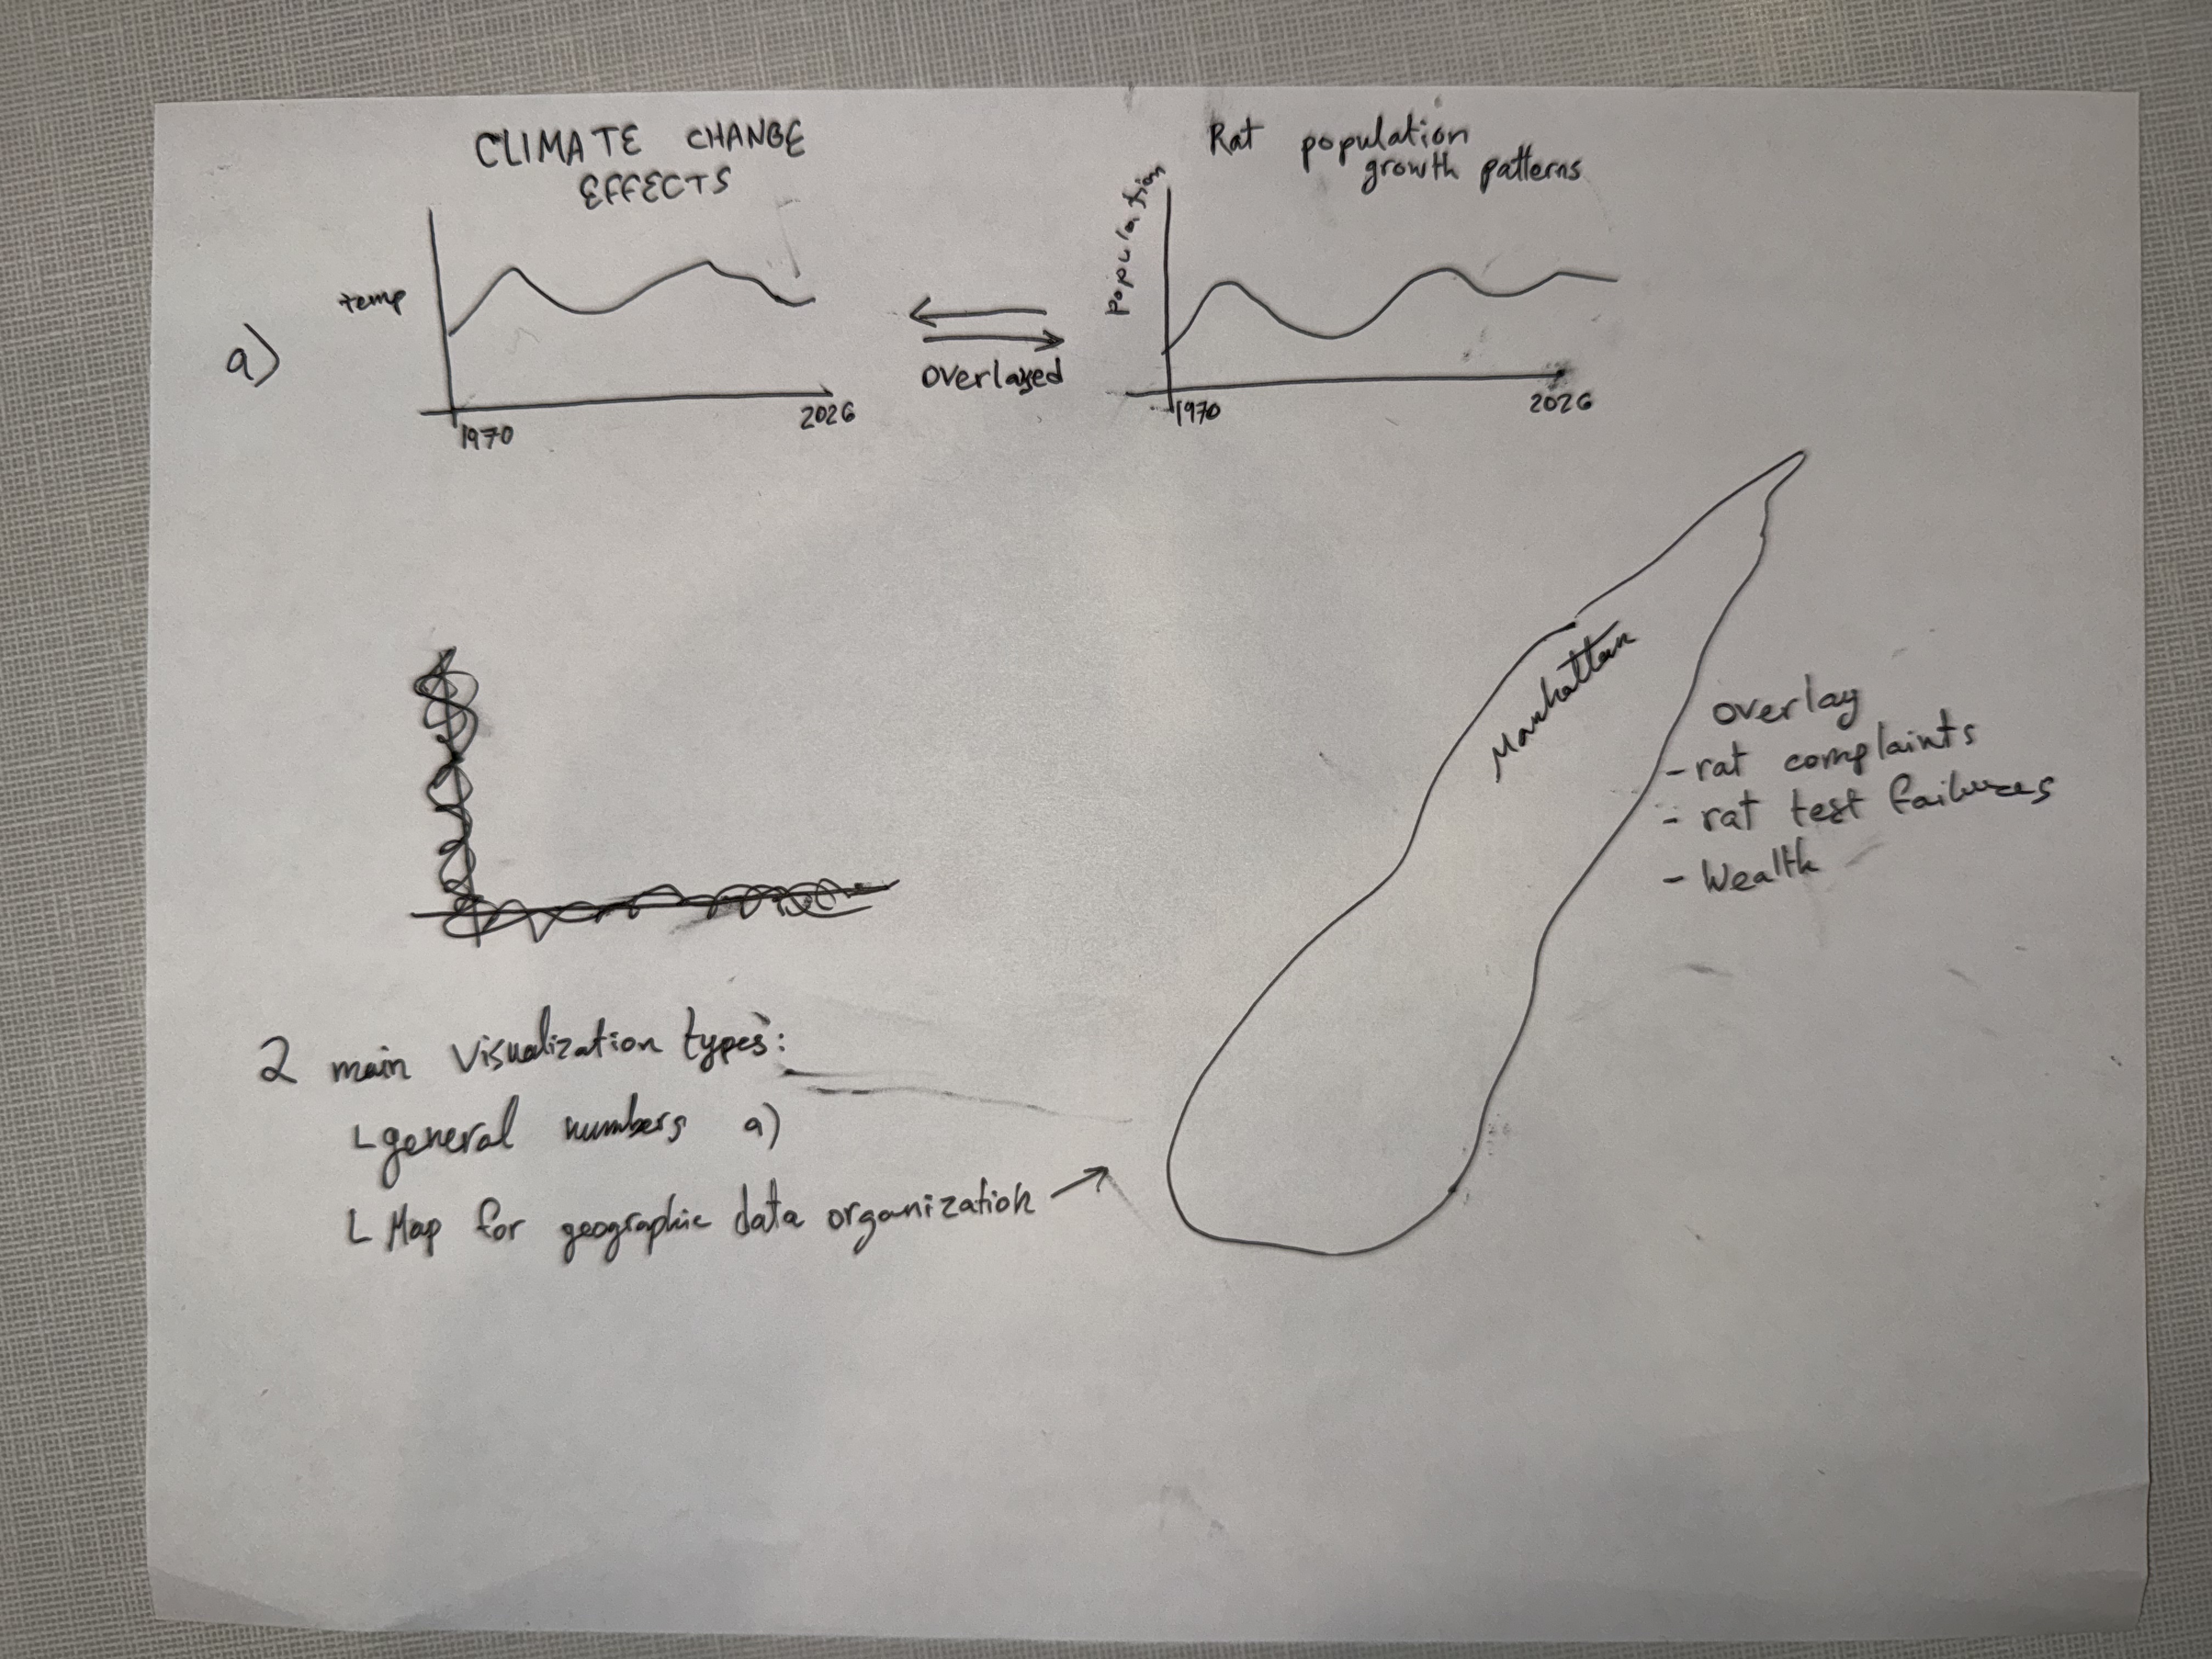
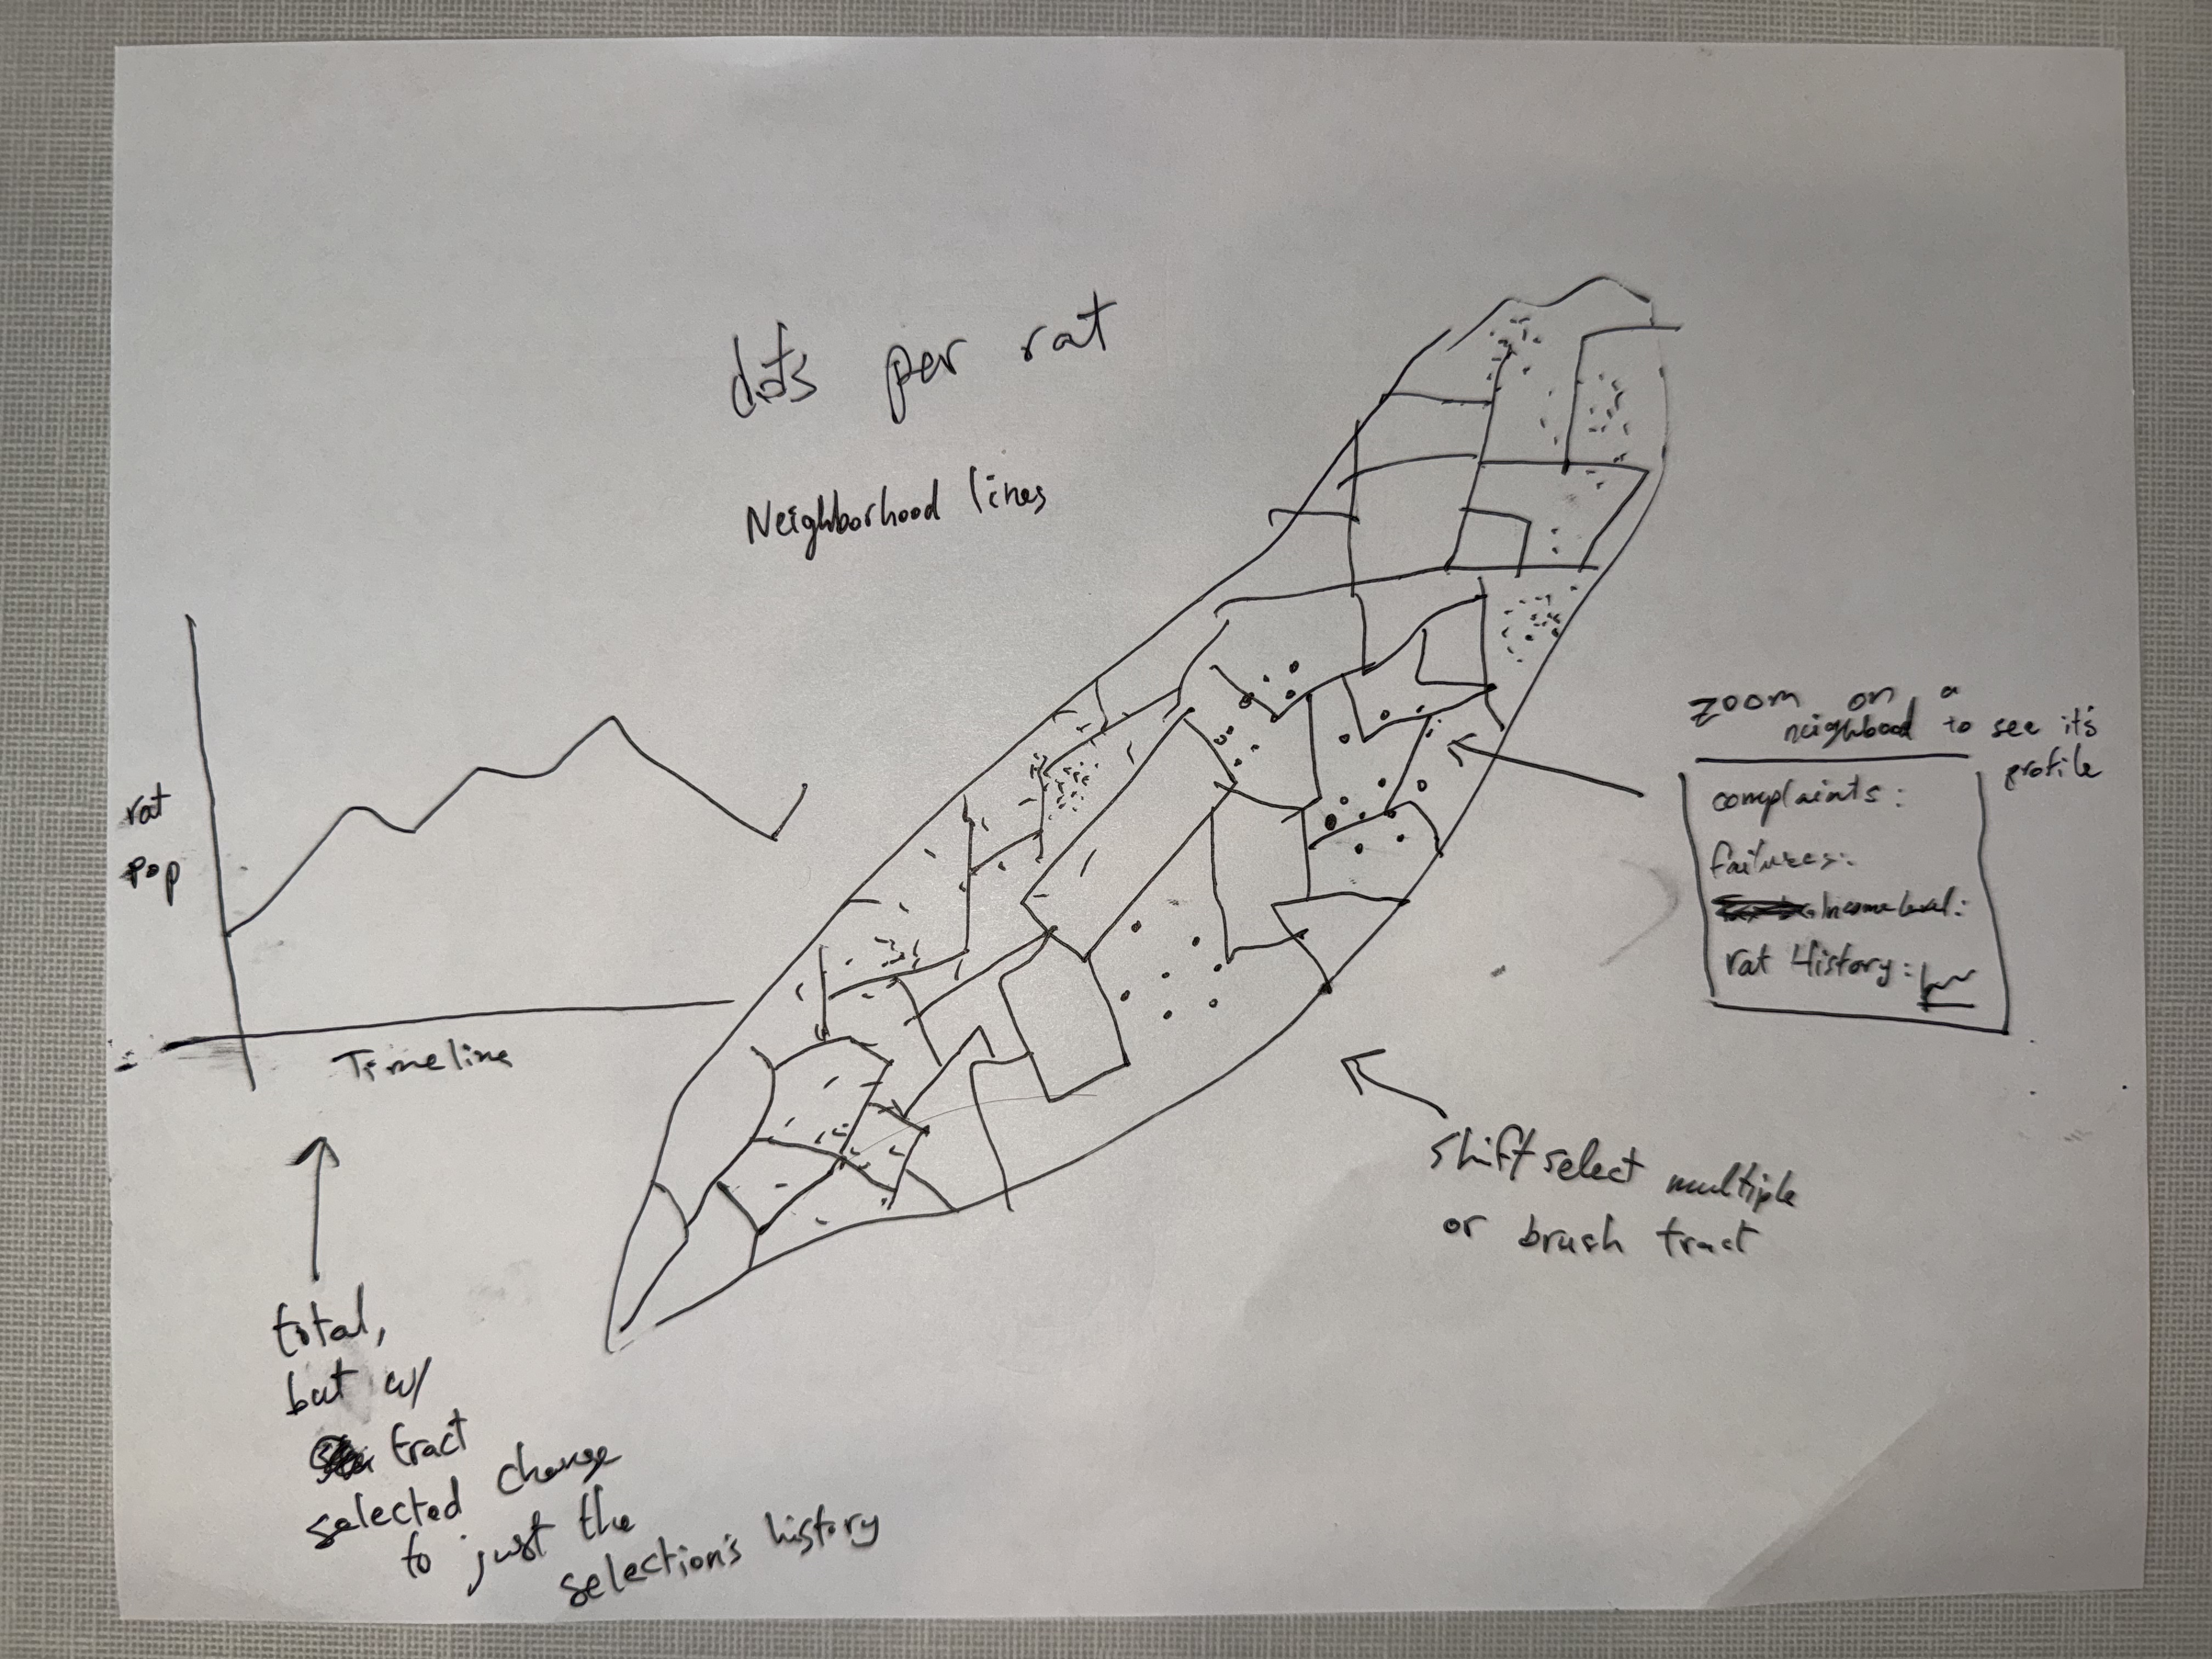
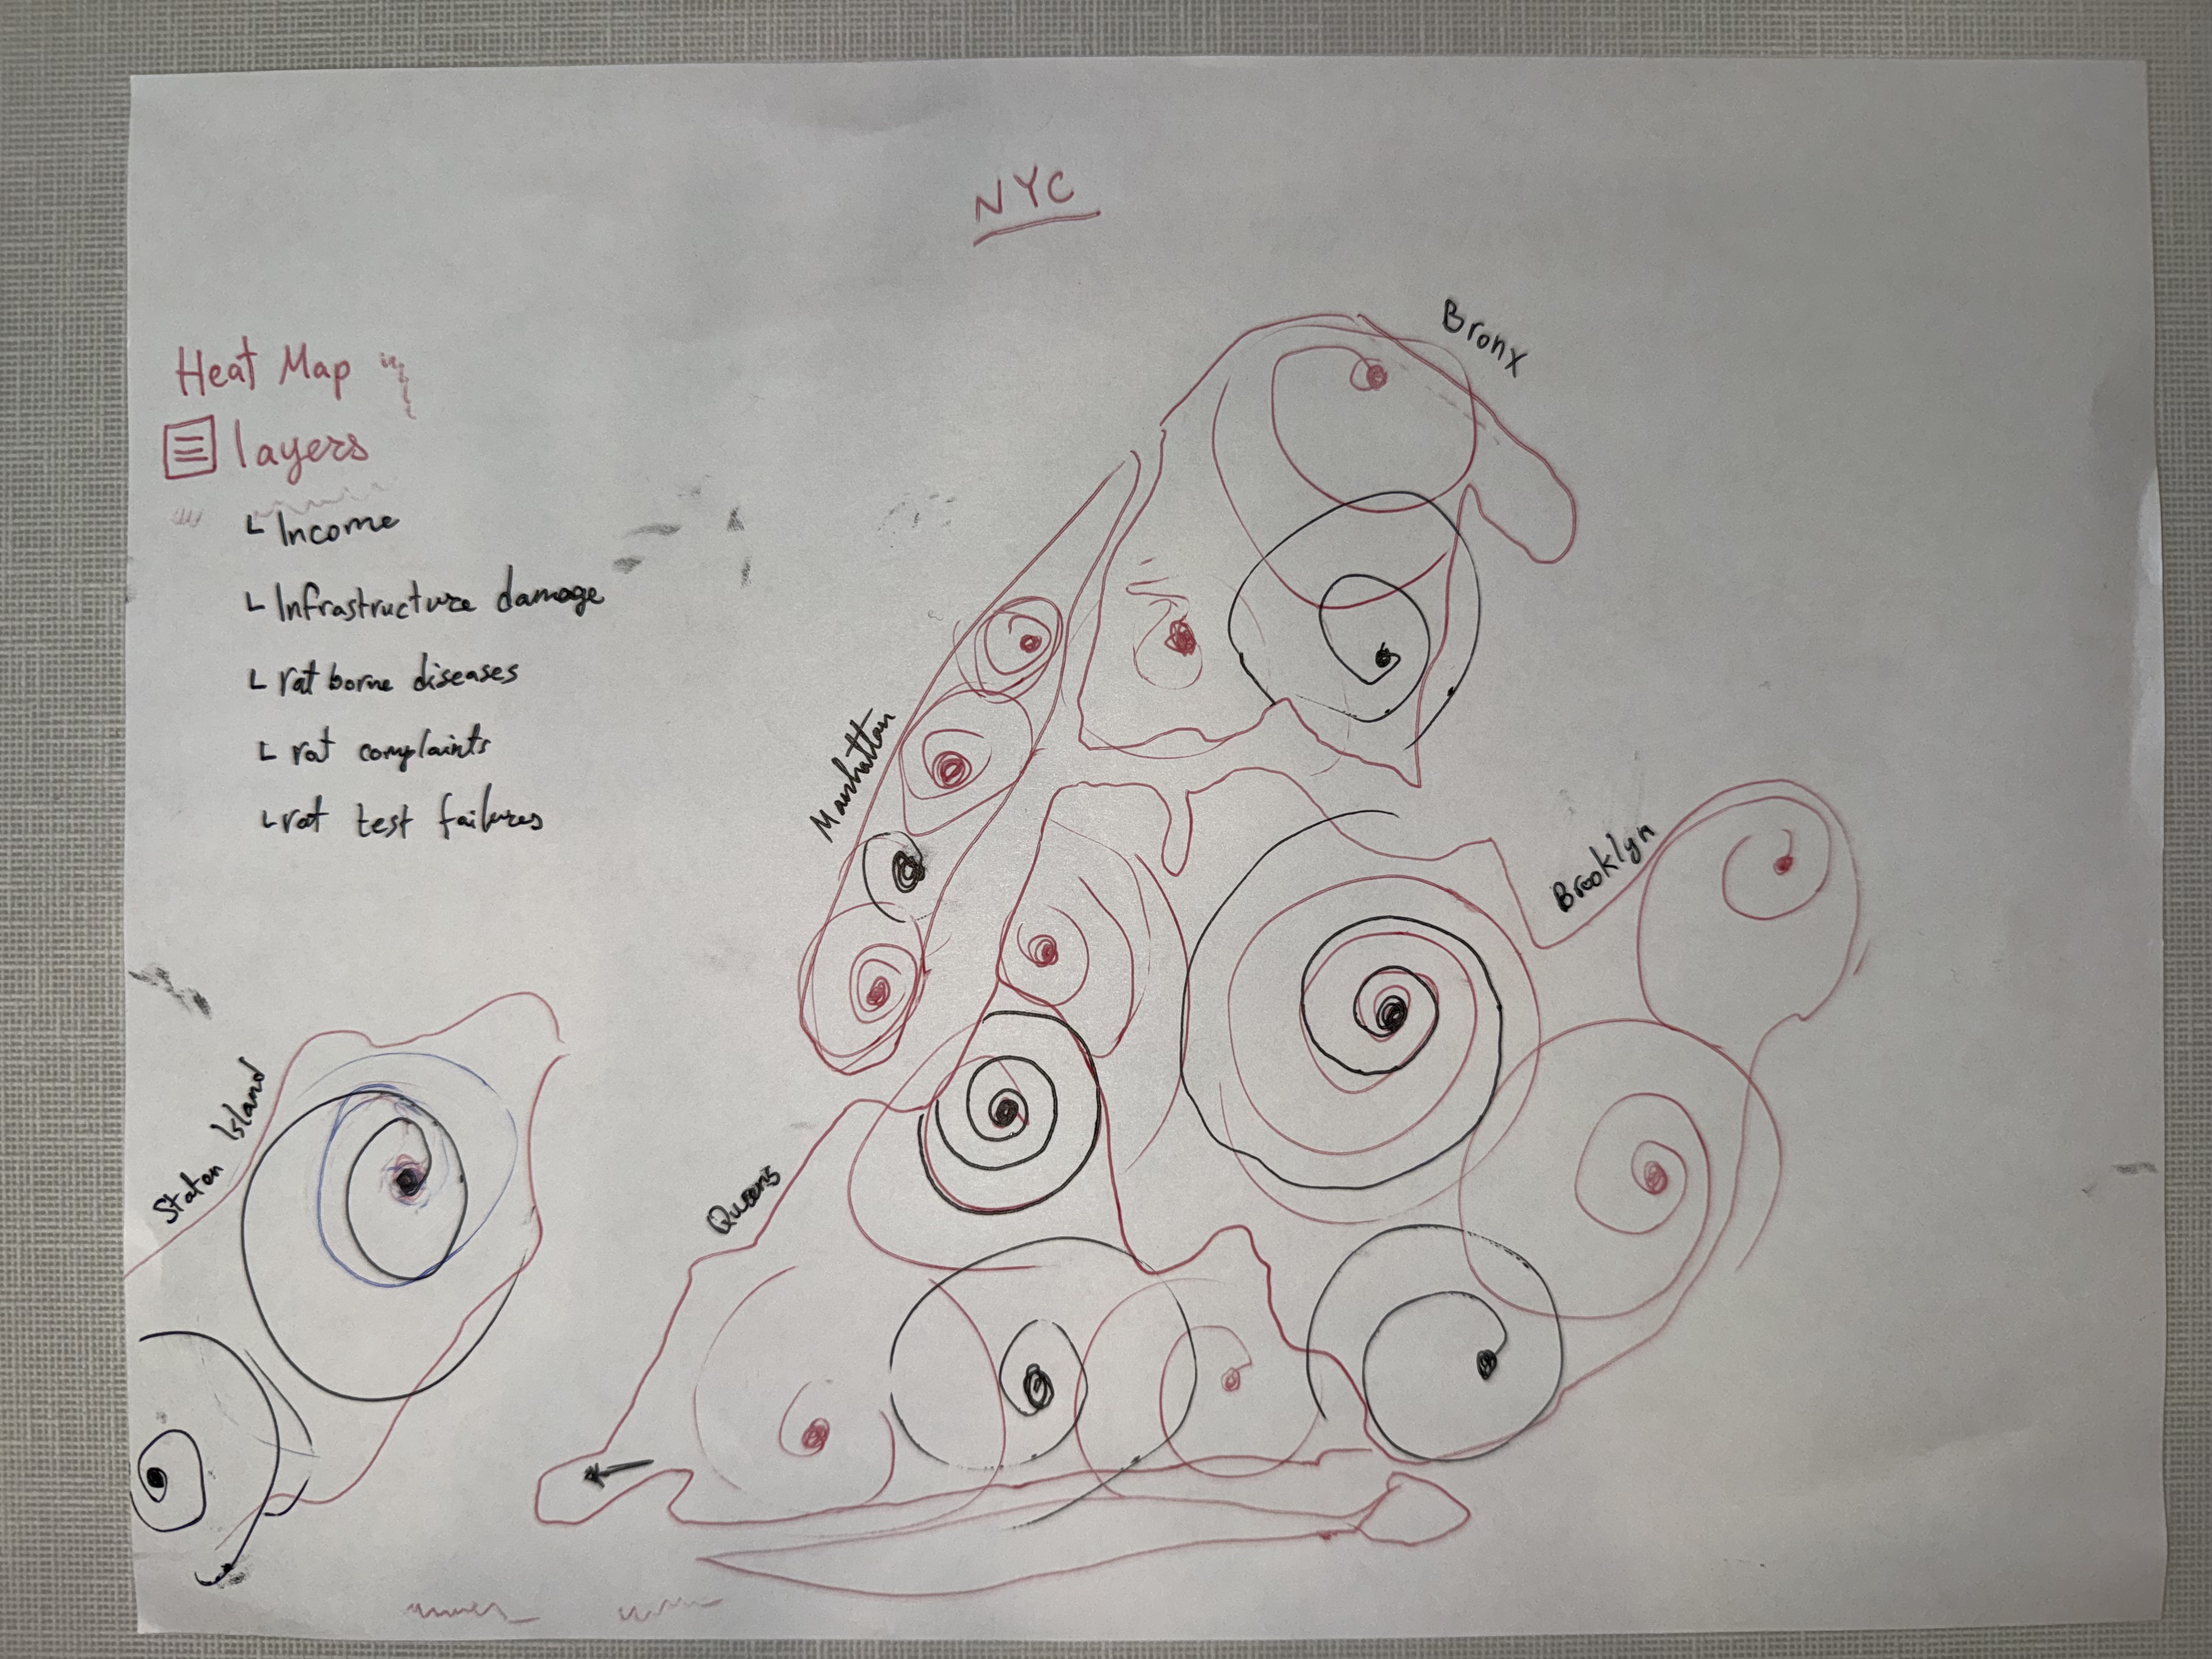
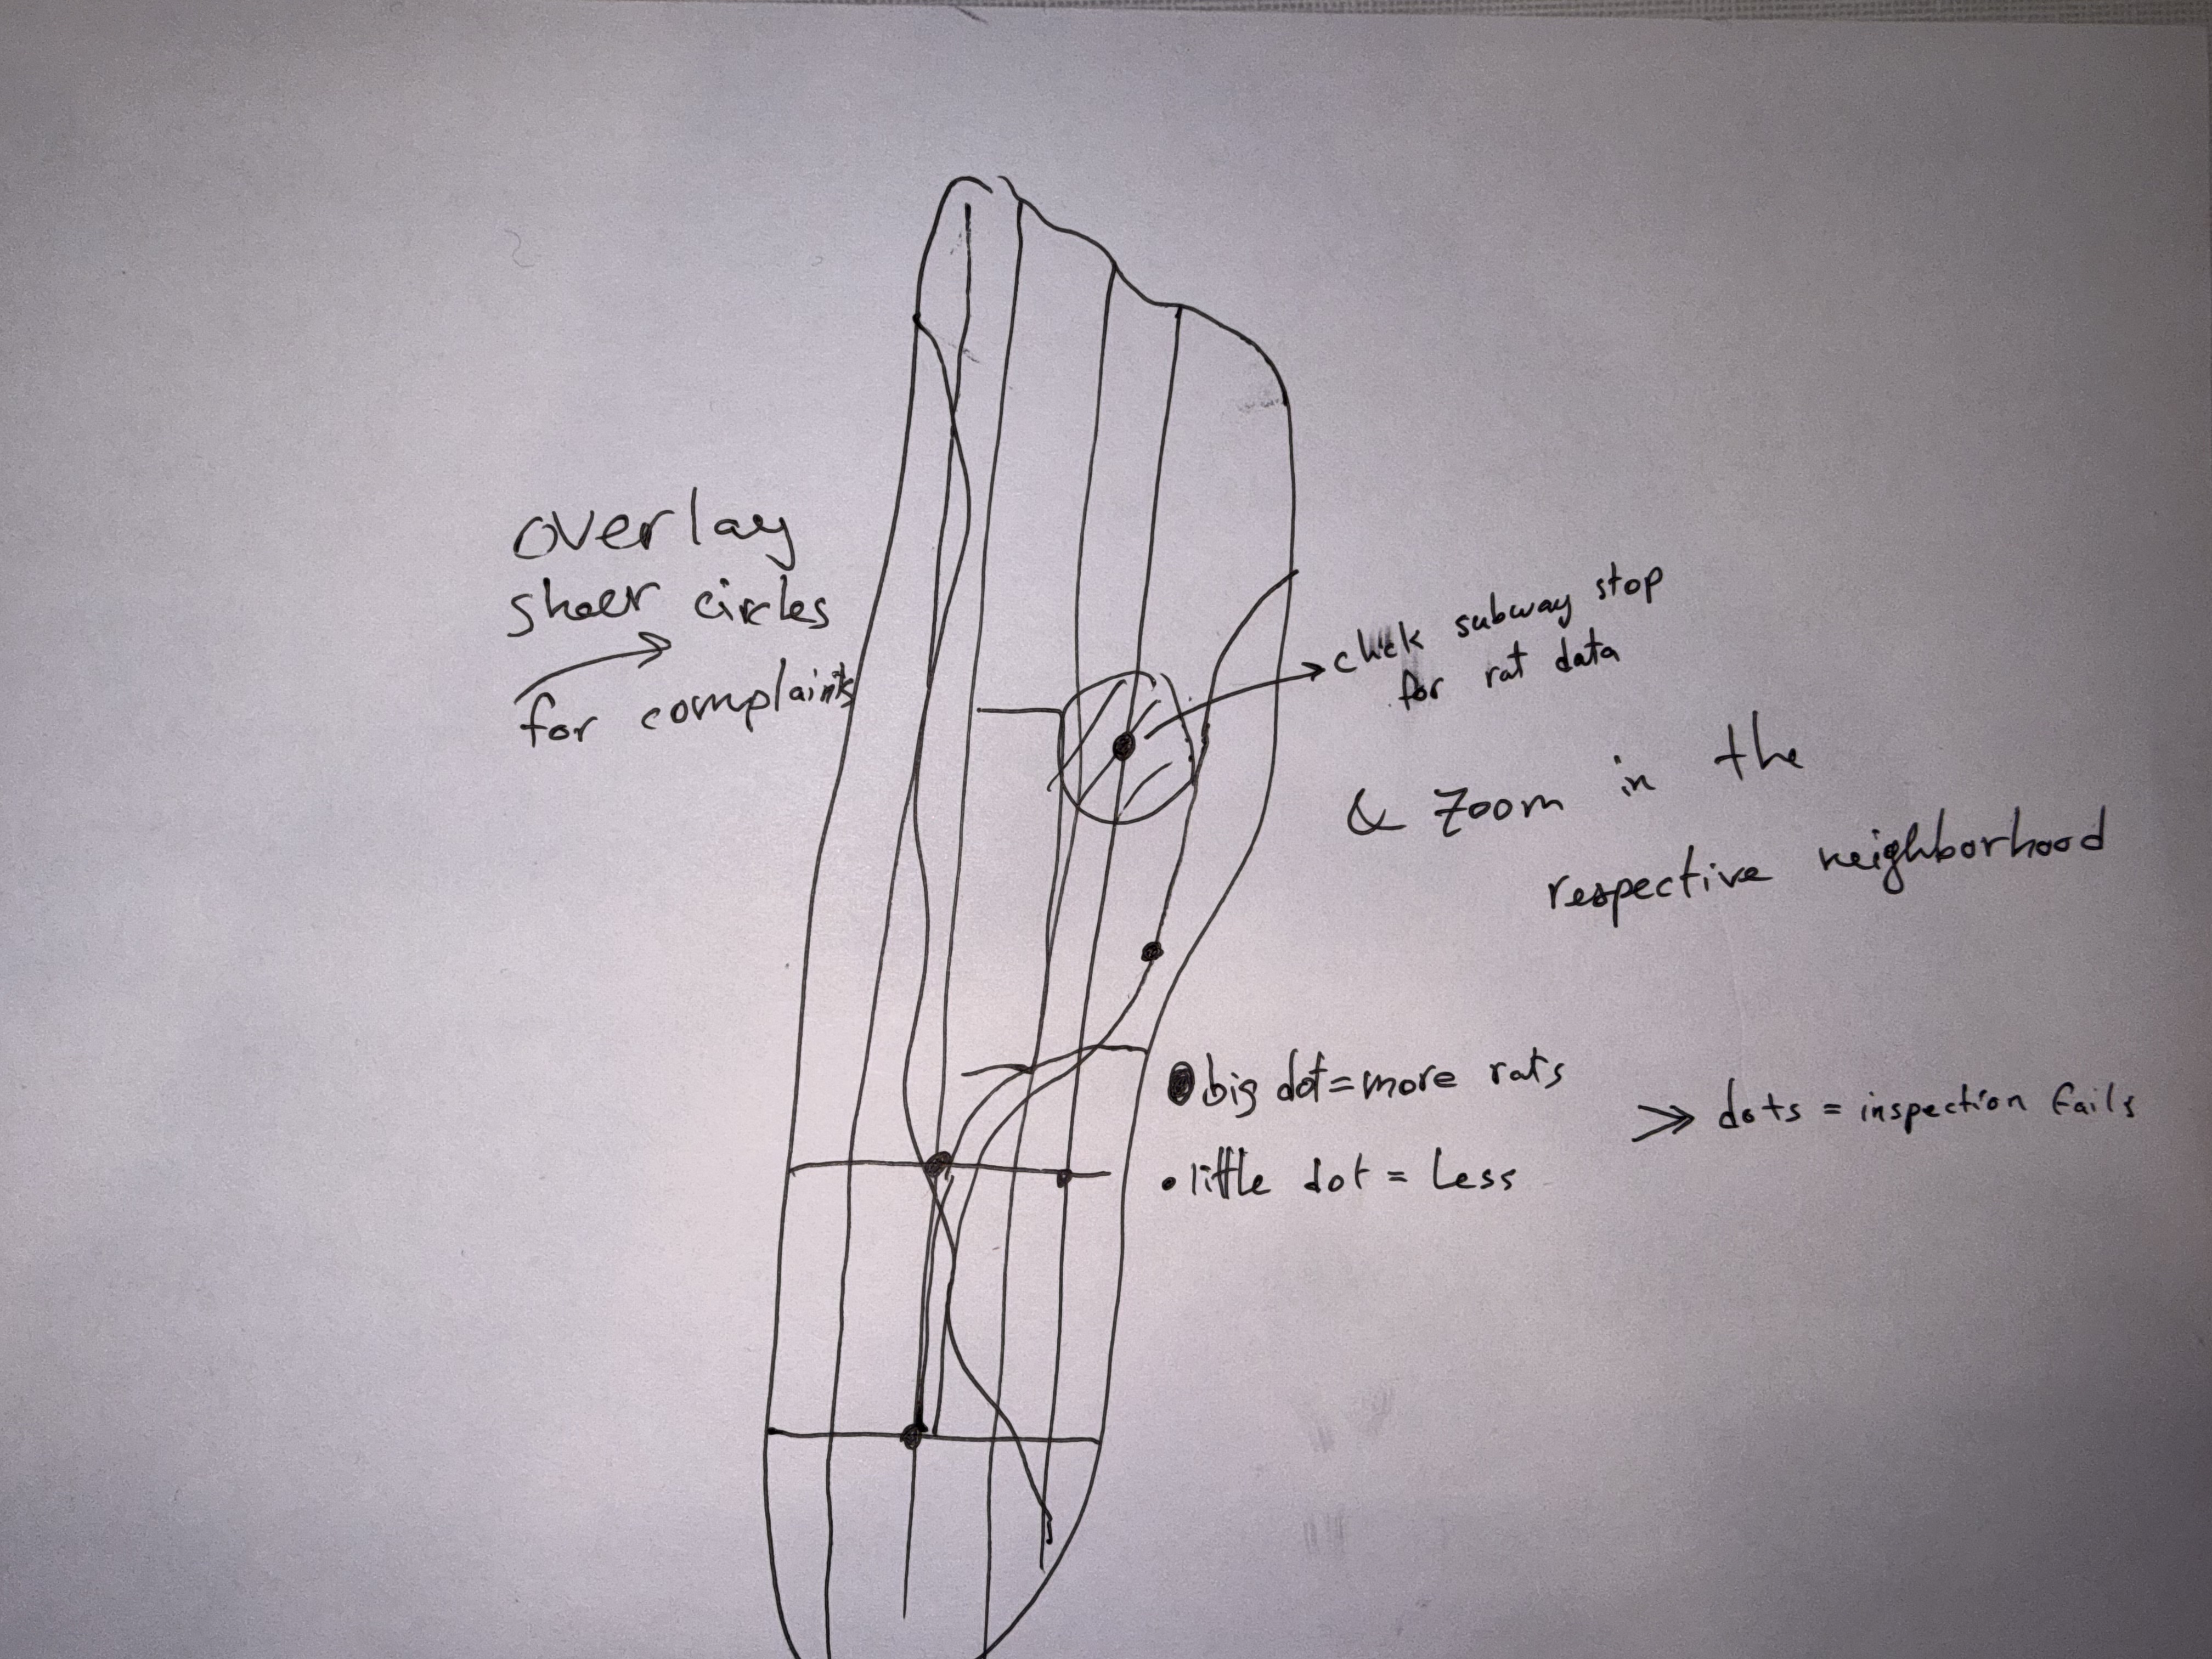
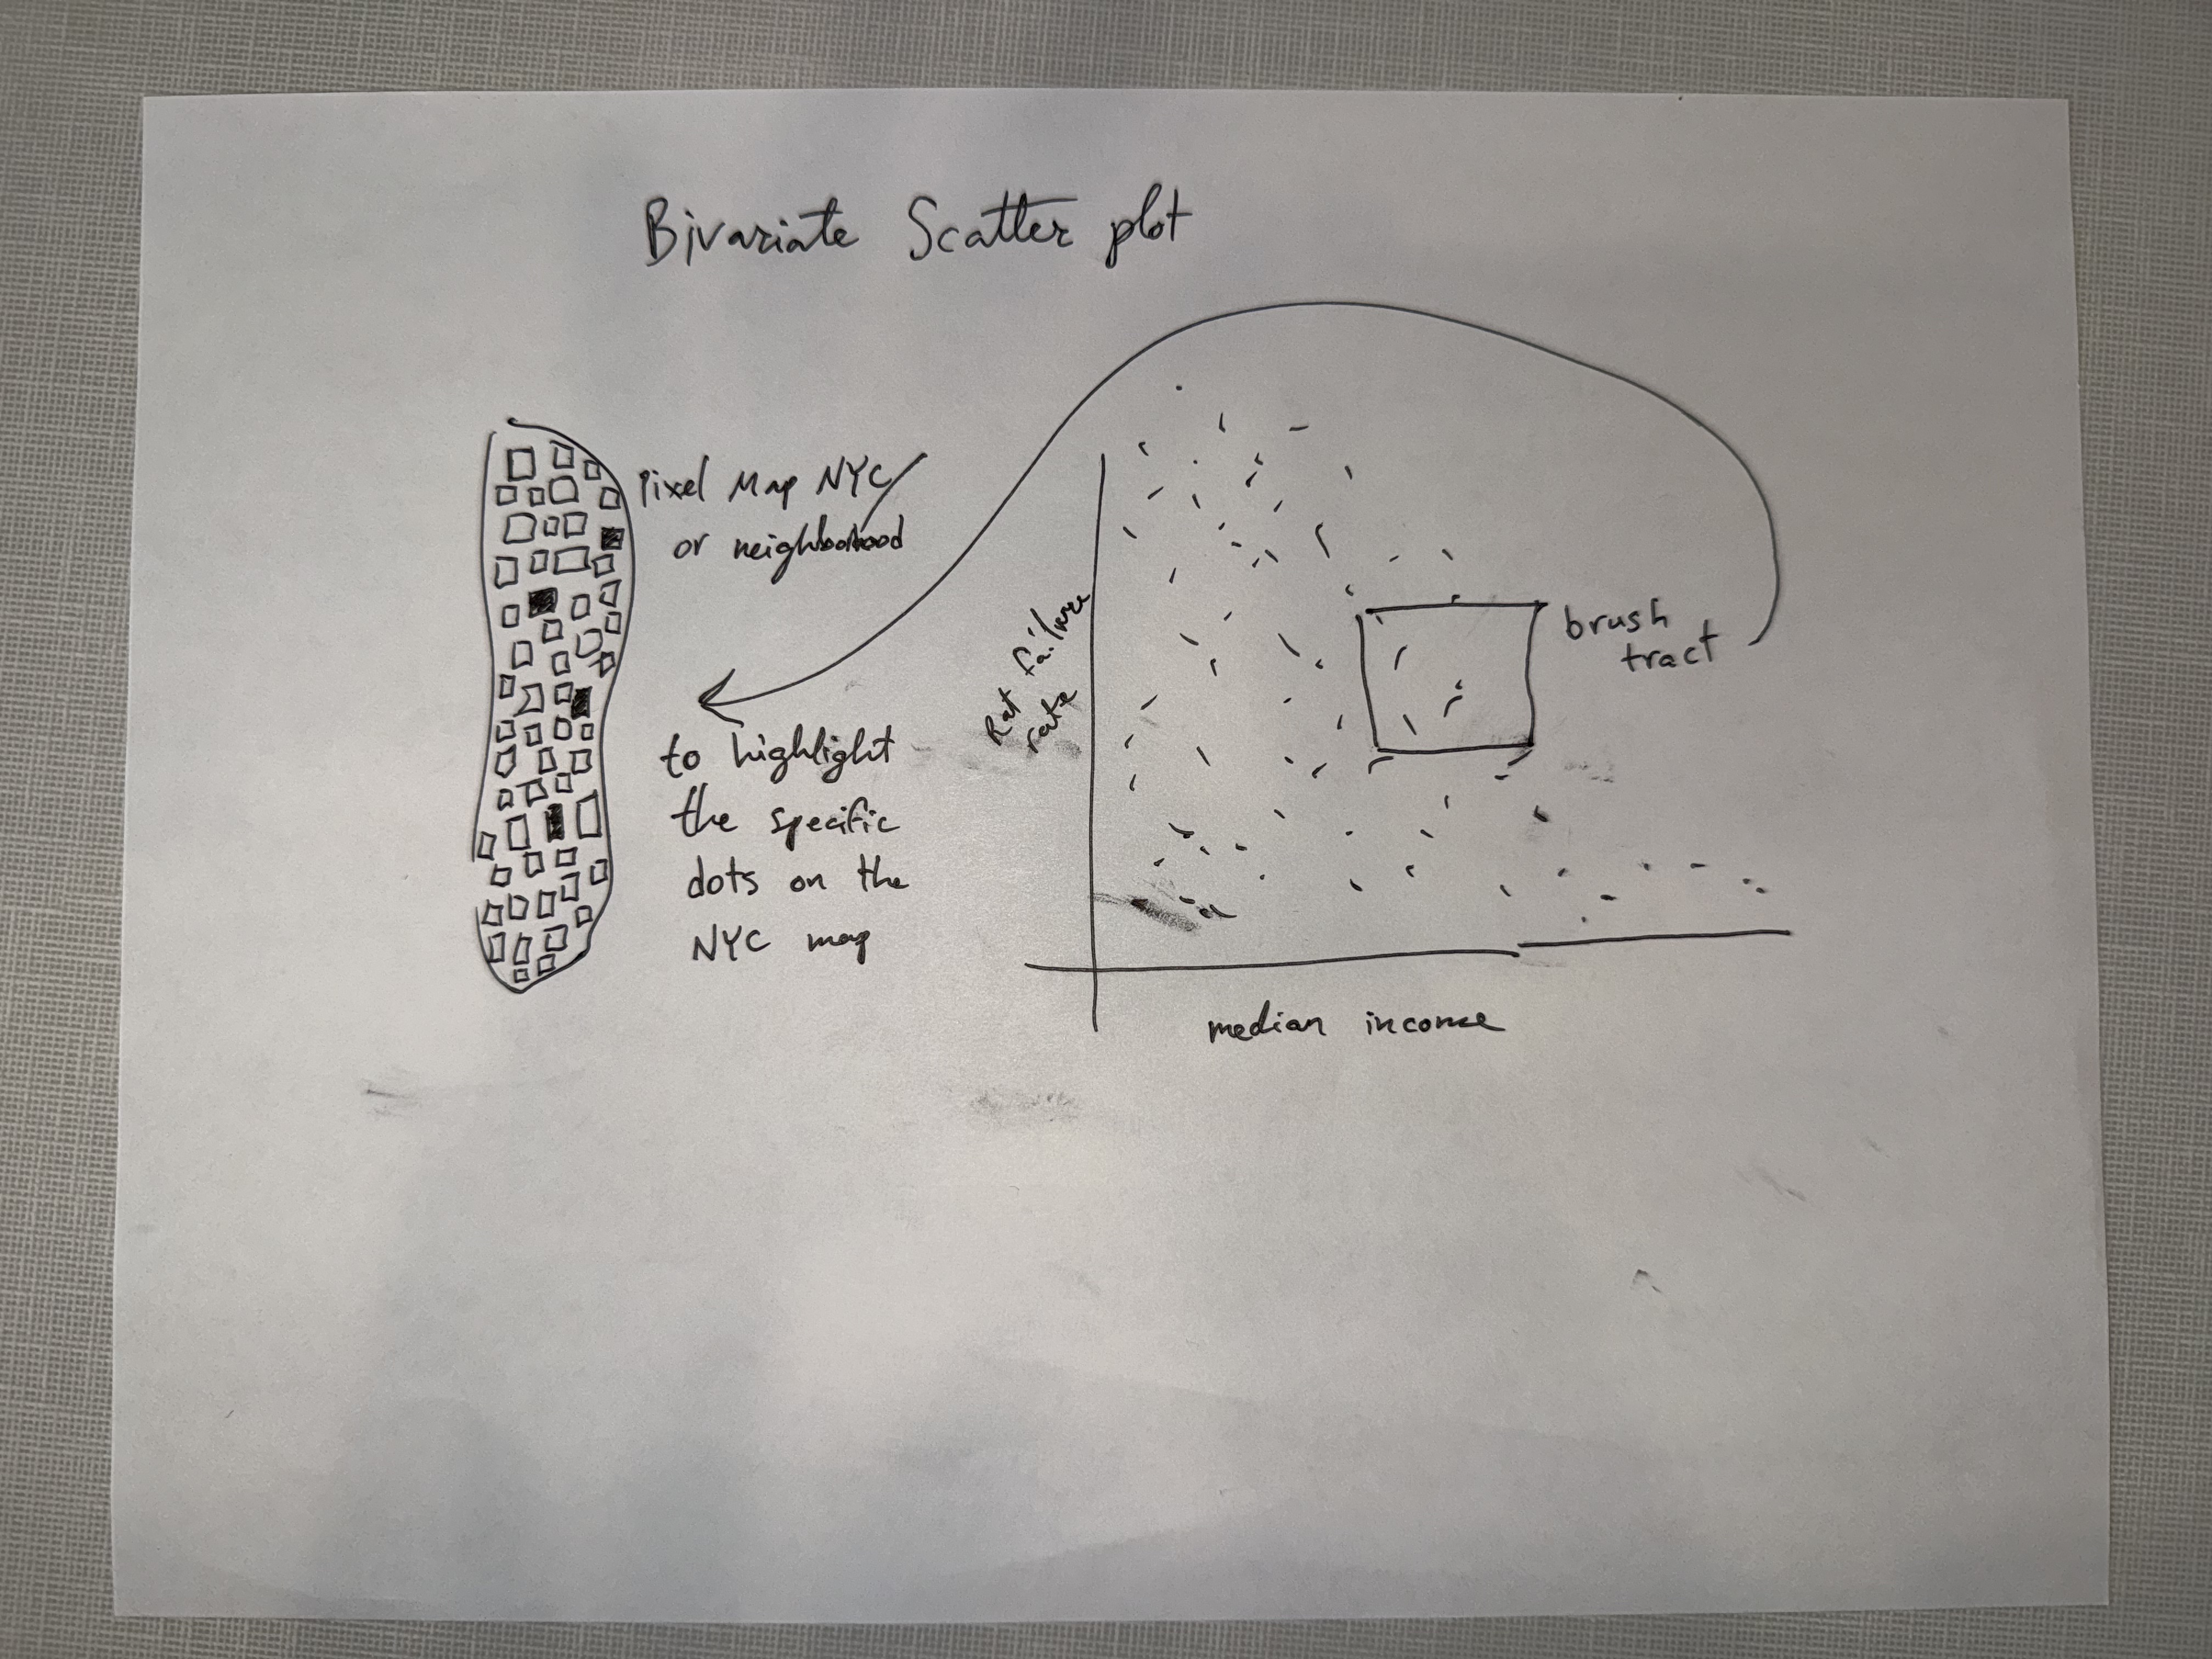
- Rates, not dots or heat. Our questions are about who is affected, which needs failure rate compared against income. Dot and heat maps would mostly redraw where inspections happen.
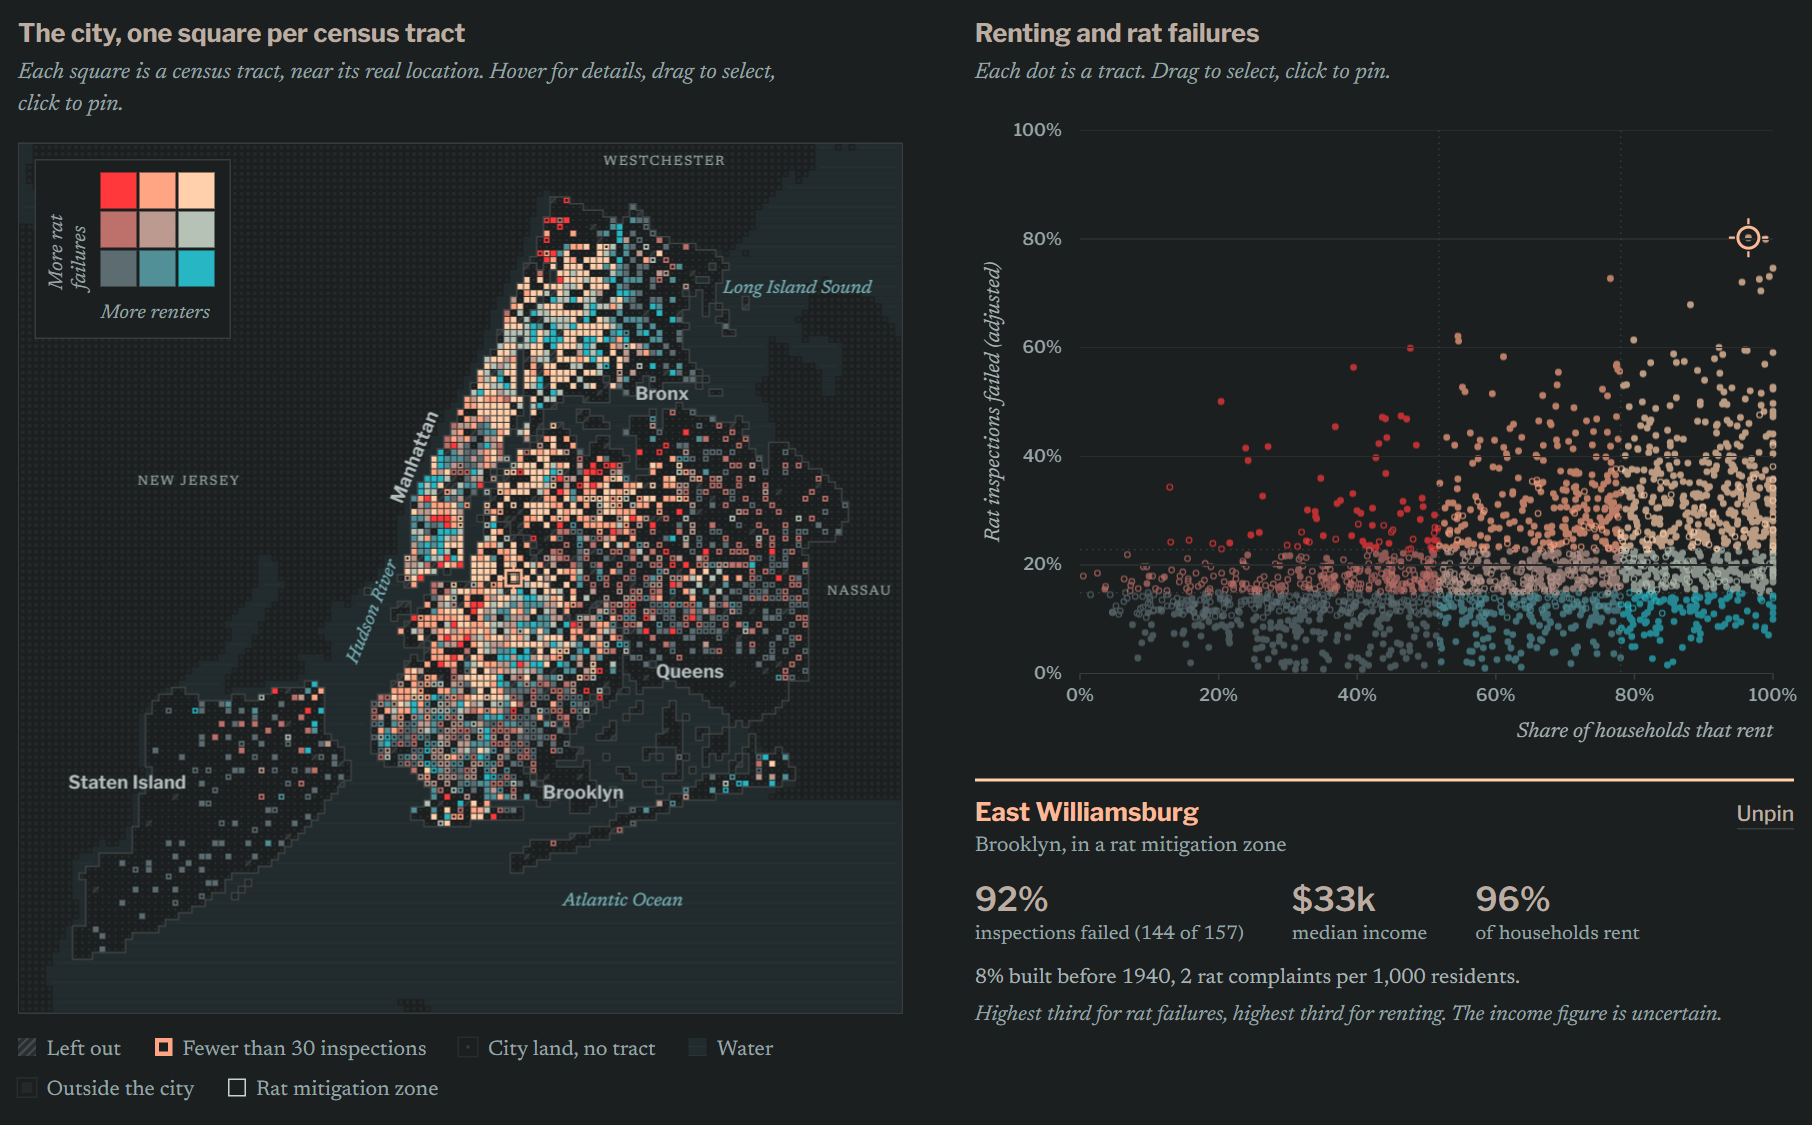
- Position for the comparison, color for the geography. A scatterplot uses position on a common scale, the most accurate encoding for comparing two quantities. The map shows where, using a 3×3 bivariate palette (income tertile × failure-rate tertile) and brushing and linking to the scatter.
- Zones as outlines so they don't compete with the fill color, with an “outside zones only” toggle (from the exploratory finding above). A second view, a correlation matrix with a “control for income” toggle, covers question 2.
Changes after the final sketch
The first build used the neon palette literally, with bright, glowing pixels on a near-black background. It looked more like a software dashboard than a map of the city, so we switched to flat colors on a dark gray background and newspaper typefaces (Libre Franklin for headings, Newsreader for text). Unselected tracts are drawn in darker, desaturated versions of their colors, so selection depends on lightness contrast rather than glow.
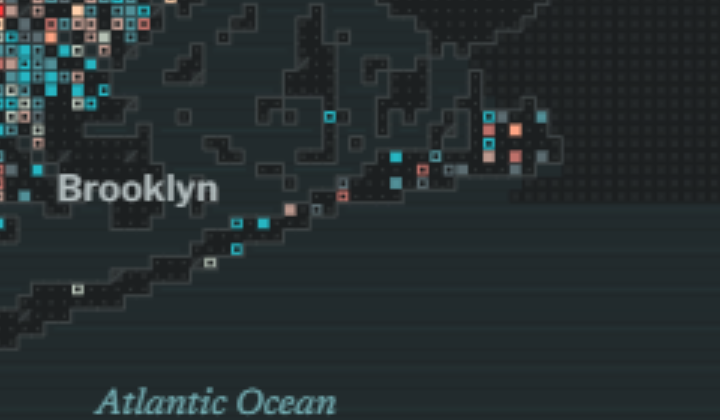
Each tract is placed on its own square of a 400 m grid, as close to the tract's real location as possible; the median shift is 289 m. In the first version some squares landed on water, which made Manhattan look wider than it is, so squares are now restricted to land. Water, neighboring counties and borough outlines are drawn underneath (Fig. 4).
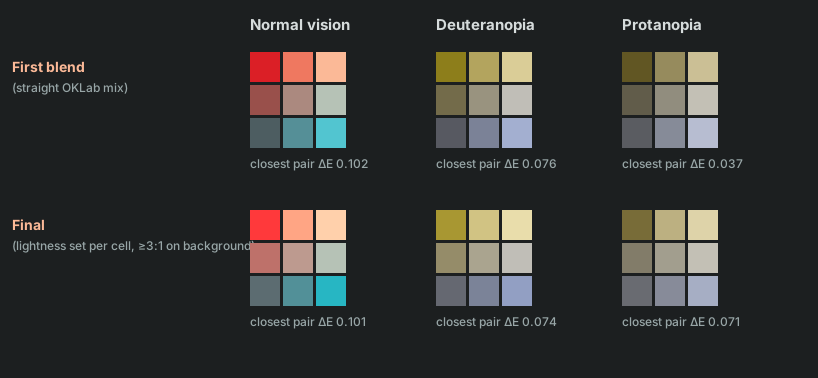
The 3×3 color scale is a blend of the palette colors. A straight blend made the low-income column hard to tell apart under protanopia, so we set the lightness of each cell separately. This also made the darkest cell clearly lighter than the gray used for missing data (Fig. 5).
Deviations from the proposal
- The correlation-matrix view with an income control isn't built; we report those numbers in Evaluation.
- Mitigation zones are an outline toggle rather than an “outside zones only” filter.
Implementation
The visualization is a single page, index.html, built with D3 v7. The map shows where tracts are, and the chart compares two measures for the same tracts.
| Element | Function |
|---|---|
| Map | One square per tract, colored by the thirds of the two selected measures. Hatched squares have no data; open squares had fewer than 30 inspections. |
| Chart | One dot per tract, plotting the same two measures. |
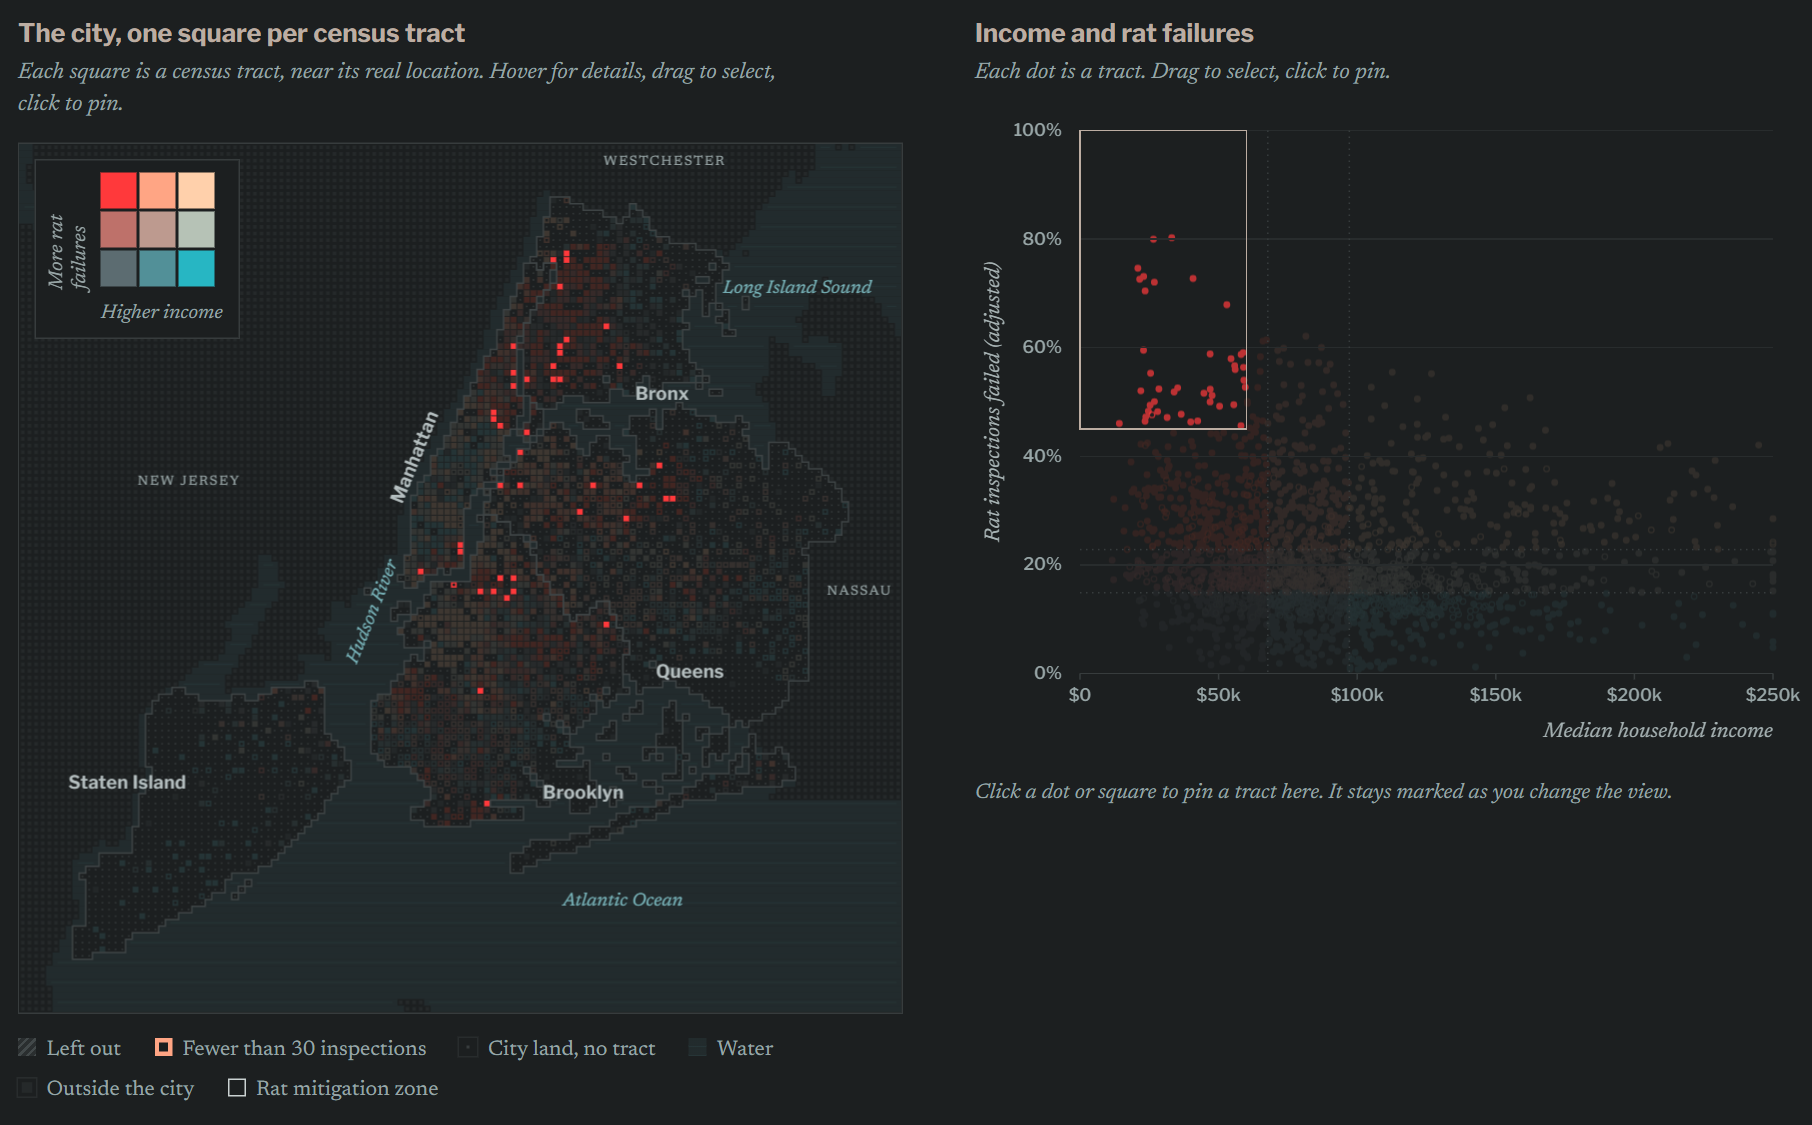
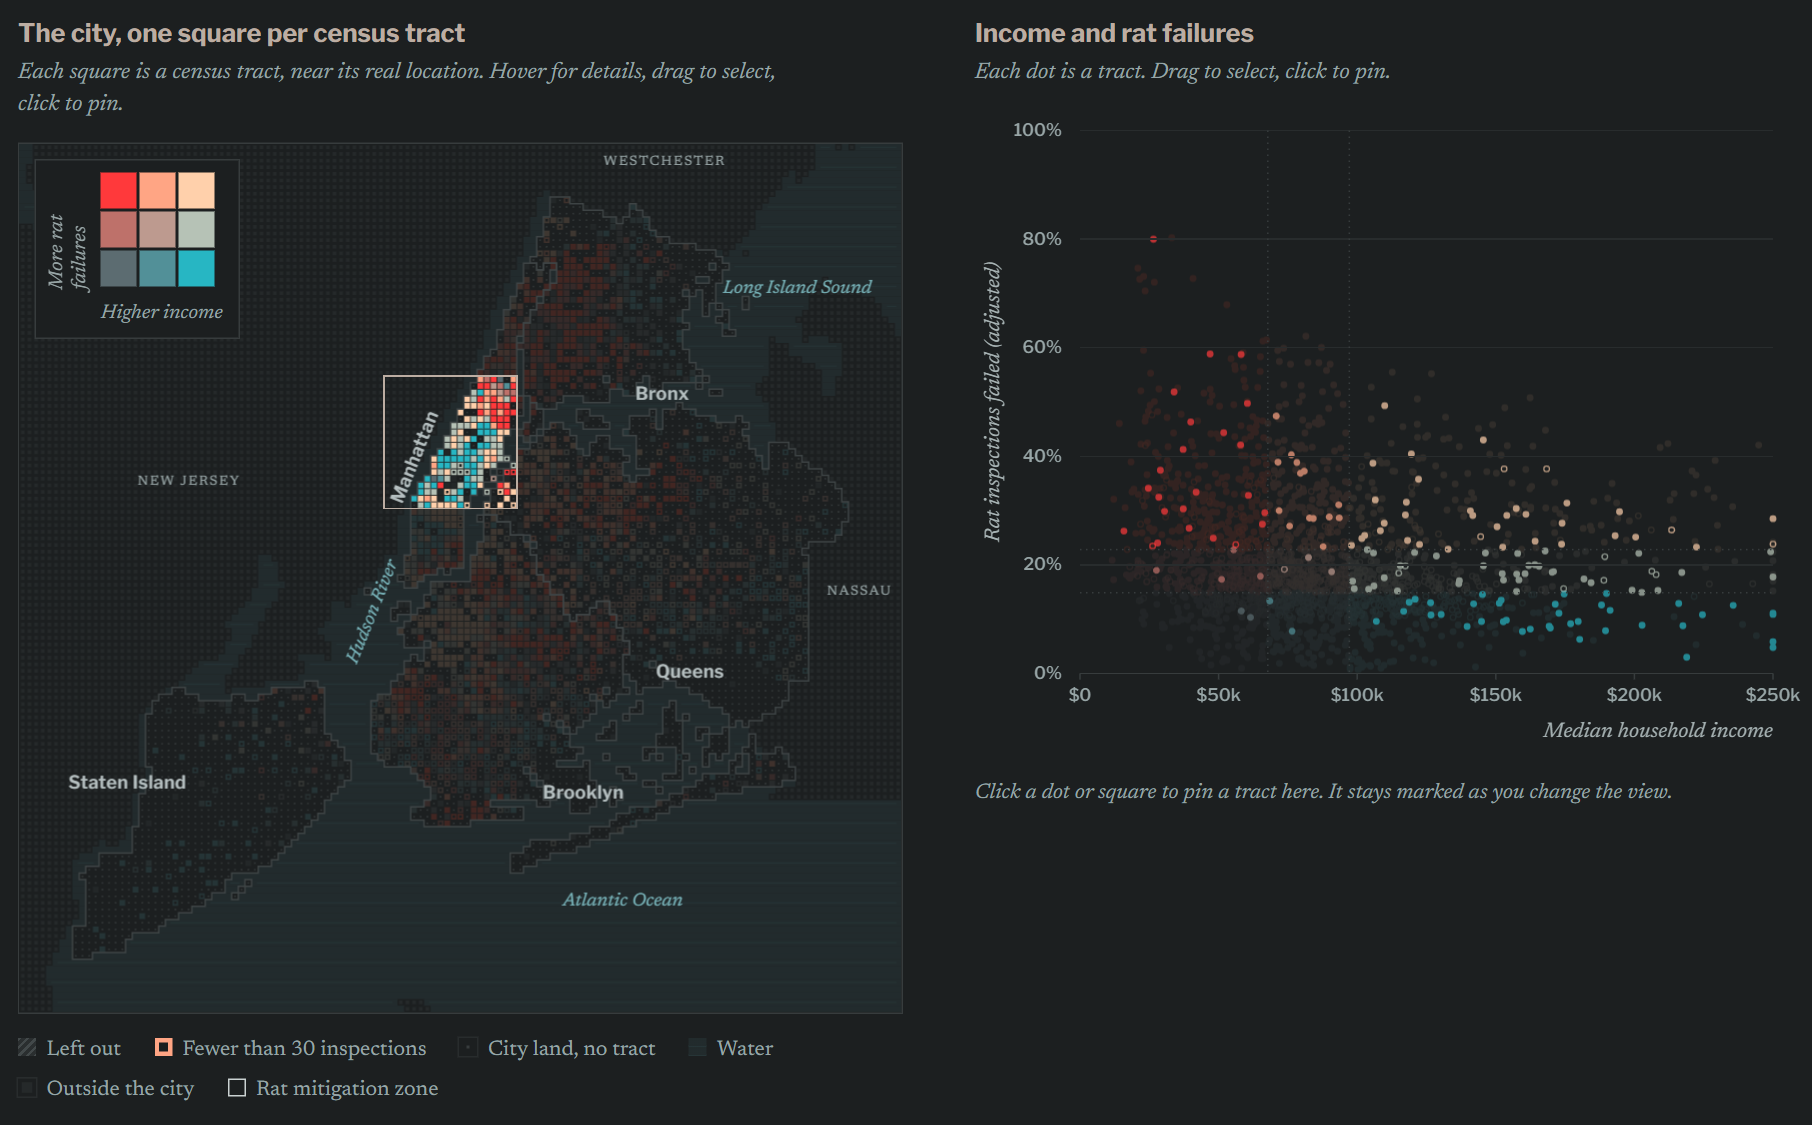
| Selection | Dragging a box on either view highlights the same tracts in both (Figs. 6, 7). |
| Pinning | Clicking a tract keeps it marked when the borough filter or measures change (Fig. 8). |
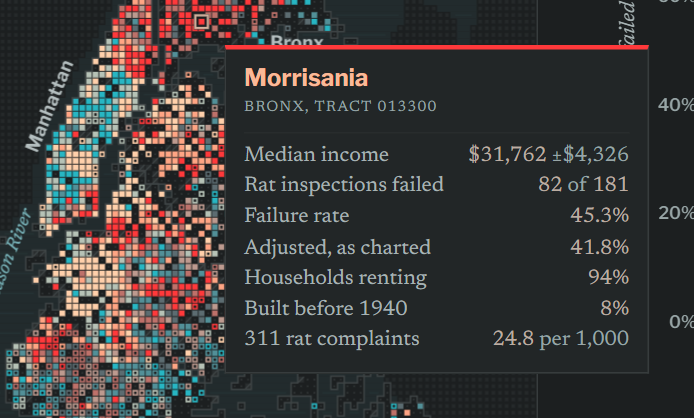
| Tooltip | Shows inspection counts, the adjusted failure rate and the income margin of error (Fig. 9). |
| Controls | Borough filter, zone outlines, horizontal measure (income, renter share, pre-1940 buildings, housing violations) and vertical measure (inspection failure rate, 311 complaints). |
Evaluation
Question 1. Lower-income tracts have somewhat higher failure rates (rank correlation −0.18), and the relationship holds outside the zones (−0.14). It is stronger in Manhattan (−0.46) and the Bronx (−0.43) and absent in Brooklyn (+0.01).
Question 2. Renter share is the strongest correlate. The median tract fails 14% of inspections in the third of tracts with the fewest renters and 24% in the third with the most. With renter share held fixed, the income correlation is +0.09; with income held fixed, the renter share correlation is 0.44.
Question 3. Complaint rates and failure rates are moderately correlated (0.35). The 103 tracts with high failure rates but few complaints have a median income of $65,800, compared with $81,800 for all charted tracts. This is consistent with under-reporting, but complaints also determine where inspections happen, so it is not proof.
Limitations and next steps. Squares are shifted from their true locations, the adjustment pulls thinly inspected tracts toward 20%, and the data covers 2019–2023 as a single period. Next are the user study on 11/24 and a view for the income-controlled comparison.