CSE457: ALT ♪
Welcome to our process book for our final visualization project, ALT.
Created by Christie Chen, Isabel Silverman, and Eugene Song :)
- Isabel Silverman: isabelsilverman@wustl.edu, 472857
- Eugene Song: eugenesong@wustl.edu, 476801
- Christie chen: christiec@wustl.edu, 475312
Process Book
Overview and Motivation:
Our main motivation is to better illustrate the various trends in the music industry and compile relevant data into one visualization. During our research for the project, we realized that it would be useful to have more visualizations for musical data that analyze information from multiple sources; we thought that this visualization could be useful for those who are interested in music news and upcoming trends. Furthermore, aspiring musicians and audio producers interested in winning GRAMMY awards may find our visualizations useful in finding out how to cater their creations to the voting members of the GRAMMY committee – both in track features and in release date. Music also plays a huge role in social media trends, such as on TikTok. Analyzing these audio features could help in predicting which songs would go viral.
Related Work:
Our project was mainly inspired by our interest and curiosity in music! But also, we came across news about the Weeknd boycotting the GRAMMYs after accusing them of corrupt practices in nomiations. He insinuated that the GRAMMY awards often exclude black artists from awards outside of R&B related categories, such as Song of the Year and Album of the Year.
"He joins a growing list of Black stars, like Drake, Kanye West and Frank Ocean, whose public rebukes of the Grammys are a threat to an institution that views itself as a supportive home for the entire music community."
Thus, we wanted to explore any possible musical connections between award-winning songs – were R&B award-winning songs drastically different than Song of the Year winners from an audio-feature breakdown point-of-view?
Questions:
We wanted to be able to answer the following questions when viewing our visualization:
- What are the musical qualities of award-winning songs both throughout the years in a single category and throughout categories in a single year?
- Are there any trends in GRAMMY-winning songs and their release dates?
- How do trends of chart topping songs and trends in GRAMMY winners compare?
- Could the release date be a factor in influencing the chances the song will win a GRAMMY?
Data:
For the GRAMMYs data, we filtered only the categories we were using: Song Of The Year", "Best Country Song","Best Country & Western Song", "Best Rock Song", "Best Rhythm & Blues Song","Best R&B Song", and "Best Rap Song". "Best Rhythm & Blues Song" and "Best Country & Western Song" were older names used in earlier GRAMMY awards, so we combined them with "Best R&B Song" and "Best Country & Western Song", respectively. There was an issue with the data set where there were multiple winners for a category in some years. To correct this we removed the extra entries, keeping the first one which is the actual winner. Another issue with the dataset was that some artists were blank but listed in the workers column in parantheses, so we search through the workers to find the artist for songs with empty artist fields.
Our GRAMMY SVGs are grouped by category (the first chart on the "GRAMMYS AUDIO FEATURES" tab) and by year (the second chart on that same tab). Thus, it made sense to pass in two versions of our GRAMMYs data – one grouped by category, and one grouped by year. We decided to use Javascript Map with categories and years as keys; this way, we would have organized data with constant time access. By passing both maps into our GRAMMY SVGs, we could easily access to specific years and categories as needed.
For the Billboard data, we selected the longest charting song in each year by finding the row with the maximum 'weeks-on-board' field. For our Billboard SVG, we used another Javascript Map with years for keys. We first sectioned all Billboard songs into each year. Then, we iterated through each year's songs to find the song with the longest 'weeks-on-board.' In our Map, we only kept the song with the longest 'weeks-on-board'. This enabled us to easily grab the correct song when clicking a year on the SVG.
For all songs in the two final lists, we first made a call to Spotify's /search API
endpoint to retrieve the Spotify id for song and artist, album name and cover image,
and release date. Then with the with the song's id, we made a call to the /audio-featues/{id}
endpoint to retrieve data for the audio features of the song. With the artist id, we
made a call to the /artist/{id} endpoint to get the artist's popularity, genres they're
known for, and profile image.
The two lists of songs were written to two JSON files, grammys_with_spotify_data.json
and billboard_with_spotify_data, respectively. We decided to do all the data wrangling
in python and write the data to a JSON file instead of making the API calls on page load: There are
hundreds of songs that we are making calls for, and the API load time took far too long.
Additionally we were running into an issue with the API rate limit, and factoring in wait
time between calls made the load time even longer. Because our data is static, it made more
sense to load it once and save it to a JSON file that can be loaded quickly with d3 when
a user opens our site.
After deciding to combine the GRAMMYs/Billboard data wrangling with Spotify's API results, we were able to pull mainly from the JSON files to populate our chart data.
From the GRAMMYs, we looked at the following award categories:
- Song Of The Year
- Best Country Song / Best Country & Western Song
- Best Rock Song
- Best Rhythm & Blues Song / Best R&B Song
- Best Rap Song
From these categories, we derived the winning song in each category and the name of each award show (as there is a new event name every year) from the GRAMMYs database.
From the Spotify API, we found information about each winning GRAMMYs song as well as the larger context that the song exists in.
-
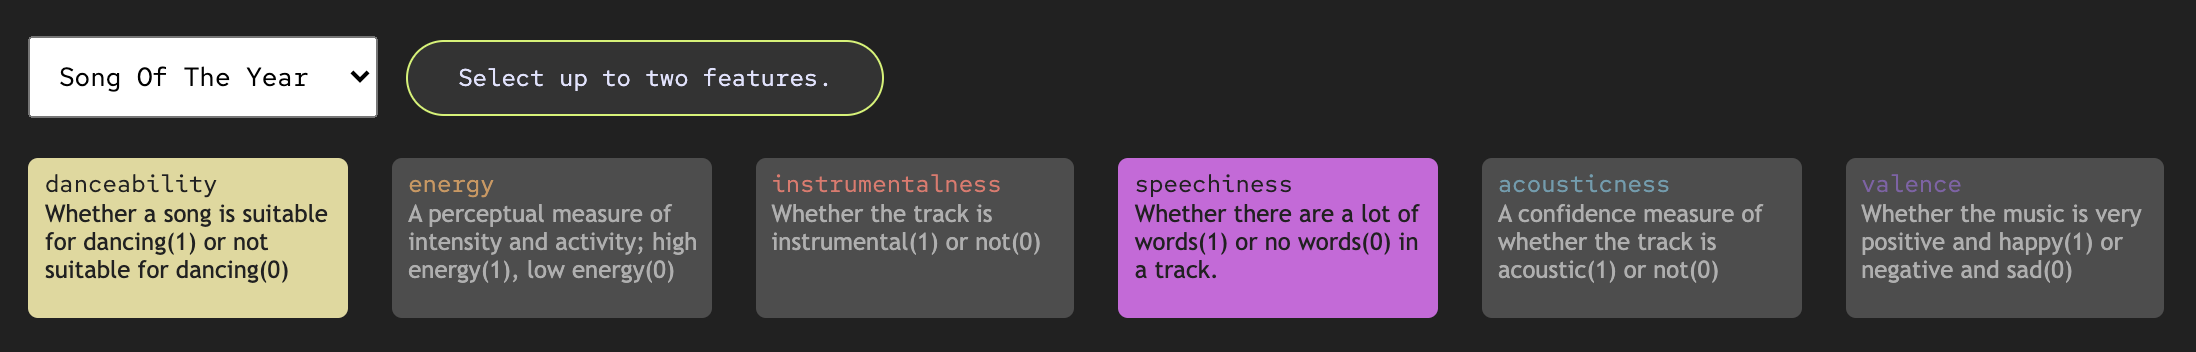
Audio Features
- Danceability
- Whether a song is suitable for dancing(1) or not suitable for dancing(0)
- Energy
- A perceptual measure of intensity and activity; high energy(1), low energy(0)
- Instrumentalness
- Whether the track is instrumental(1) or not(0)
- Speechiness
- Whether there are a lot of words(1) or no words(0) in a track.
- Acousticness
- A confidence measure of whether the track is acoustic(1) or not(0)
- Valence
- Whether the music is very positive and happy(1) or negative and sad(0)
- Danceability
- Album and album cover
- Date released
- Artist and artist profile photo, the genres that the artist typically works in, the artist’s popularity rating on Spotify
Exploratory Data Analysis:
From discovering and analyzing our dataset, we knew that we wanted to use line graphs for our visualization.
While playing around with our graphs, we were surprised at how the line graphs show very dynamic line features and we wanted to create more graphs that provide more angles on the song data, such as audio features by year. We ended up changing the features that we were looking for so they would all be on a comparable scale. :)
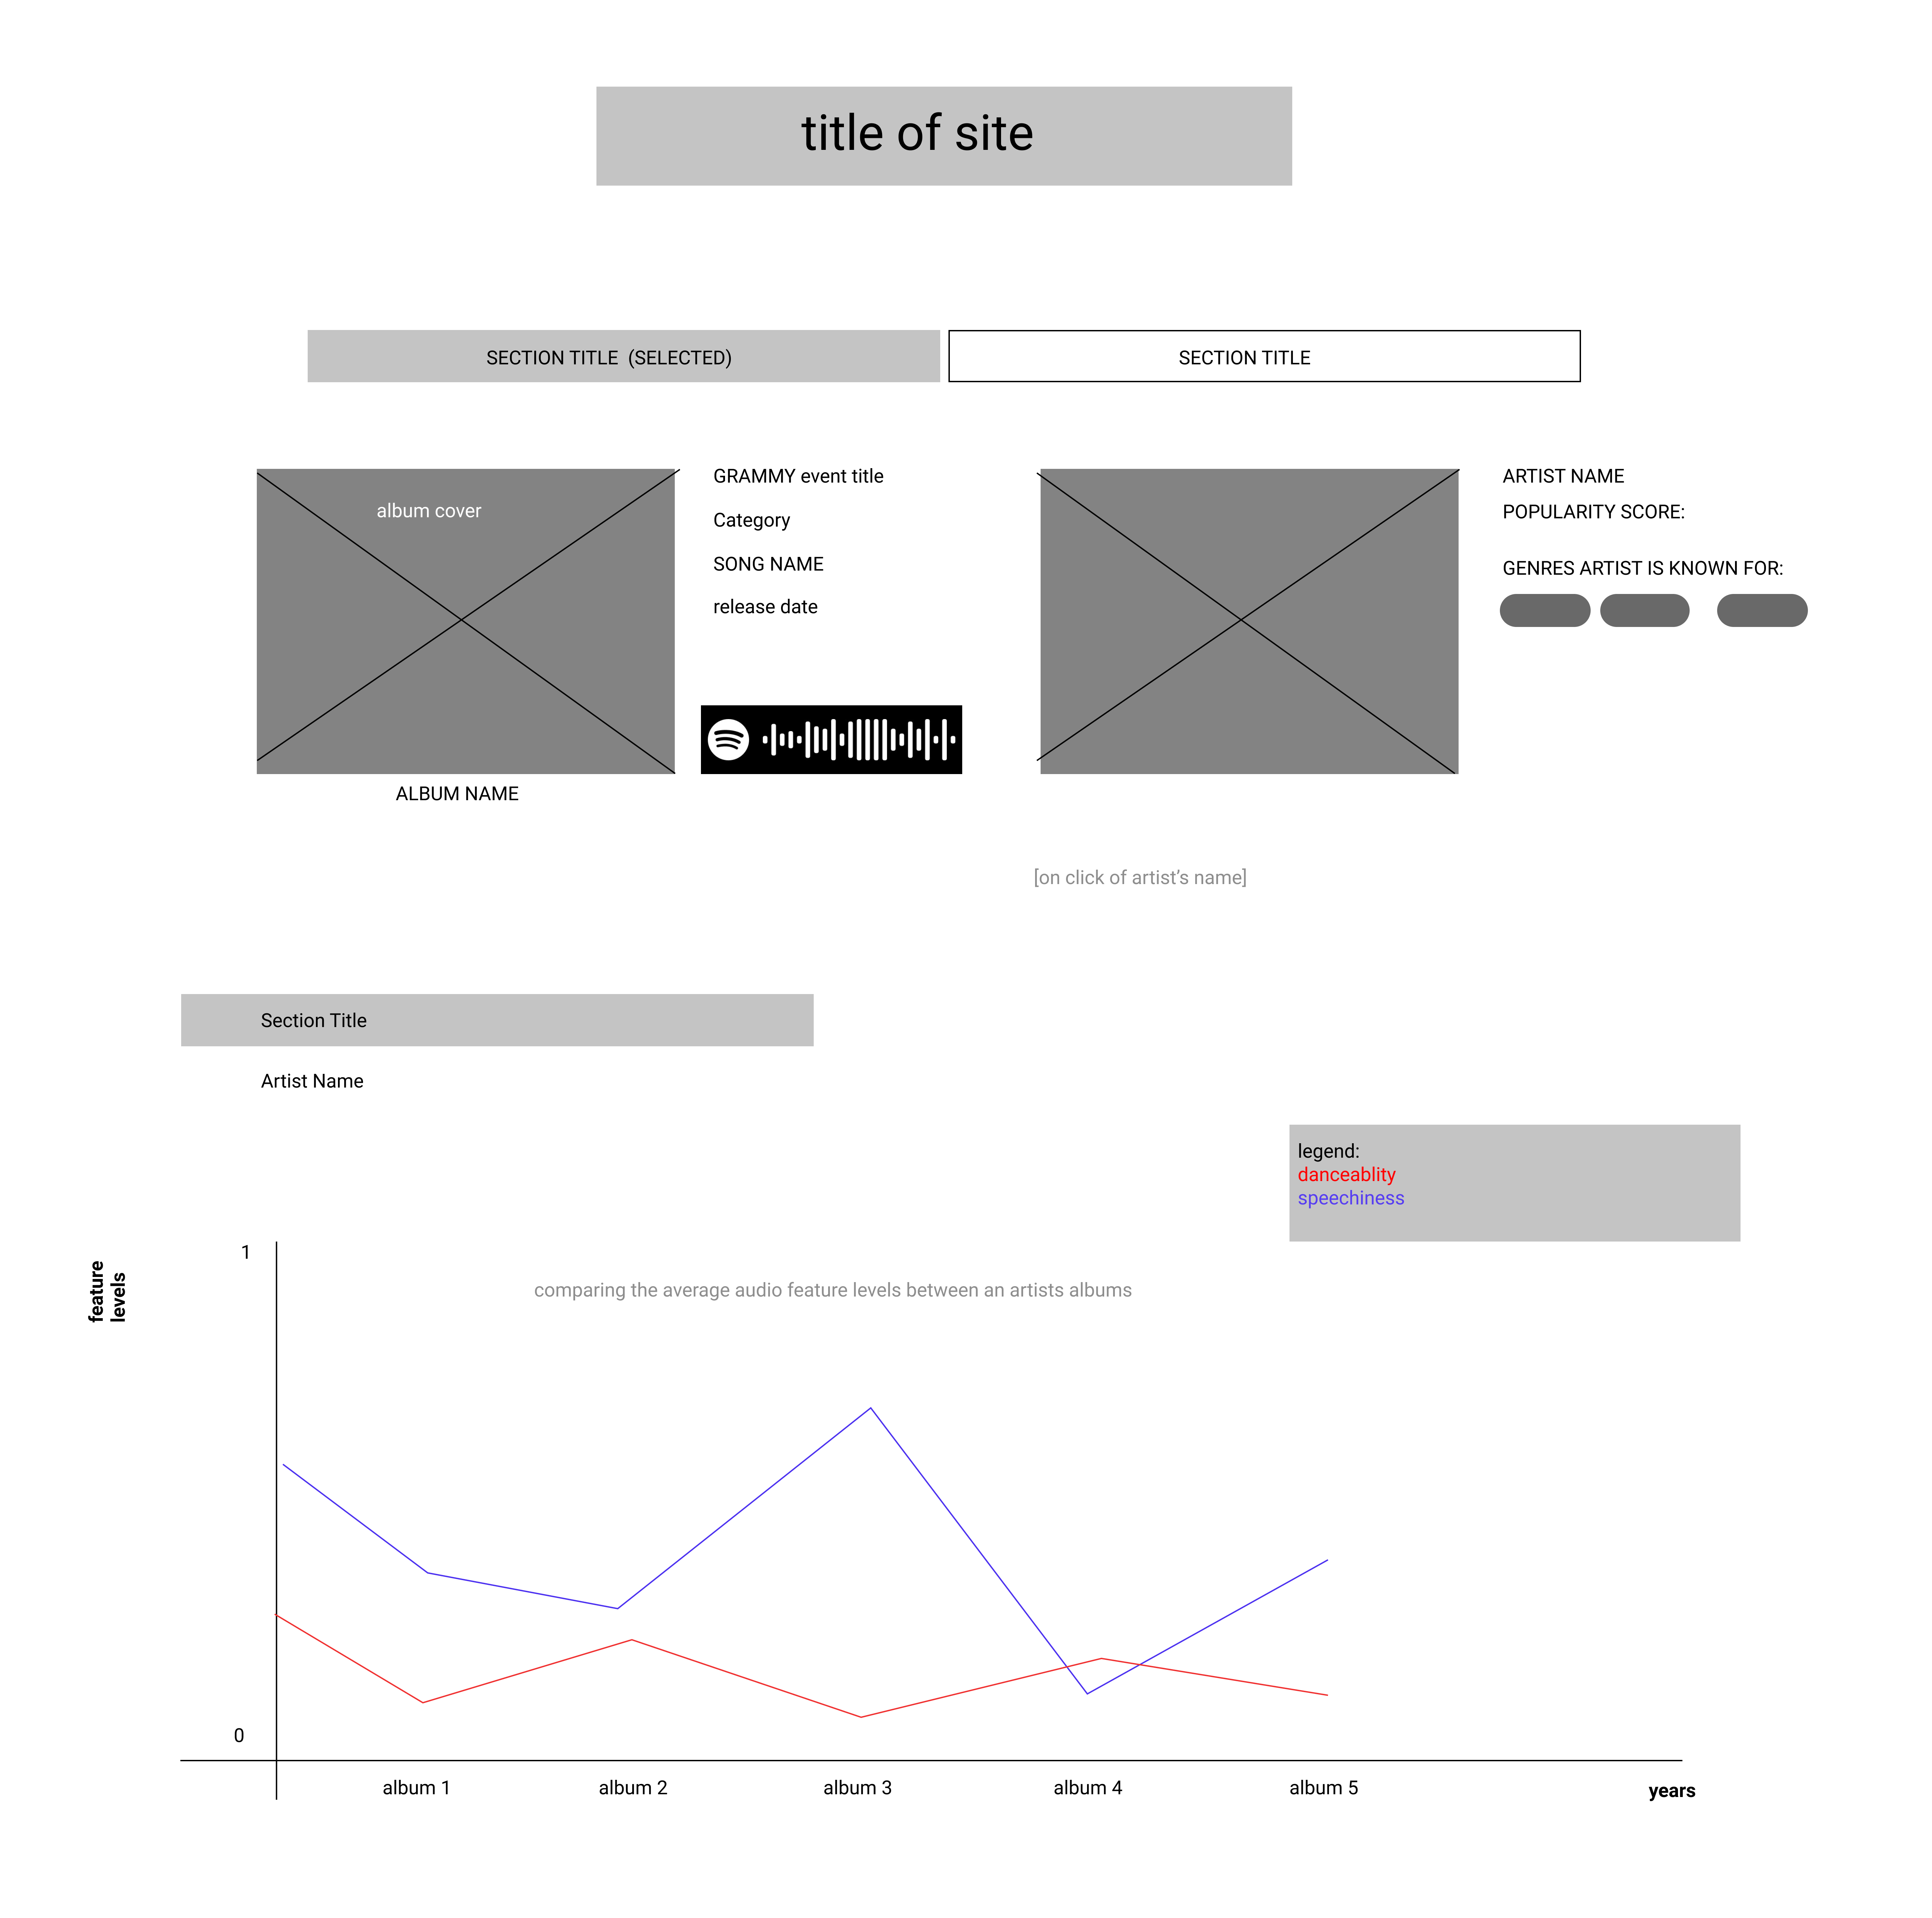
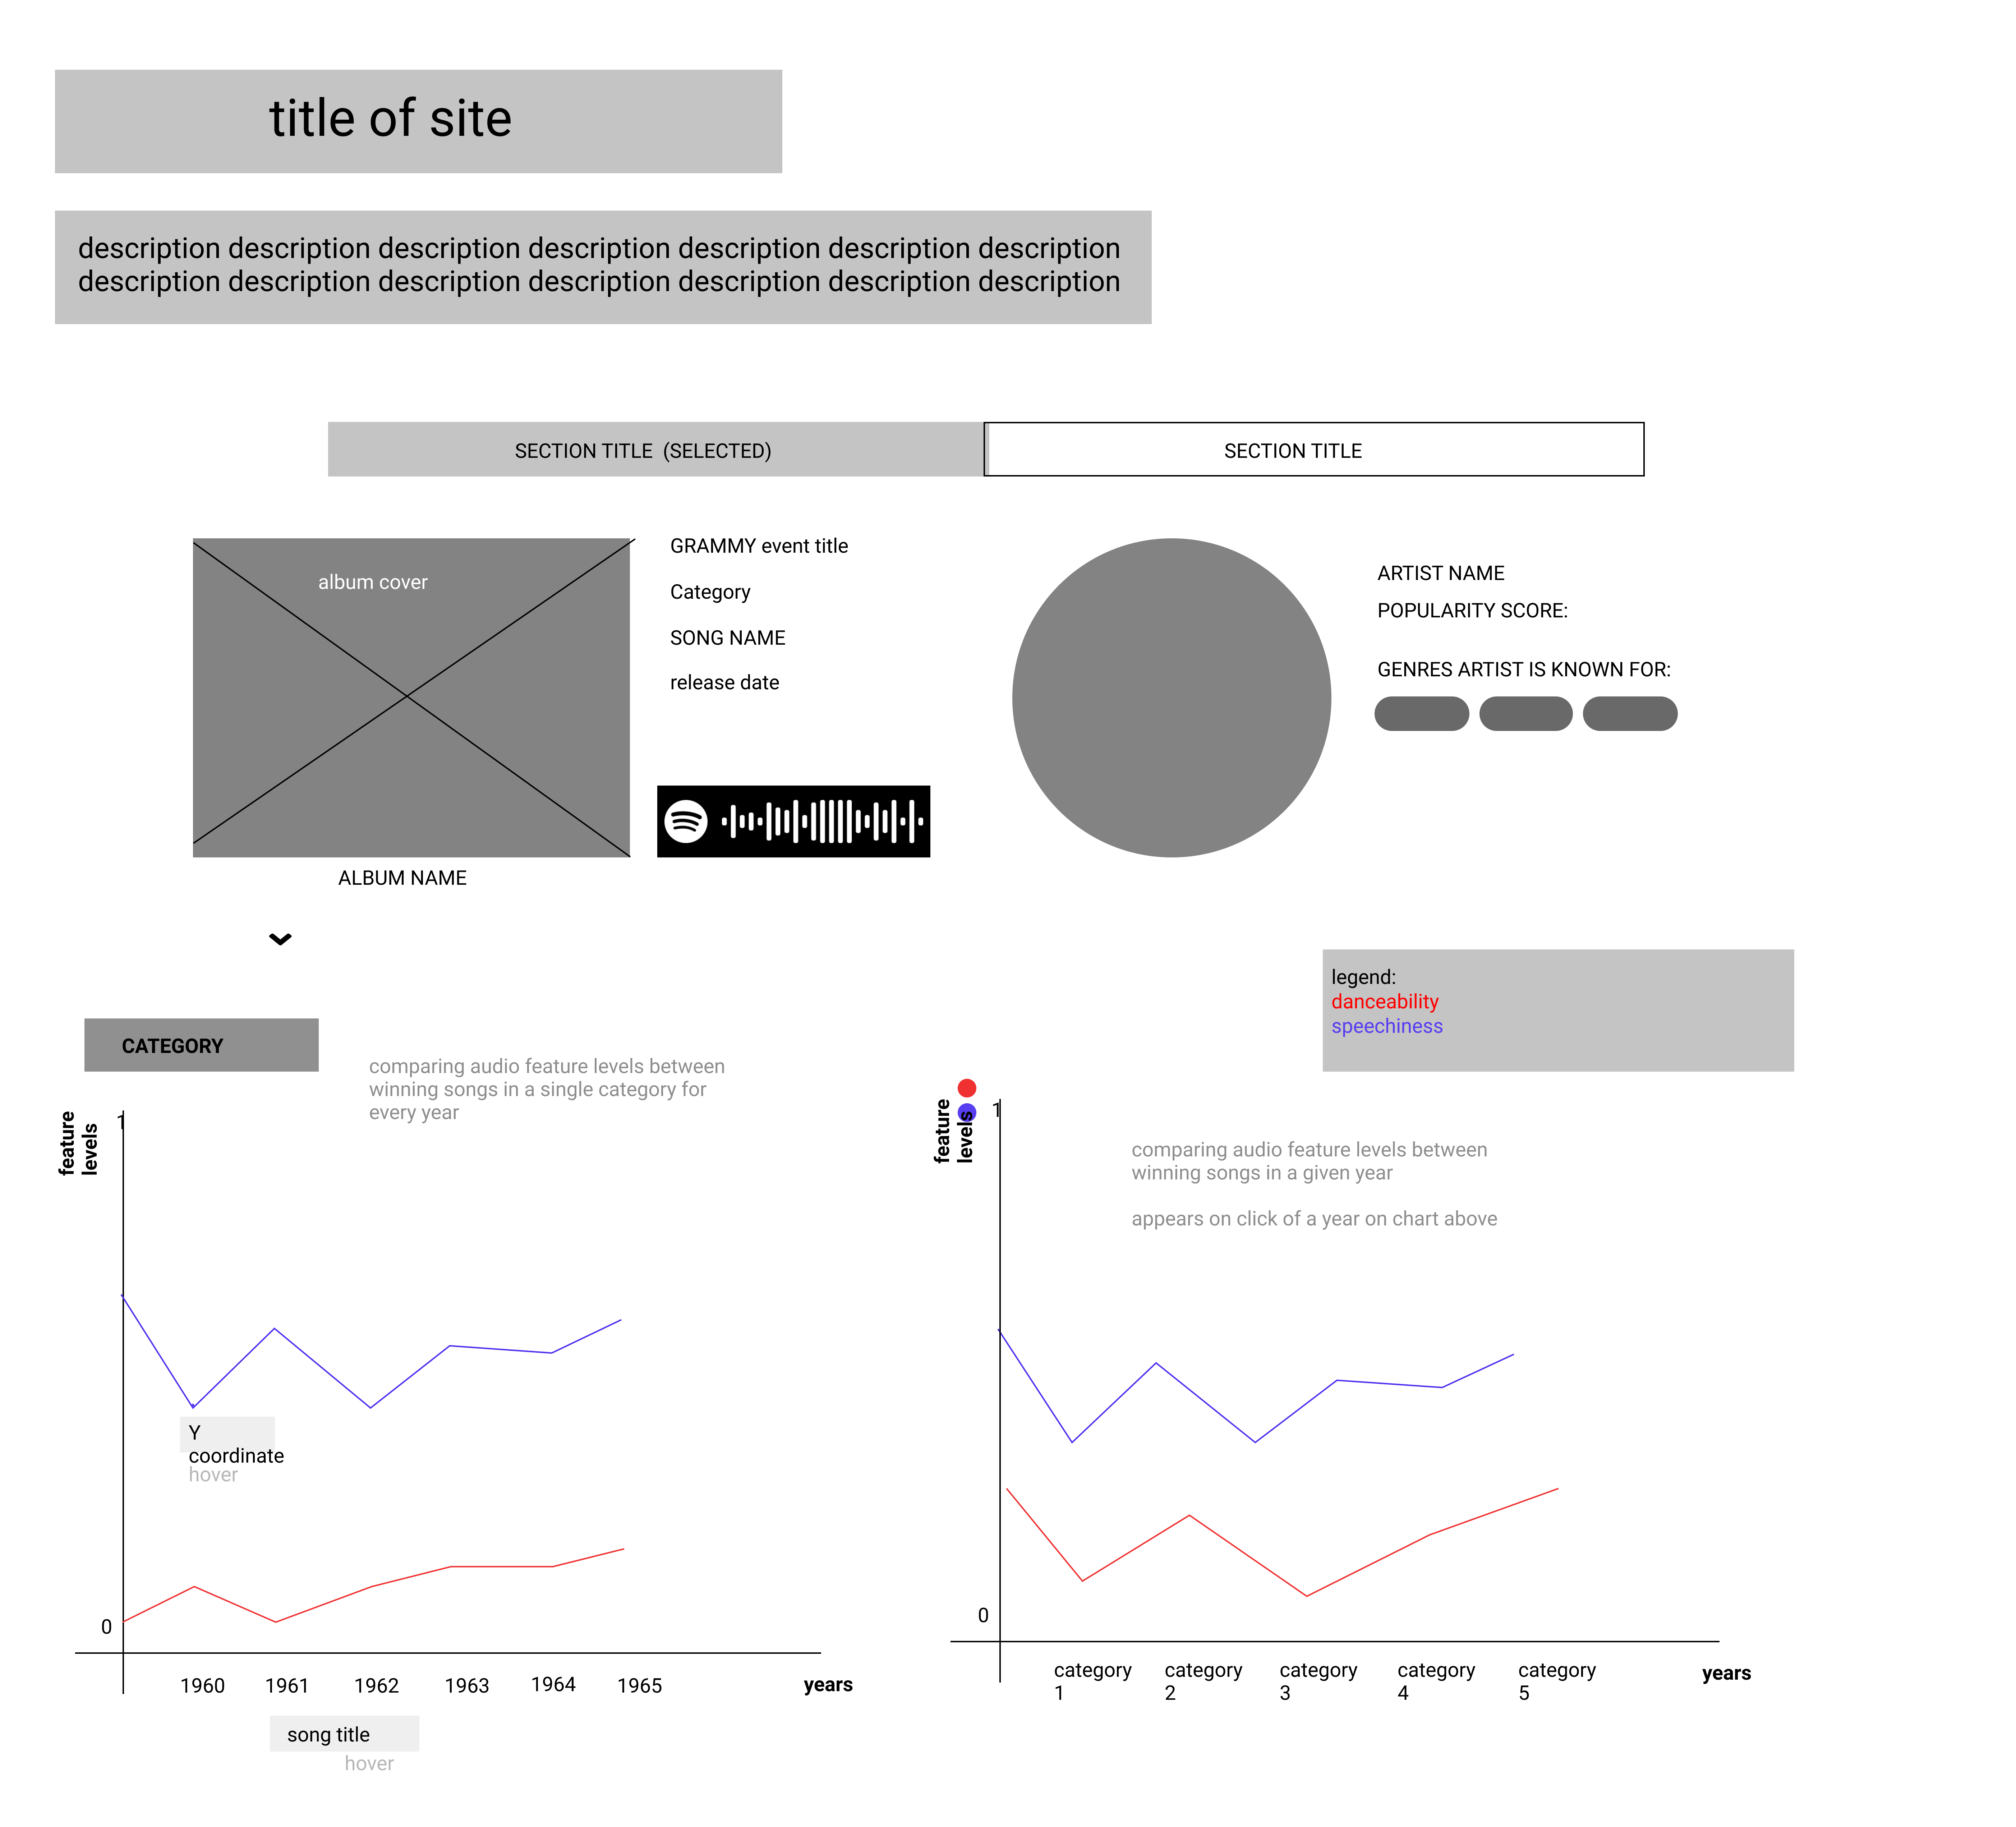
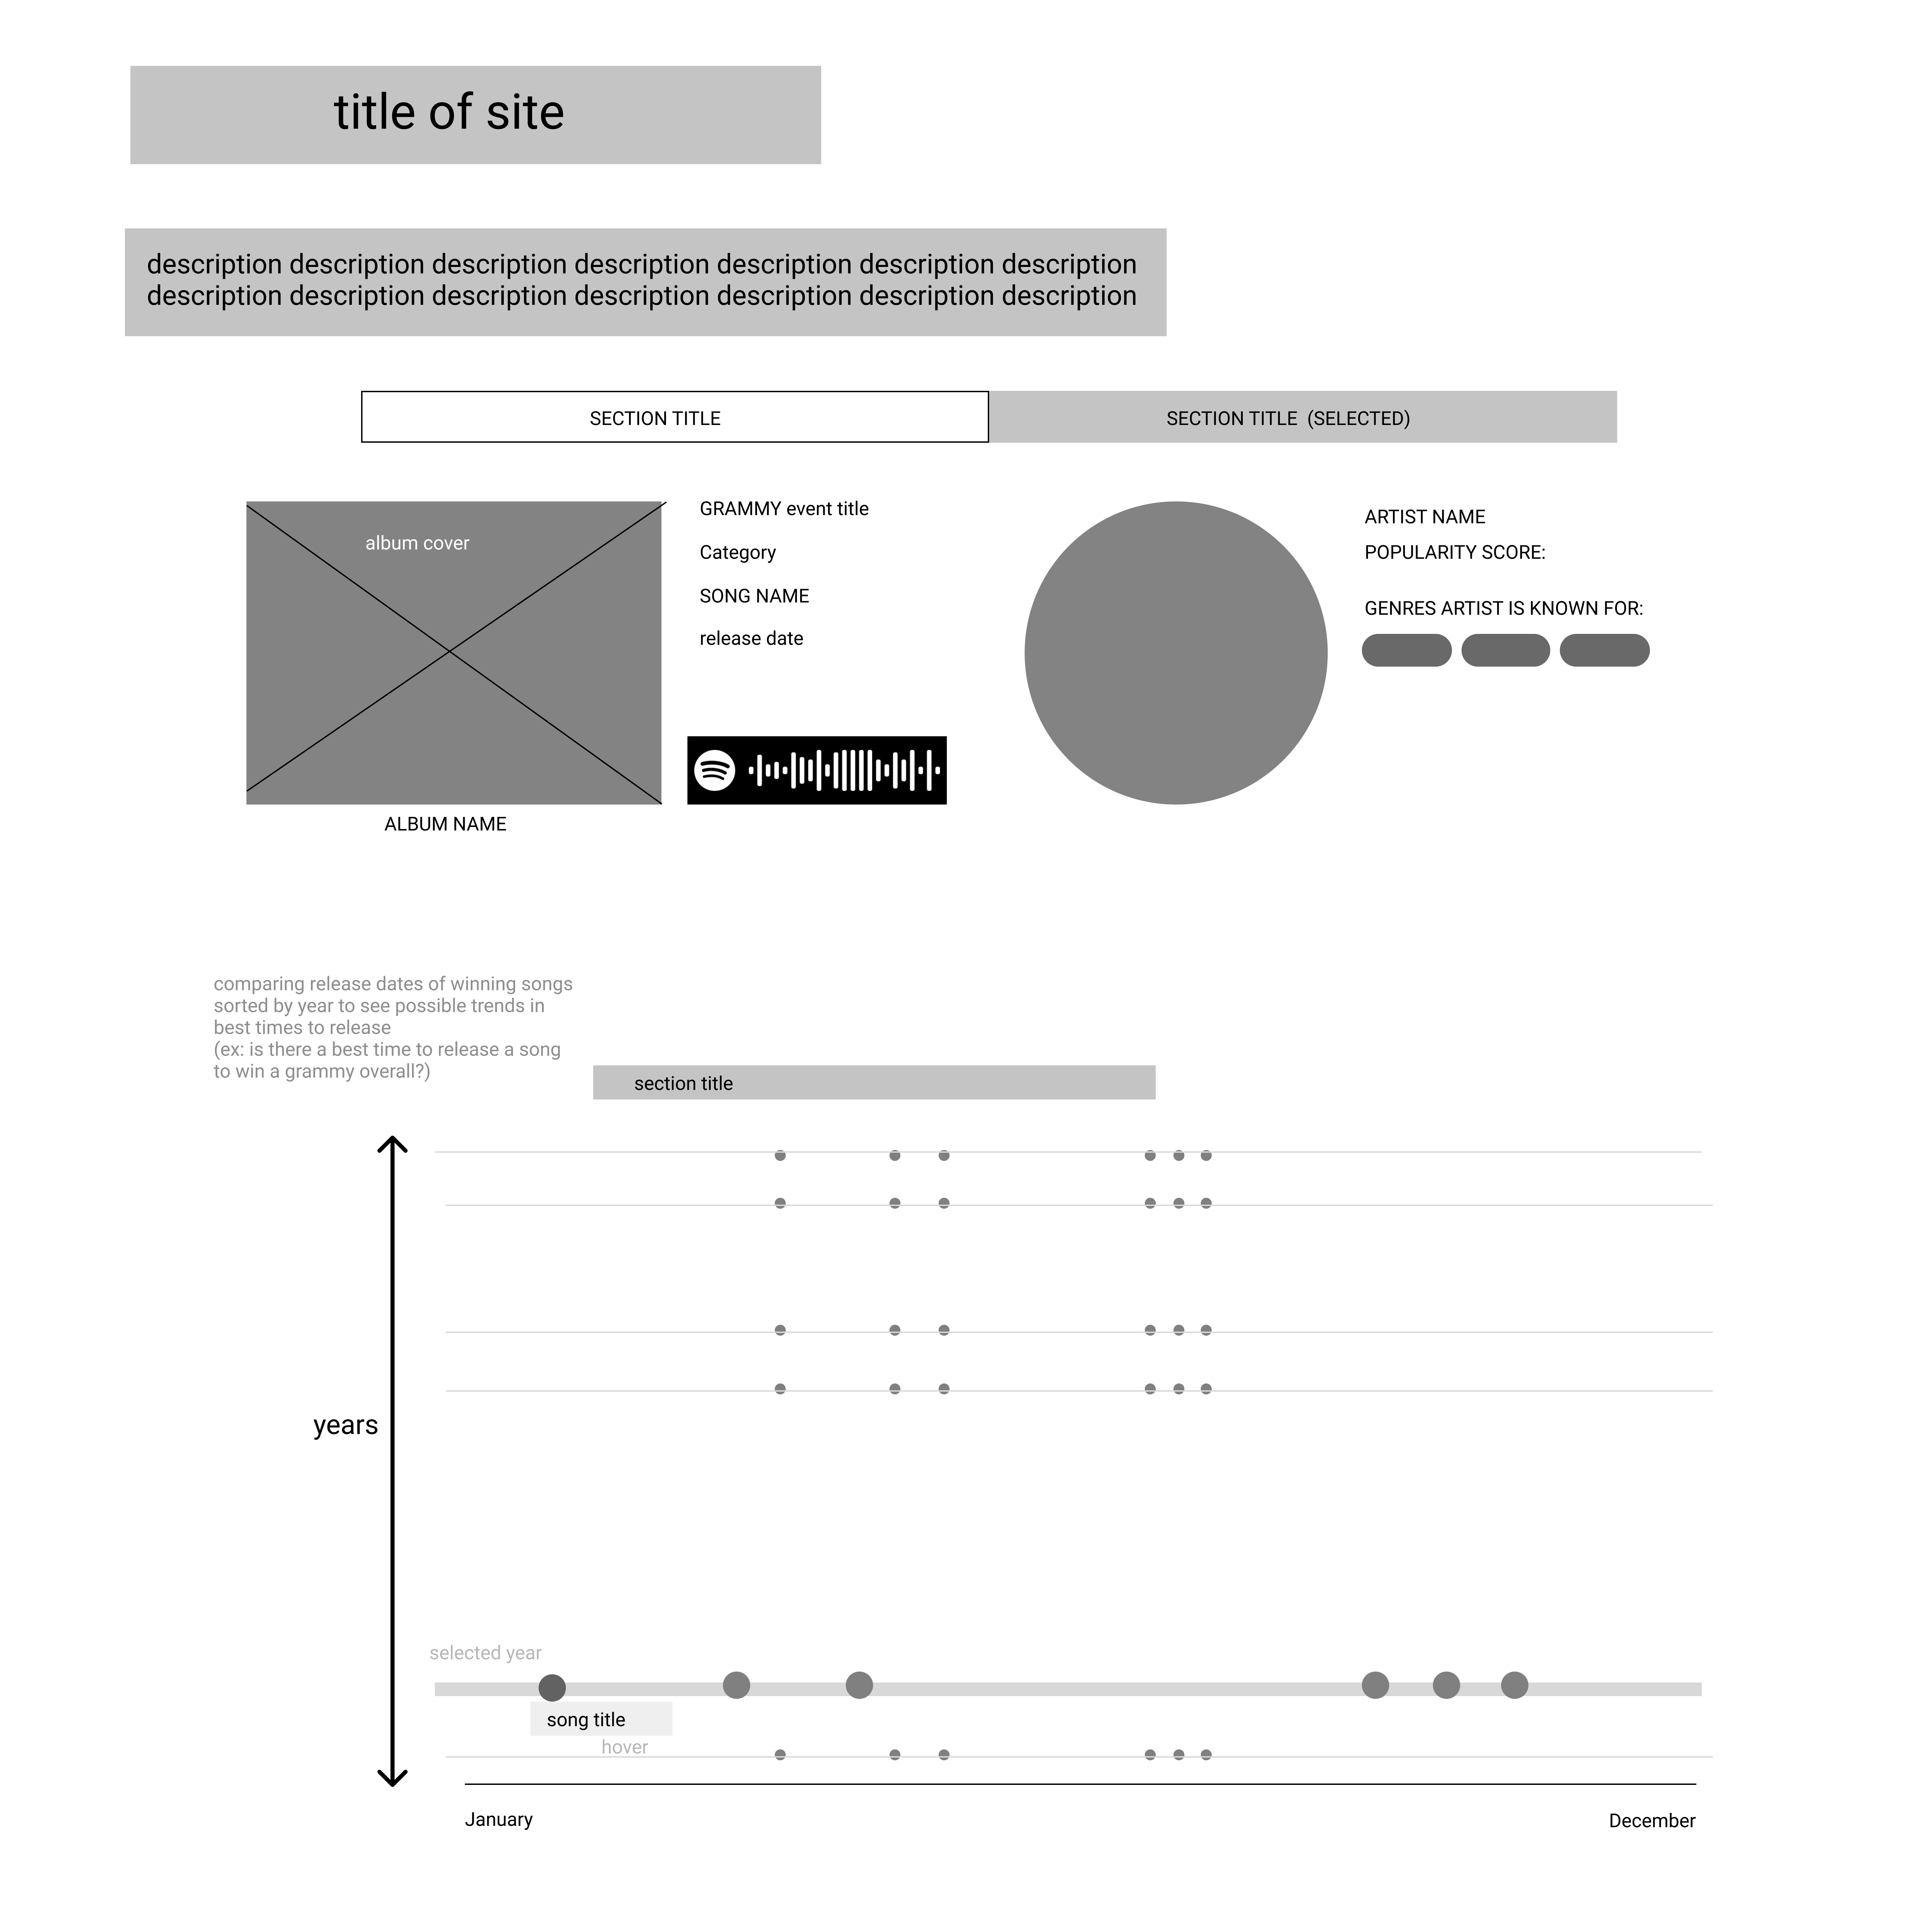
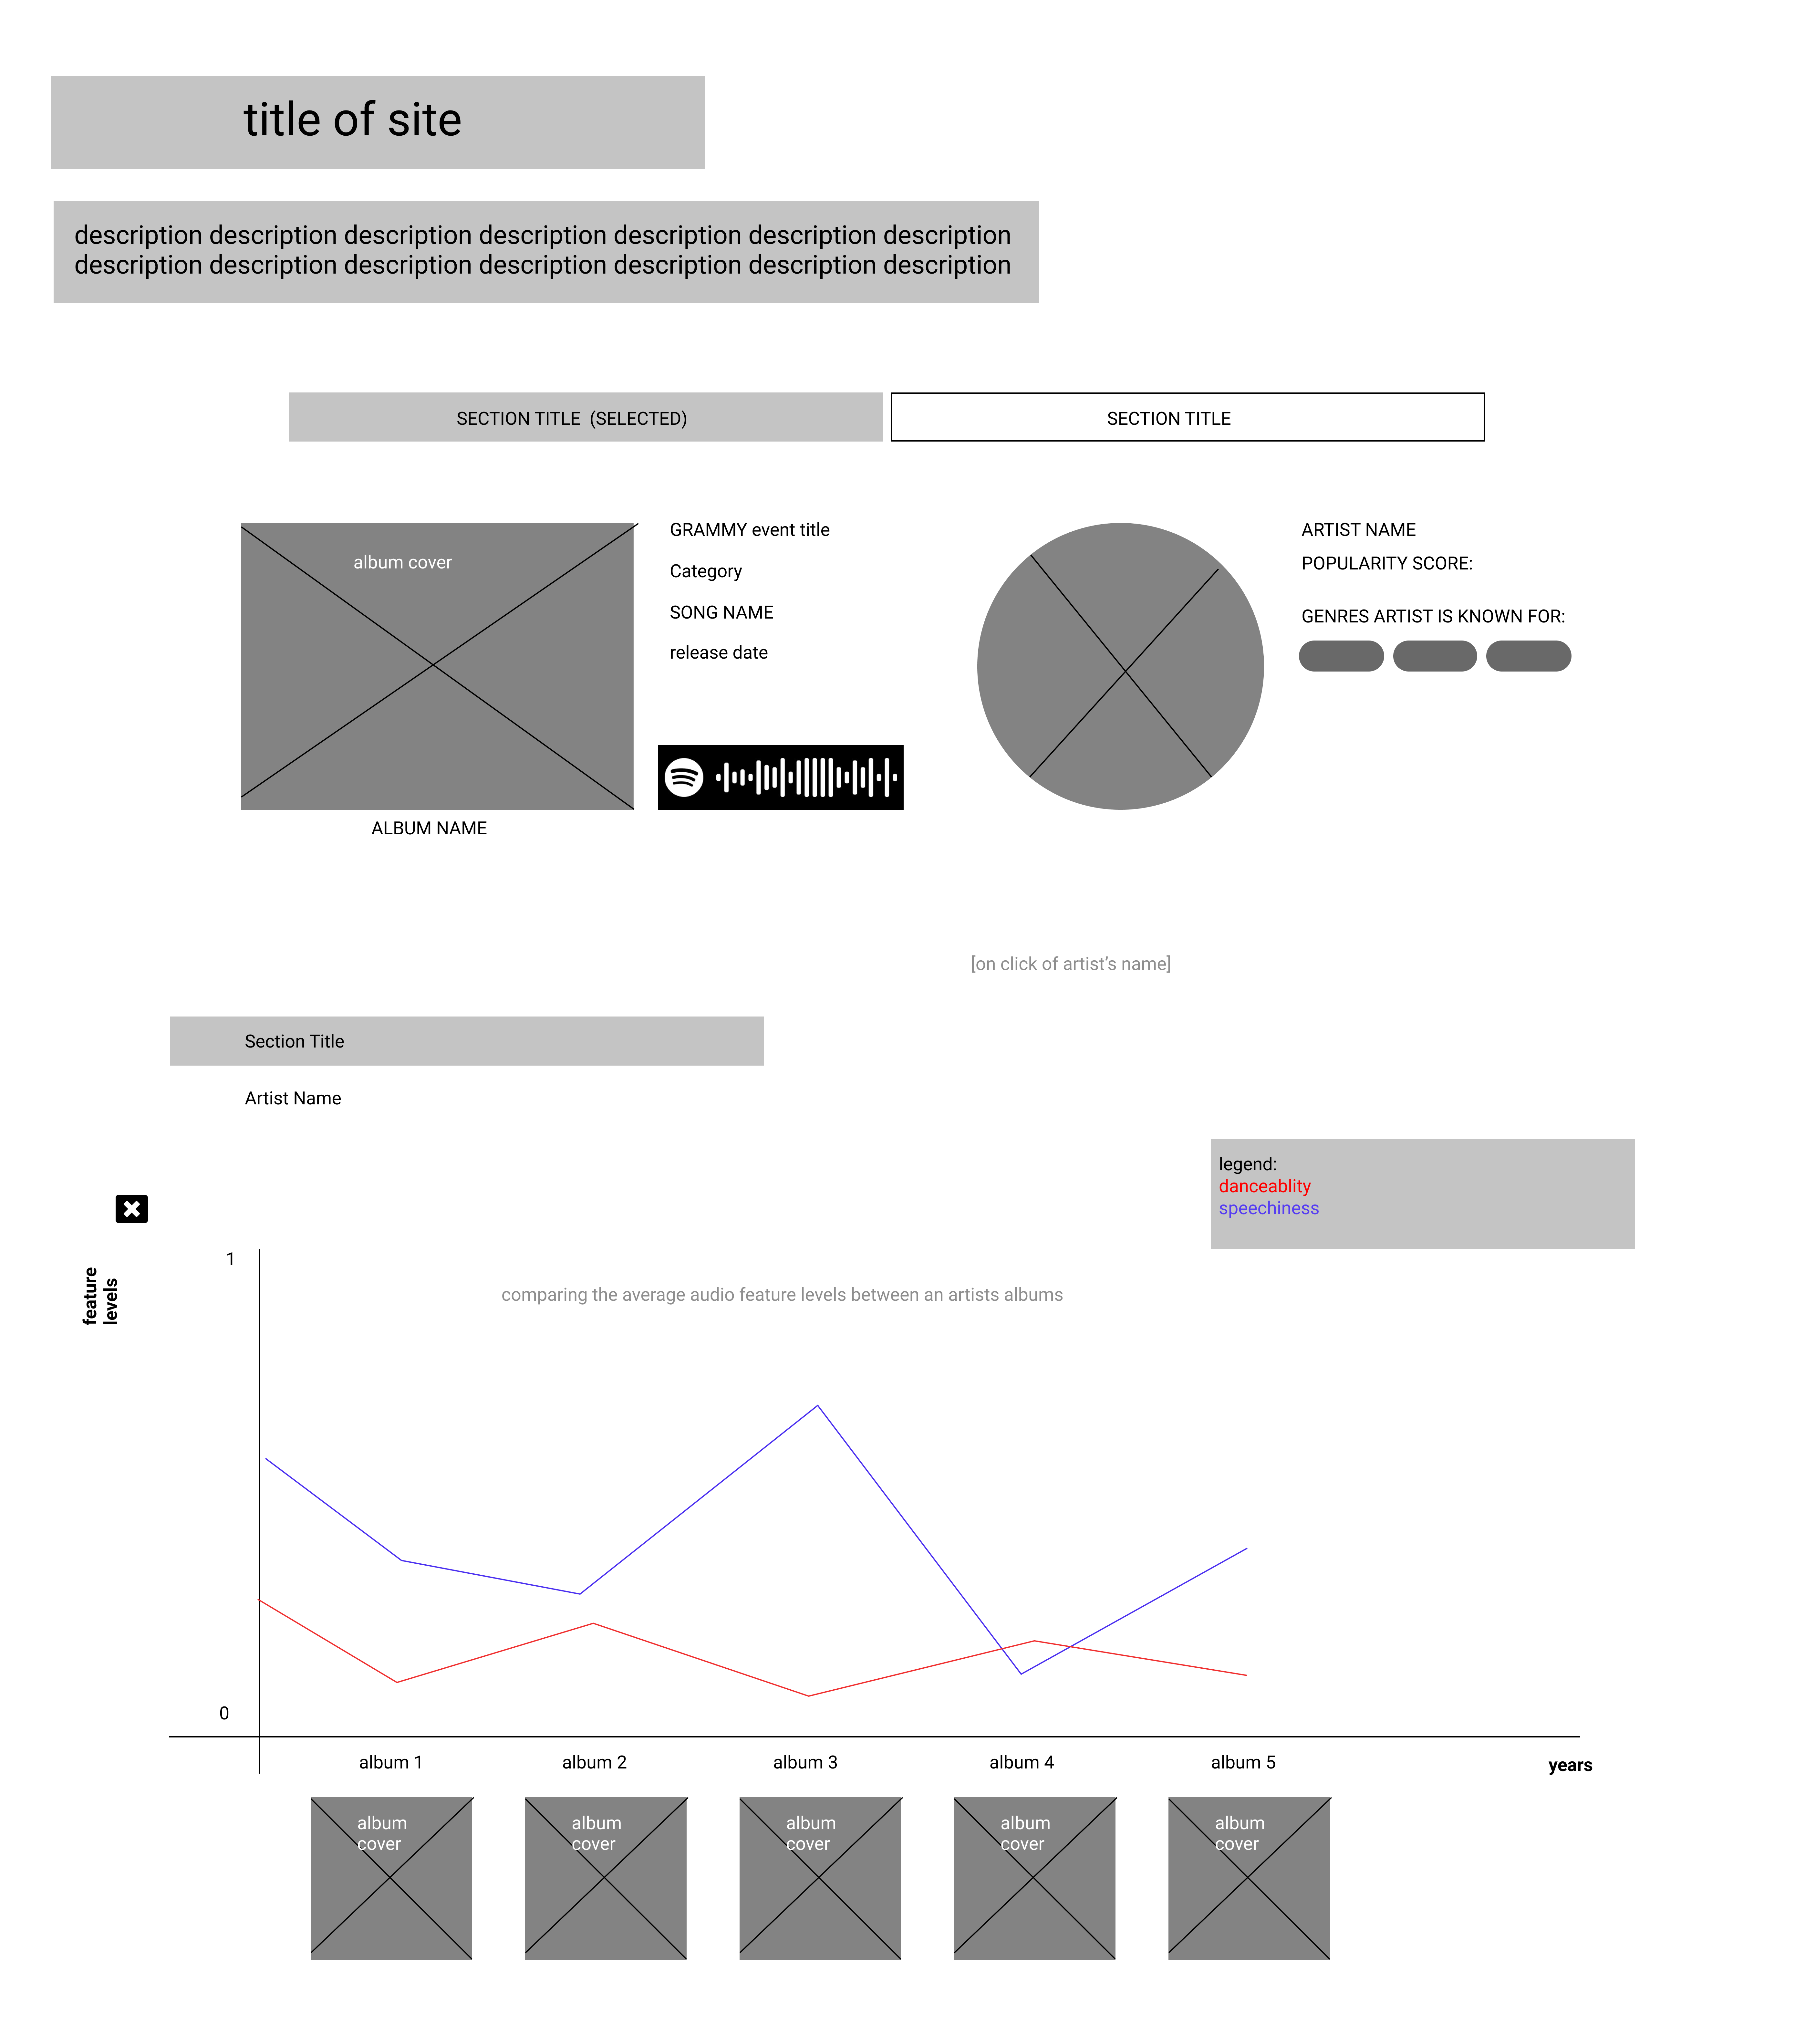
Design Evolution:
Sketches and Iterations
Design 1

Design 2
Design 3
Final Design
Implementation
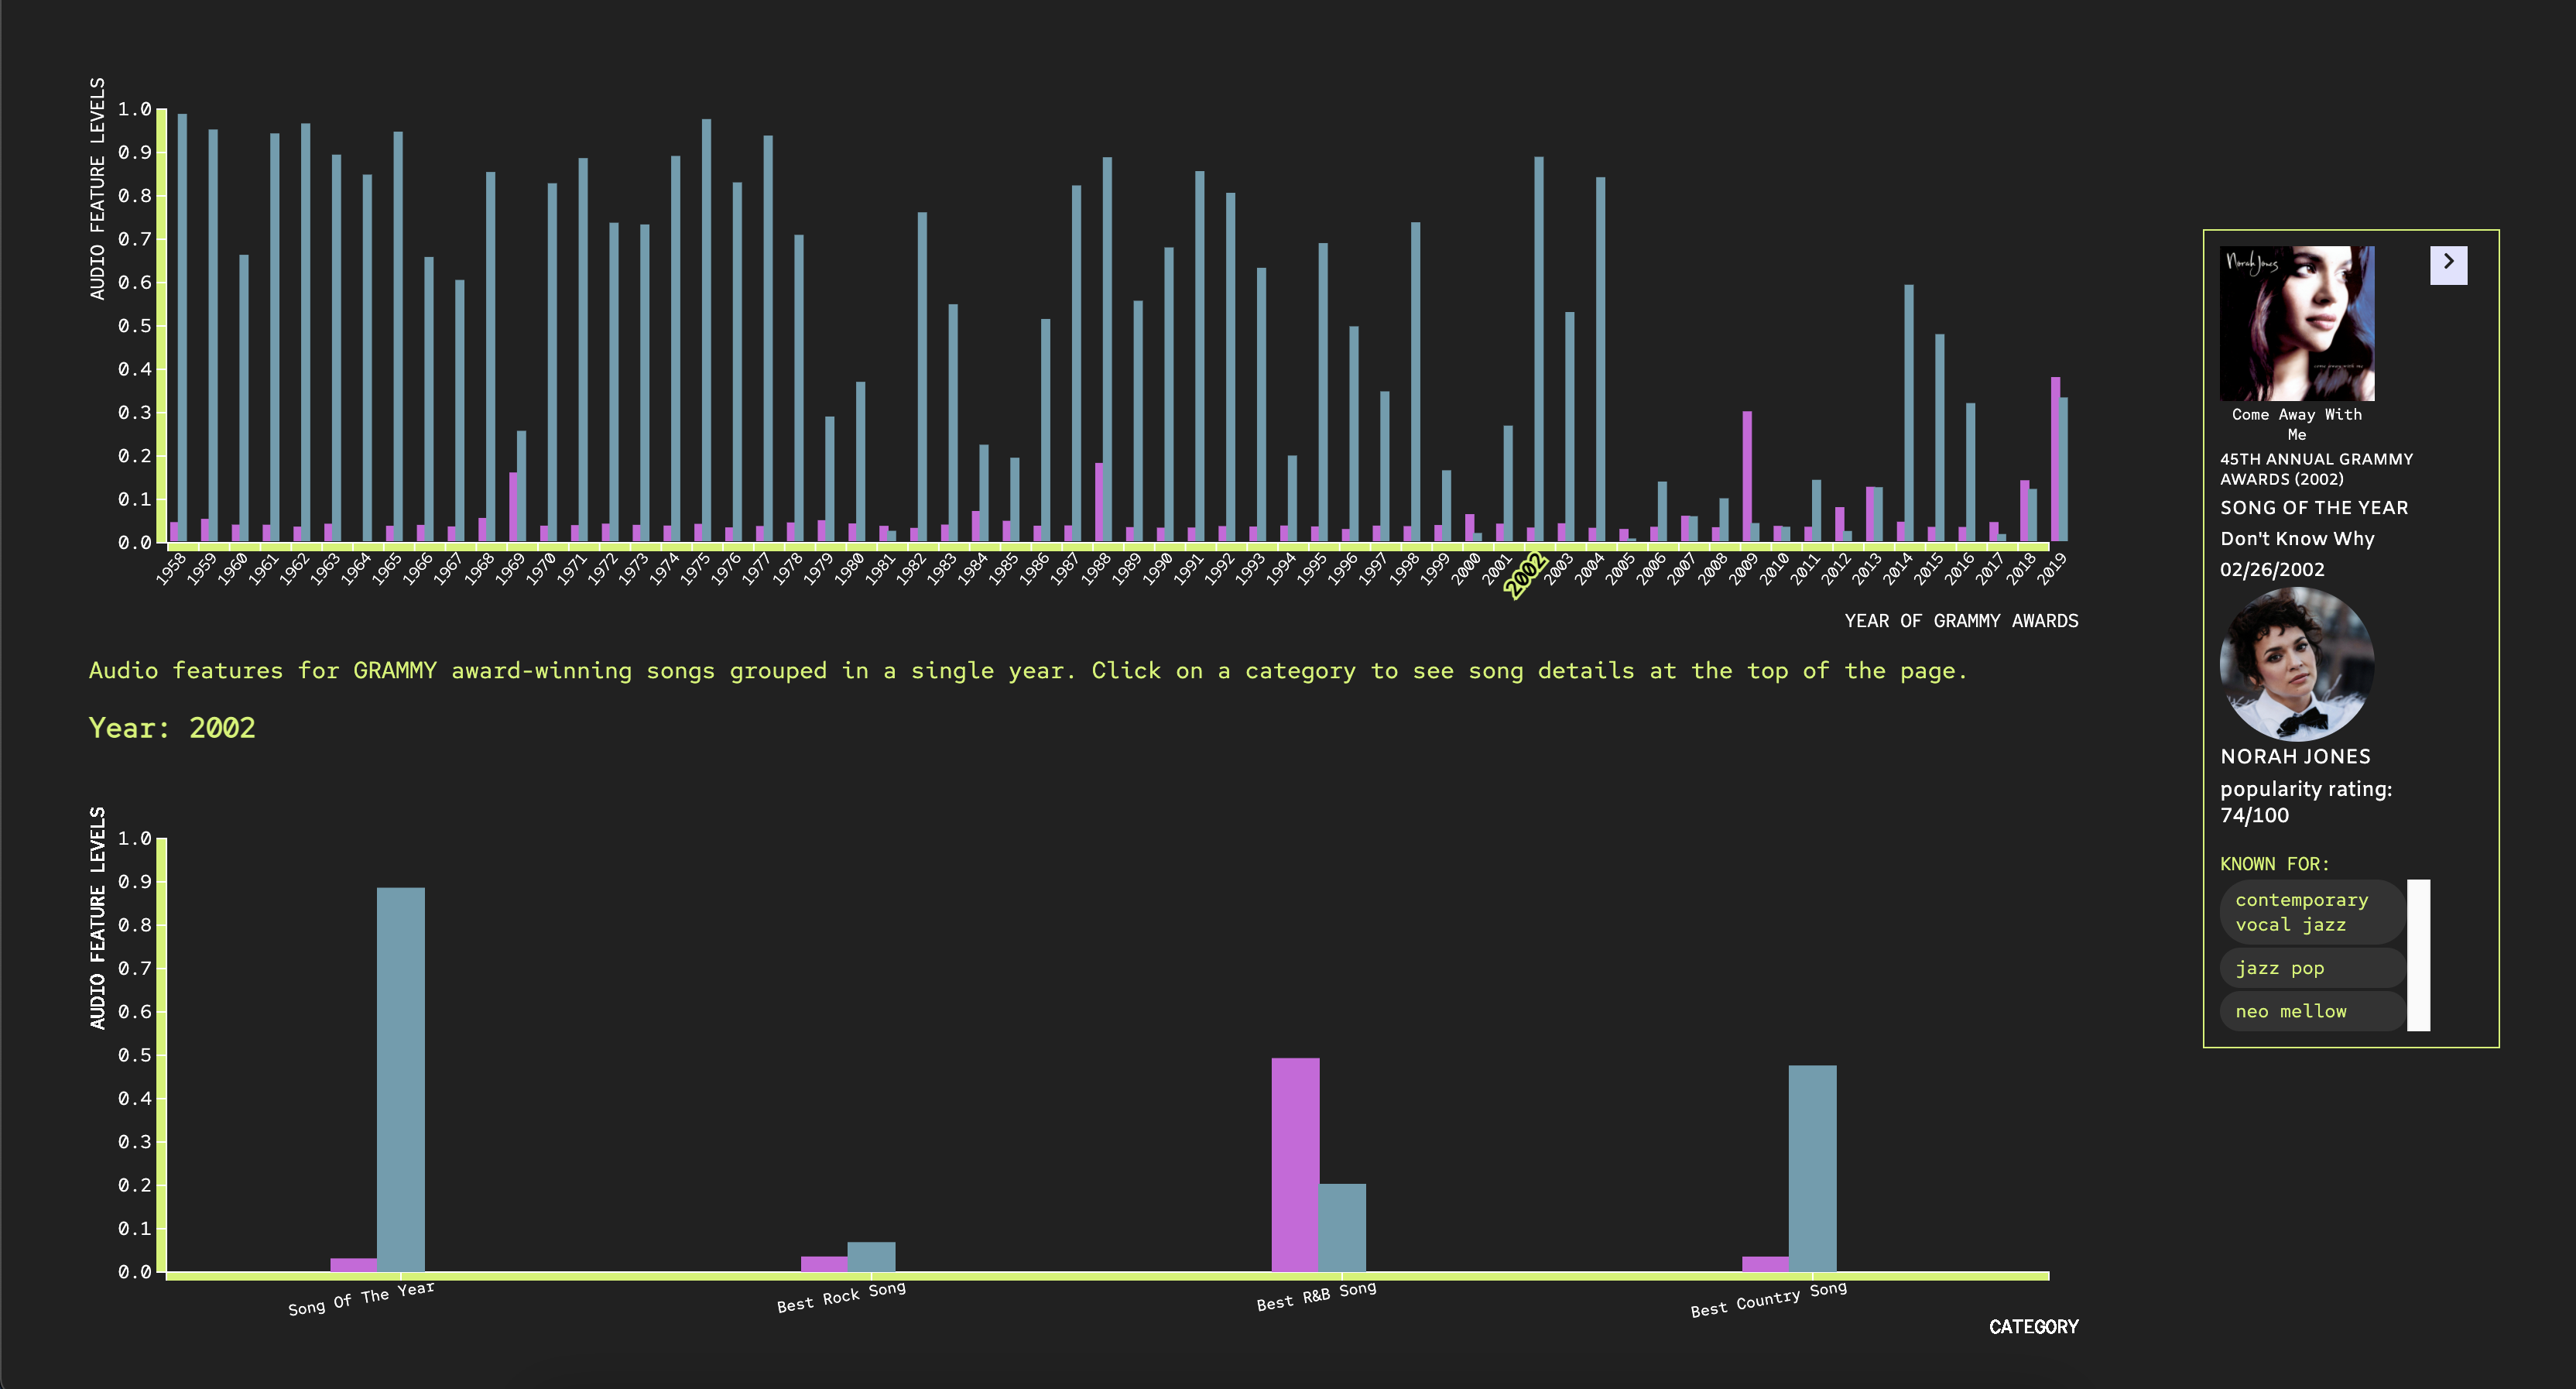
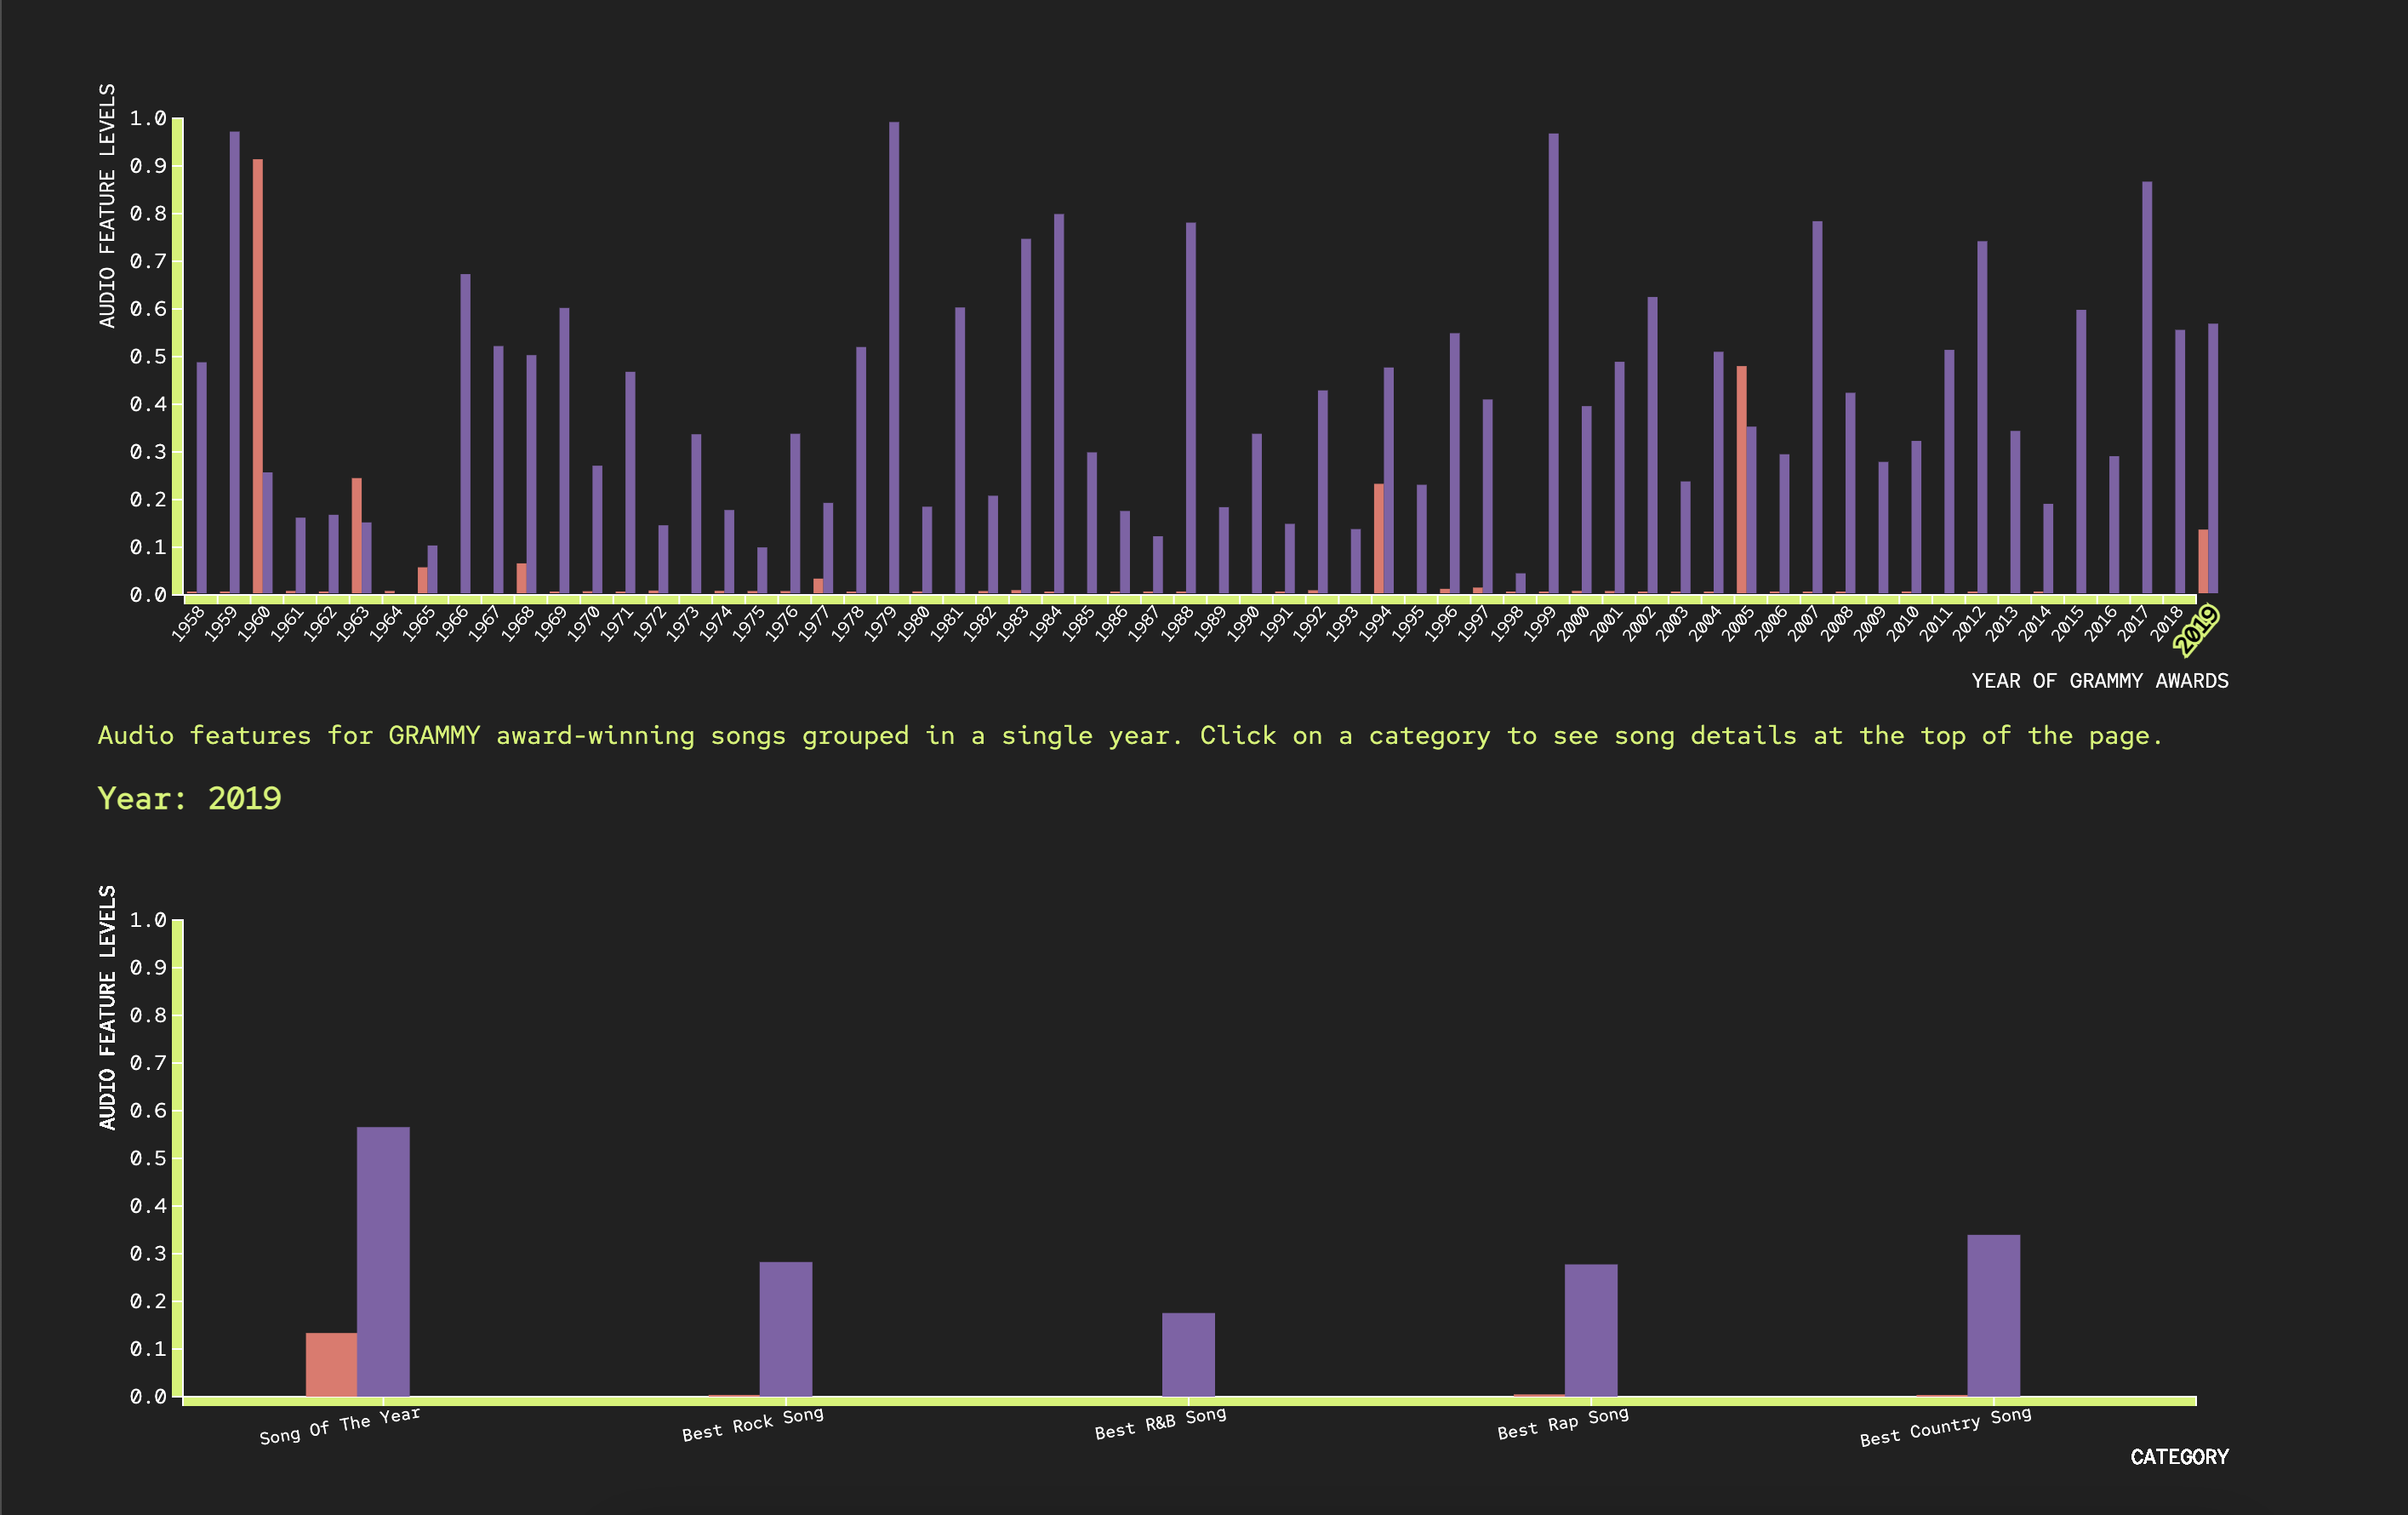
Our first chart shows the GRAMMYs audio feature comparisons throughout the years in a singular category.
Here, we can see each year’s winning song’s information, including the artist information, album information, and release date.
When we click on a singular year, a chart opens up at the bottom that shows the GRAMMYs audio feature comparisons in that year between all categories.
Users can click on a category to see the information about the winning song, artist, album, and release date.
Our third chart shows the Billboard audio features for each winning song and just like the first chart, you can see each year’s winning song’s information, including the artist information, album information, and release date.
Our third chart compares GRAMMY winning songs’ release dates to see if there is a trend in which songs win – is it better to release in a certain time frame?
User Testing
After we polished up our visualization, we conducted user testing on three people and got some valuable feedback.
- What trends/patterns do you notice across all categories in the GRAMMY audio features?
- • Energy oscillates on a vaguely regular period
- • Danceability has generally increased
- • Low speechiness and instrumentalness
- What trends/patterns do you notice across all categories in the Billboard audio features?
- • Speechiness is not very variable ⇒ assuming relative values are supposed to be small
- • Acoustincess is variable, no pattern there
- • Danceability is generally higher than GRAMMYs song of the year
- What trends/patterns do you notice across all categories in the GRAMMY release date?
- • A lot of songs were released on January 1st
- • From the early 2000s, more songs are released earlier and later in the year compared to the summer months
- General Feedback
- • Likes the colors + fonts
- • Didn't see the artist block at first
- • Hard time figuring out what to take away from the first chart
- • Add visual cues to get people to click on things
- • Line charts aren't a good fit for this data because the information isn't continuous throughout time/genres (ex. Song of the Year ↔ Best Rock Song)
- • Provide more information about the specific song on hover or click for the 'Grammys Release Dates' chart
Revision + Final Product
In order to make our visualization more user-friendly and interactive, we implemented the feedback that we got in user testing and released the final version of our project.
*in progress*
Here are the changes that we made:
- • We moved the song details box from the top of the charts to the right side so that the users don't have to scroll up and down to find the changing songs
- • Instead of continuous line charts, we decided to make bar charts
- • We got rid of the legend above the GRAMMYS AUDIO FEATURES and BILLBOARD AUDIO FEATURES charts by combining it with the description of the audio features and color-coding the different features
- • We also implemented a function where you can select two of the audio features that you want to compare for the GRAMMYS AUDIO FEATURES and BILLBOARD AUDIO FEATURES charts -> It will be less confusing for the users and easier to identify patterns
- • We decided it would make a more interactive and informational visualization if we add a feature where we can directly compare GRAMMYs winners versus Billboard winners
Evaluation
What are the musical qualities of award-winning songs both throughout the years in a single category and throughout categories in a single year?
♪ We were able to identify the different musical qualities for each award-winning song (danceability, energy, instrumentalness, speechiness, acousticness, valence).
♪ We also can see their visible trends depending on the genre of the song and time period.
Are there any trends in GRAMMY-winning songs and their release dates?
♪ We identified a lot of songs being released on the first day of each year.
Could the release date be a factor in influencing the chances the song will win a GRAMMY?
♪ We saw that a lot of songs were released on January 1st, so we thought that there could be some level of influence but we could use more data to support this.
We thought our visualization works really well! If we have more time, we would like to work on zoom functions and implementing an auto-play function to be able to play the song that pops up when the user plays with our site.