Original Designs
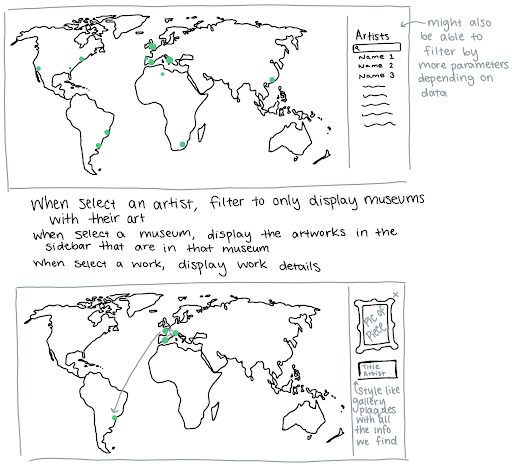
Brainstorming
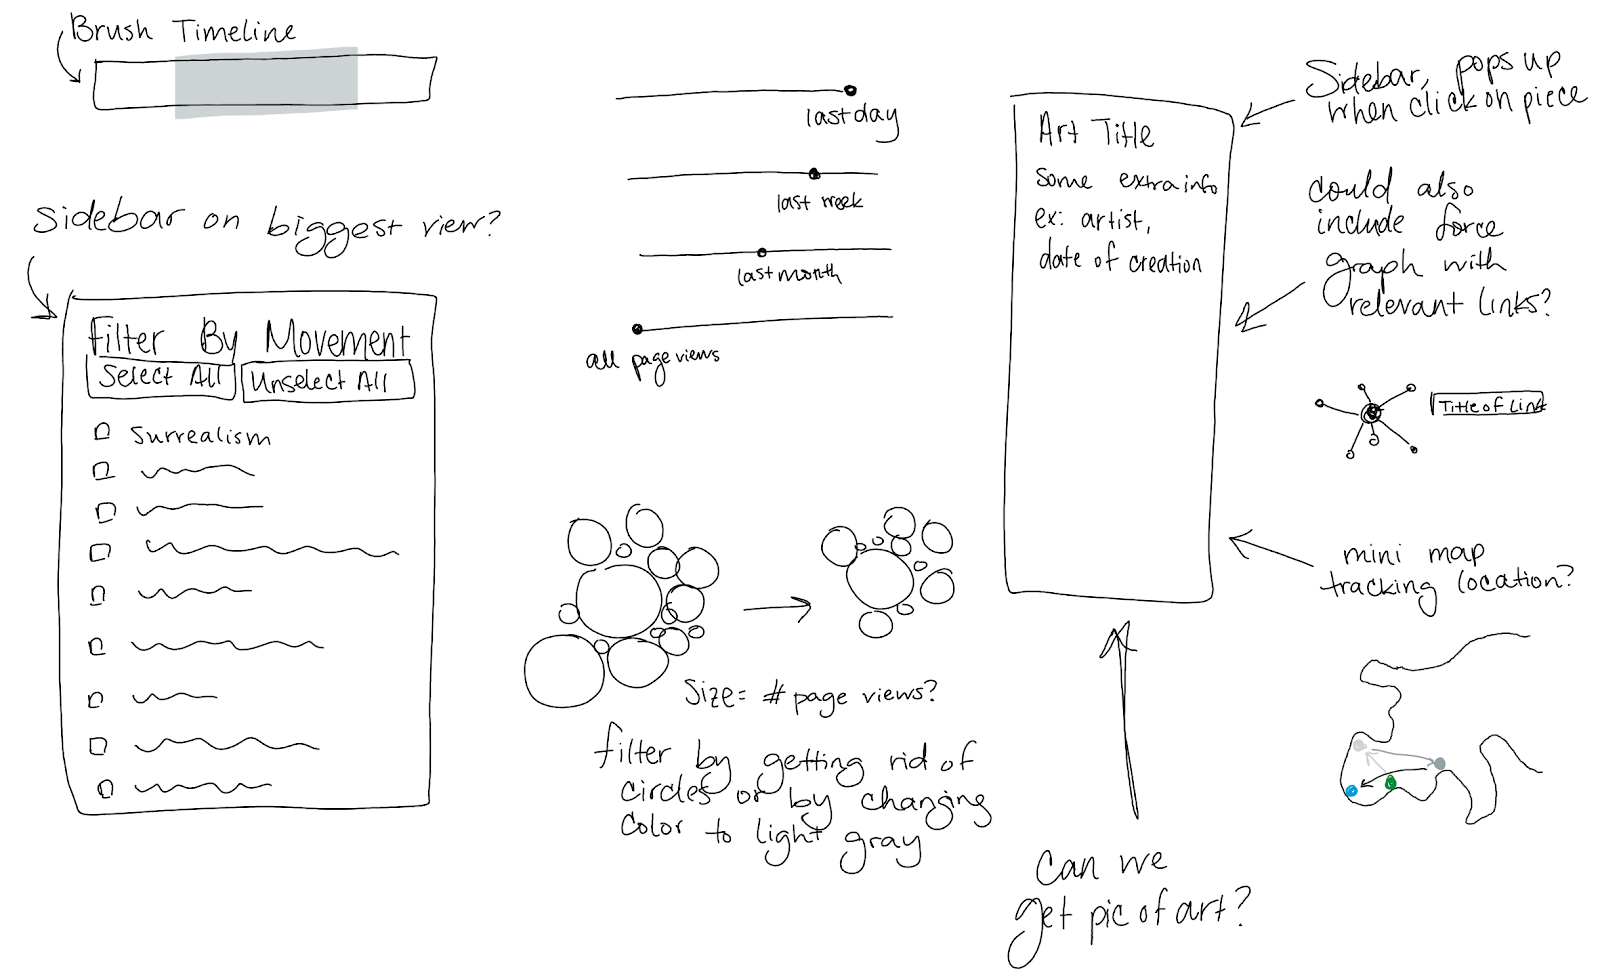
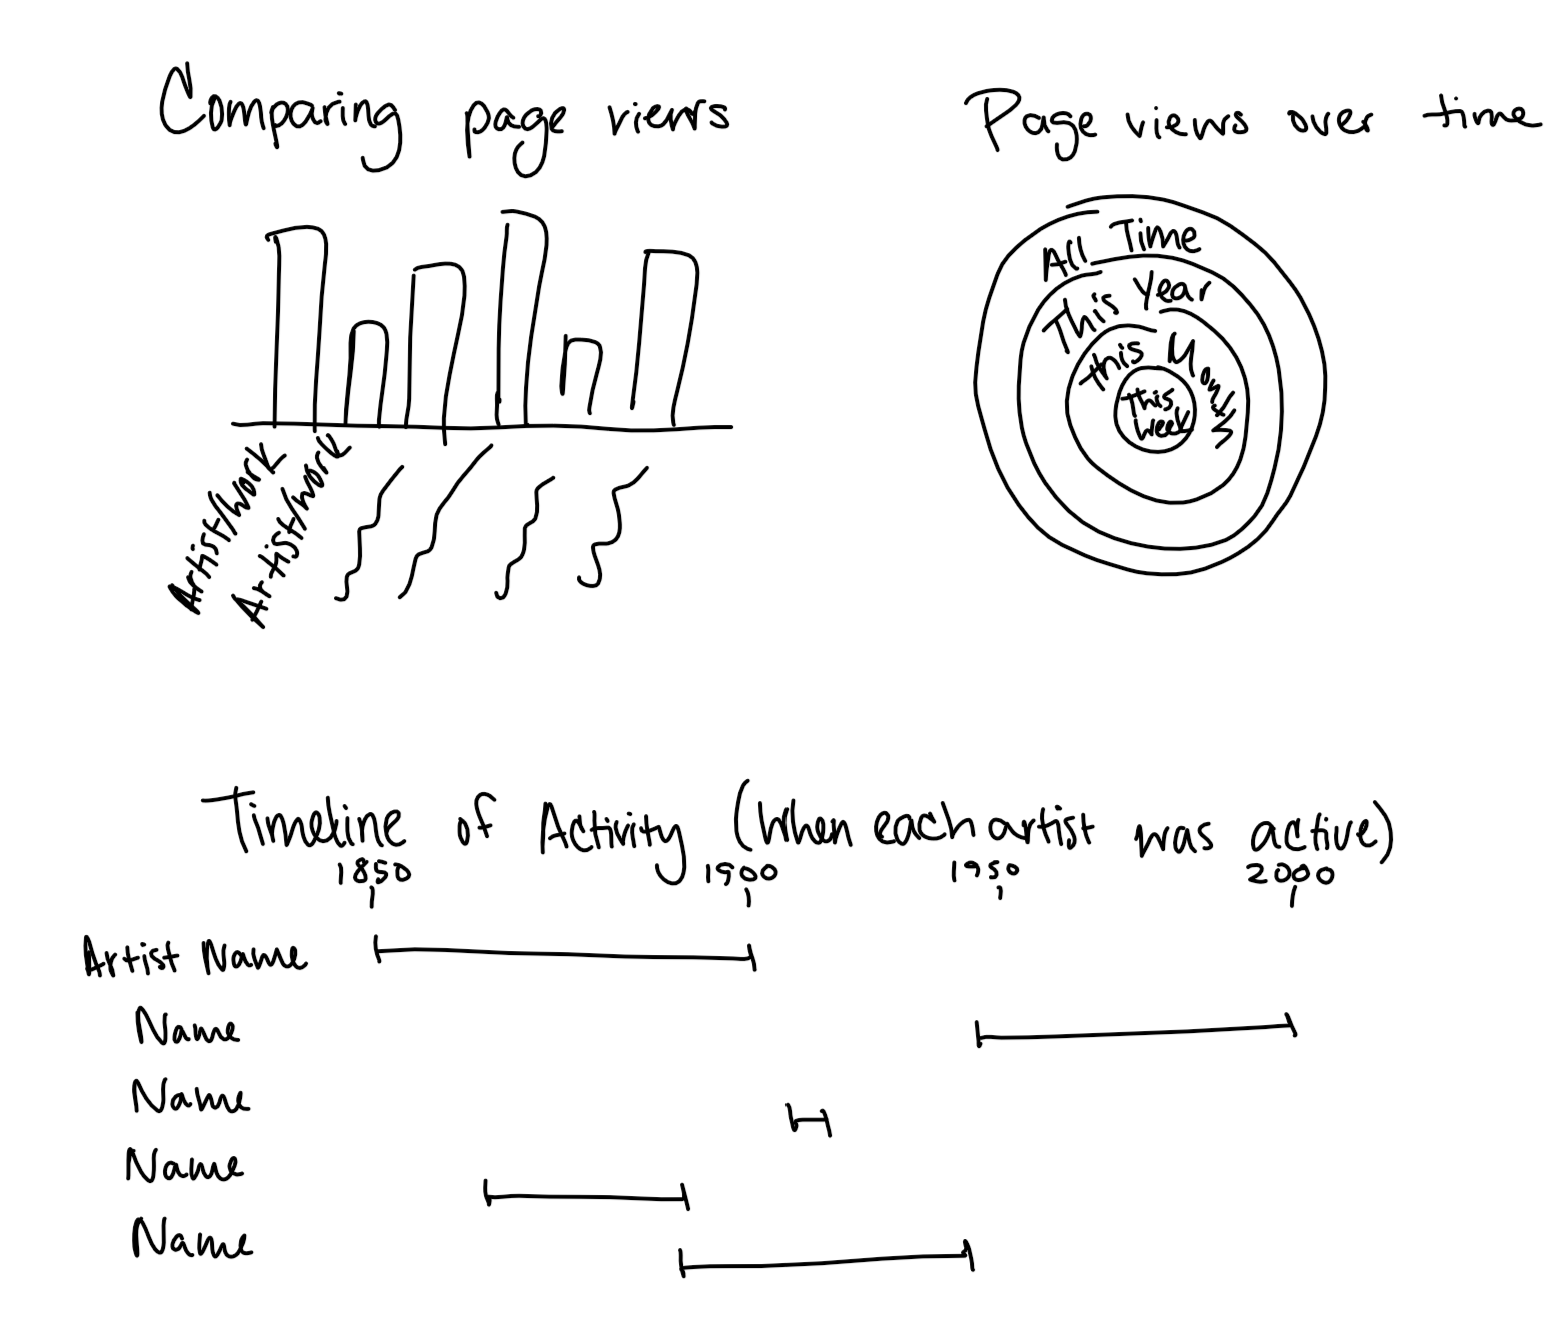
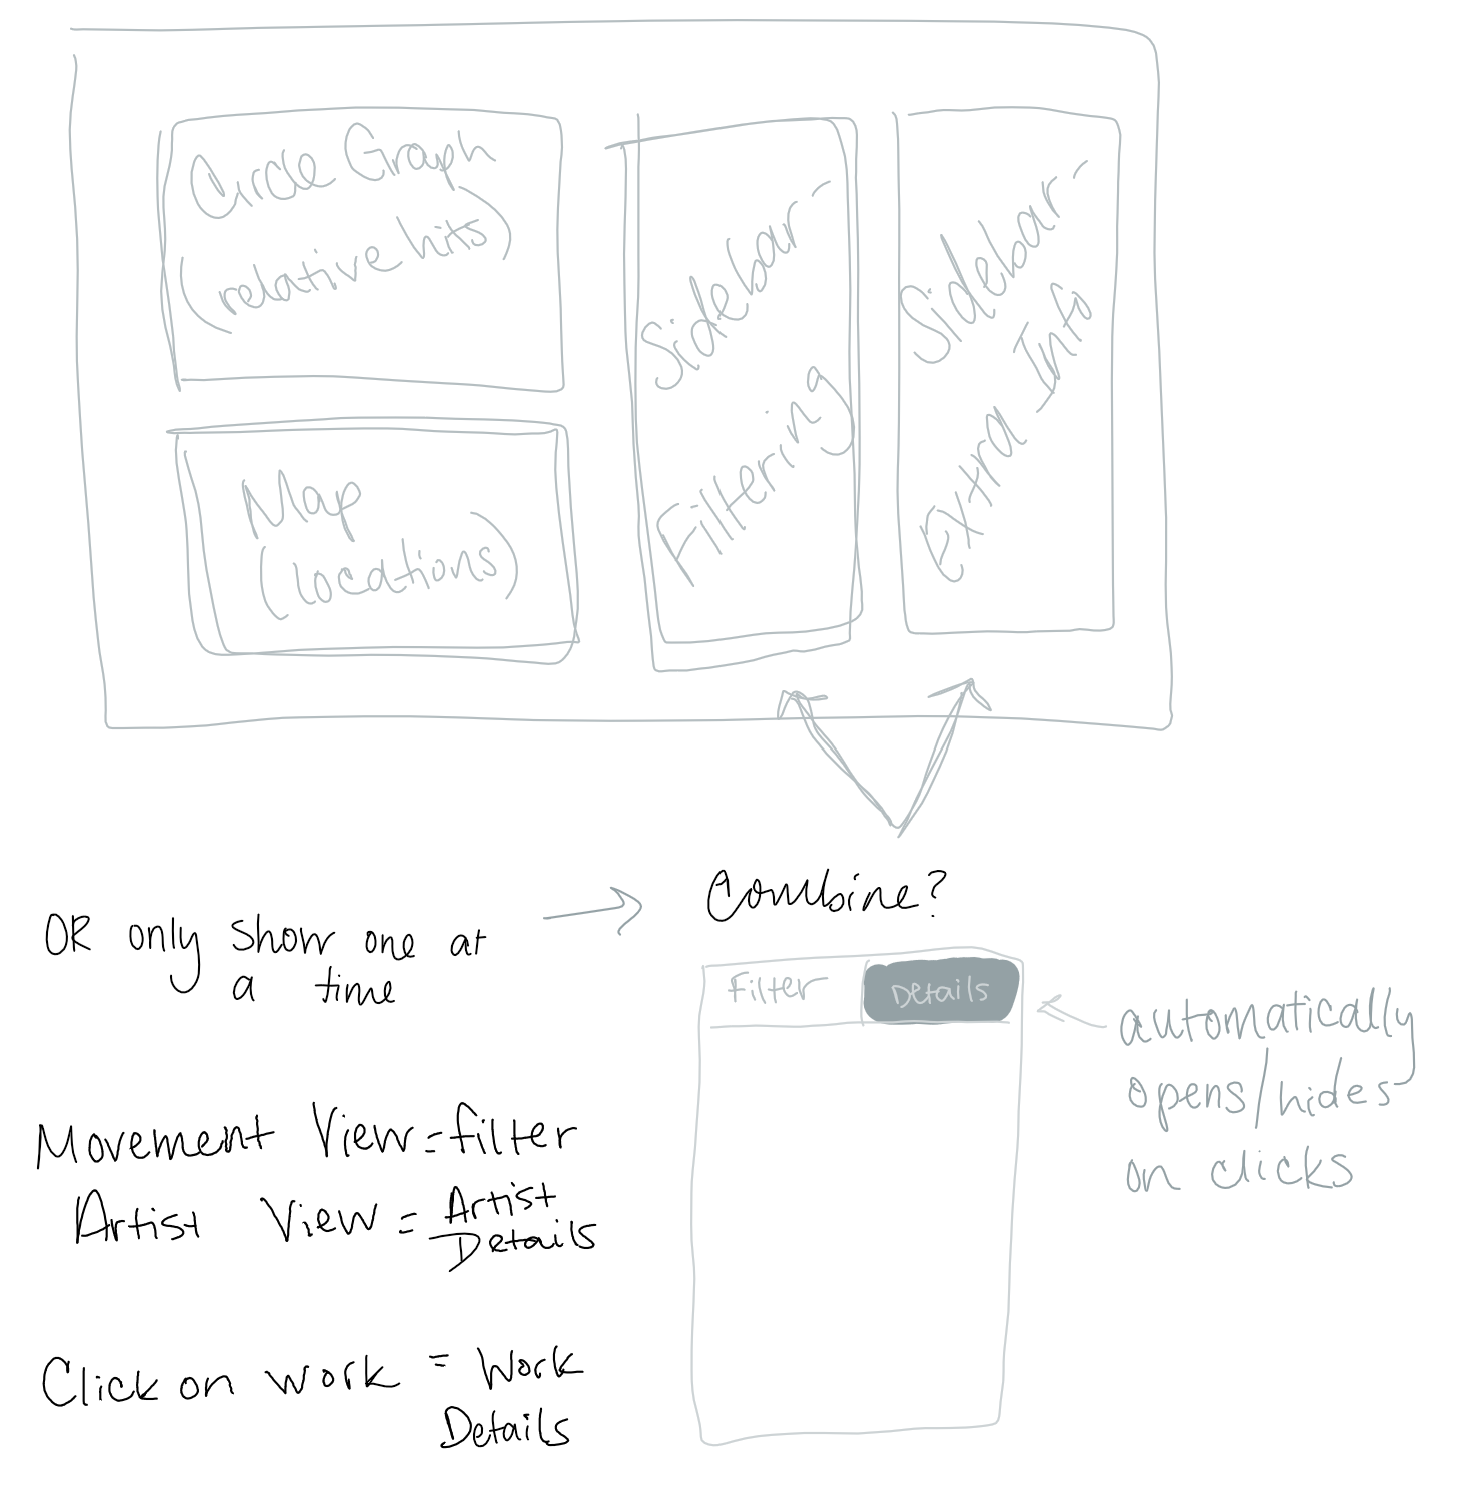
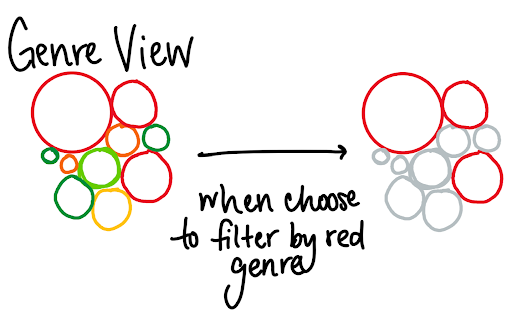
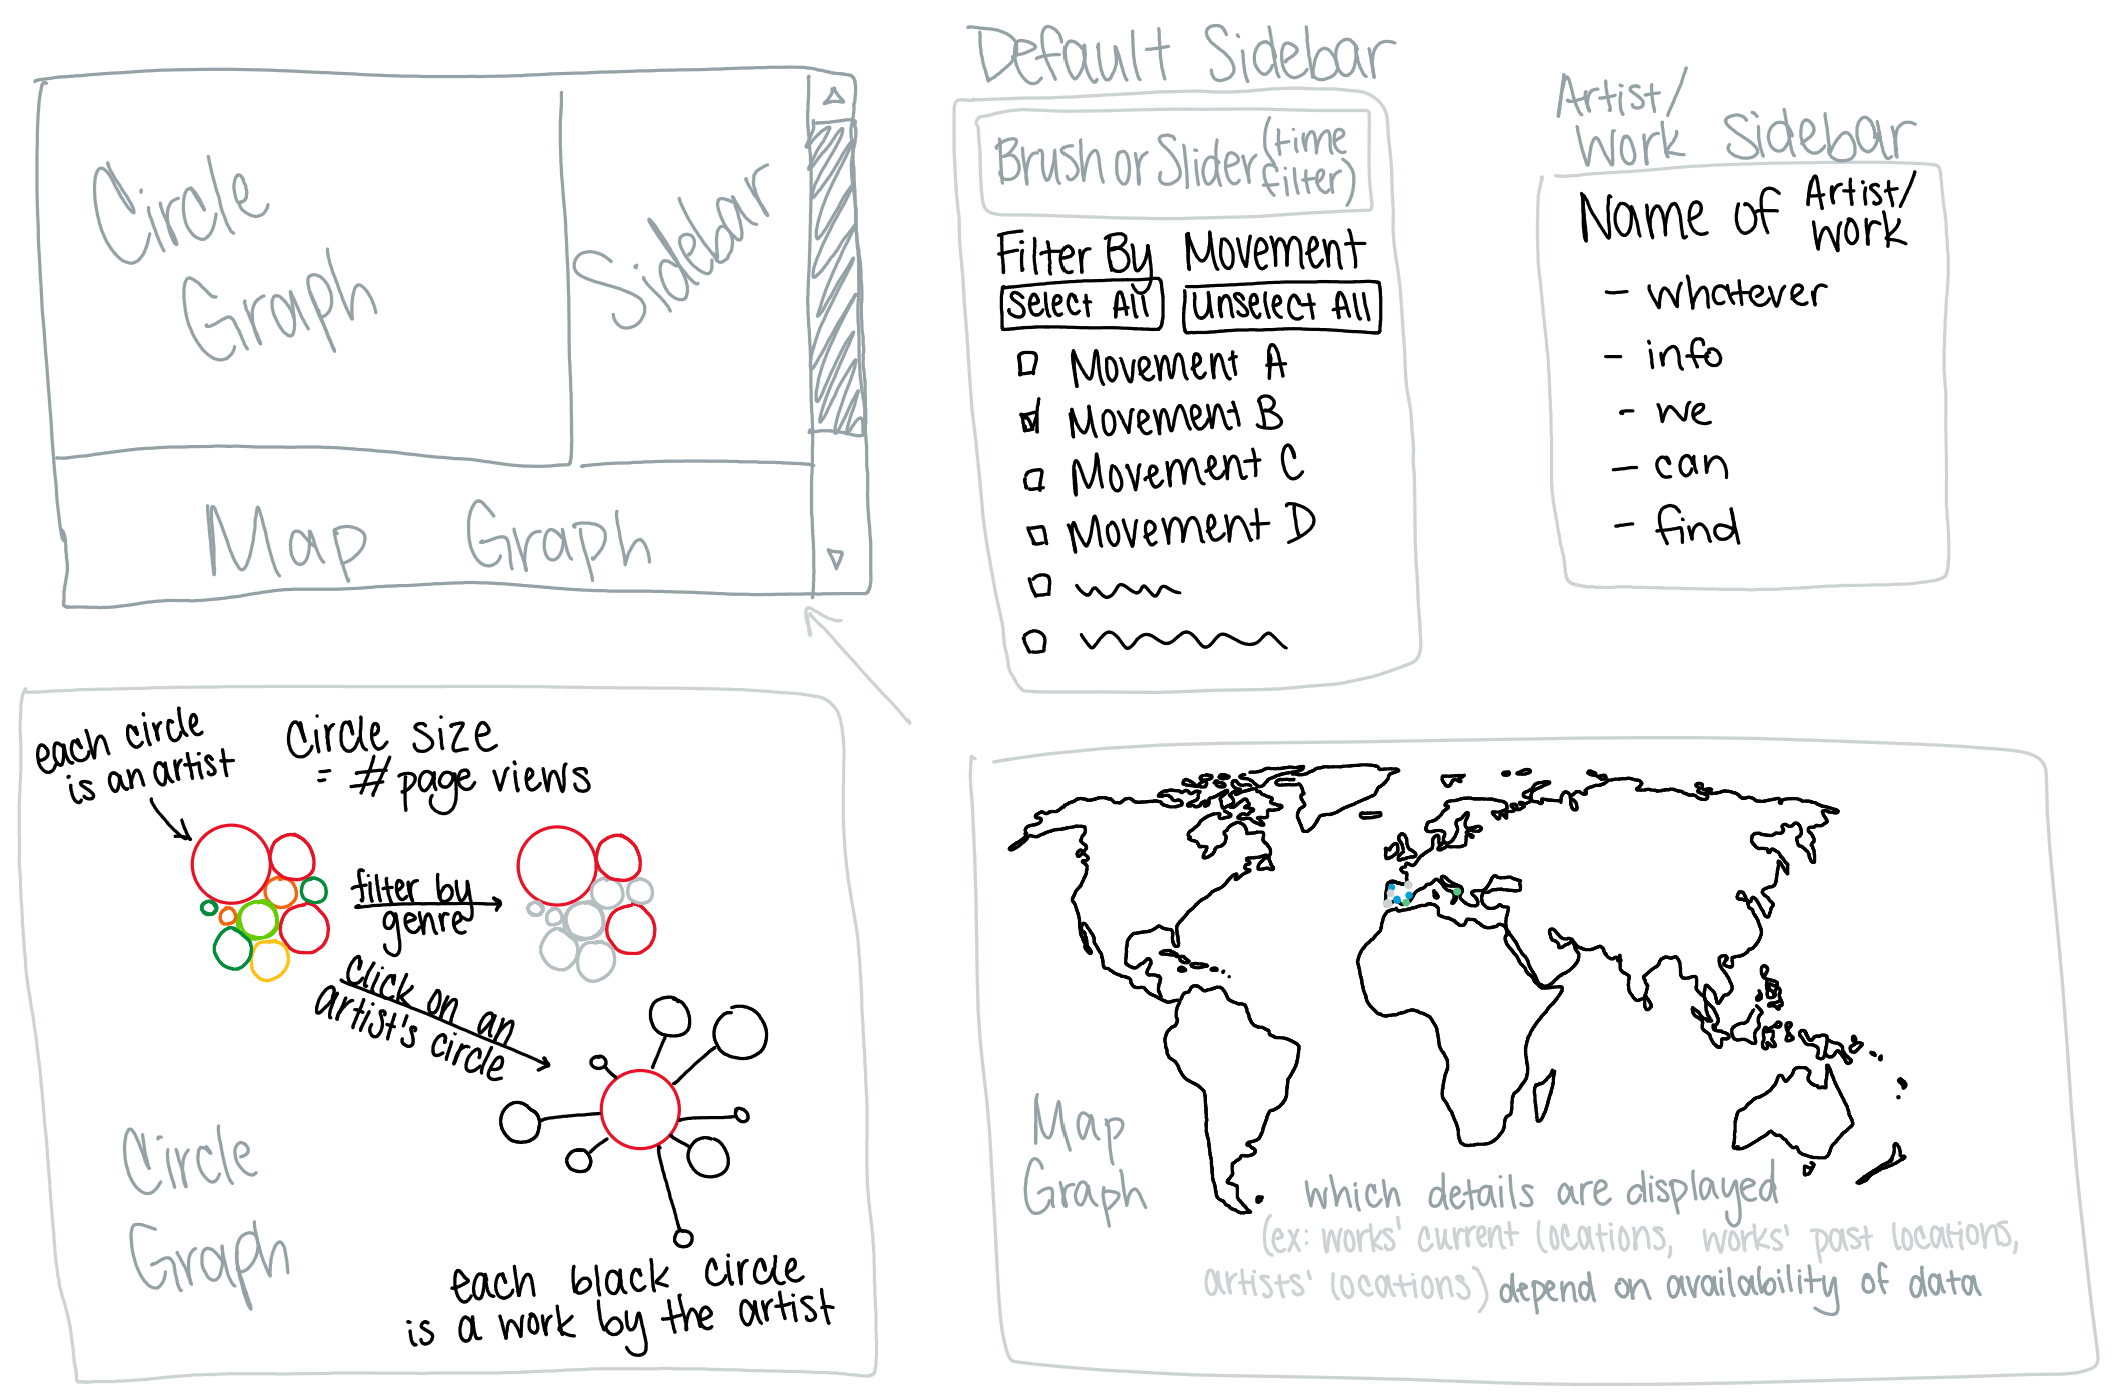
Initial Sketches
Final Sketch
We spent some time discussing project focus before settling on an art-focused visualization. We wanted our visualization to focus on something familiar and accessible to a wide group of people, while having real-world value beyond simply being interesting. Our first task was brainstorming and idea revision.
We started looking for interesting data sets. At first, we bounced around. Candidate topics included aggregate spending on space exploration, influential hip-hop songs, and immigration manifestos from Medieval Europe. All contenders had a similar issue—the data was out of reach. Some datasets were incomplete, others were inaccessible, and some were just not what they claimed to be. Many of the datasets that were accessible were rather narrow; the specificity of the dataset topic provided few ways of tearing that data apart and finding new insight. Data issues ruled out several topics.
Our first strong candidate was Wikipedia (hence the name of our project). The data that appears on Wikipedia is well-documented with data and literally encyclopaedic in scope. After discovering that Wikipedia provides free, no-auth APIs for a number of different data streams (e.g. edit history, page views, internal links, etc.), we felt confident that we'd find a good topic somewhere under the general umbrella of Wikipedia data.
We returned to our initial challenge: narrowing to a specific project topic. We selected visual art. Specifically, we're looking at paintings, frescos, and a few drawings. We all find this topic interesting and imagine the average user is familiar with it, even if they aren't an art expert. Many artists and paintings are well-documented on Wikipedia and can be grouped by creation date, by artist, or by current collection occupancy. Since visual art is built around a visual experience, we figured that users would enjoy an interactive tool build with visual elements.
In the time since we began this project, we have broadened our approach. Our focus on data from Wikipedia has expanded to include additional parallel data sources (most notably the Getty Institute described below). We also incorporated features to support additional use cases (outlined below). The initial goal—creating a visual tool for visual art—remains unchanged.
We intend our project to serve the following use cases:
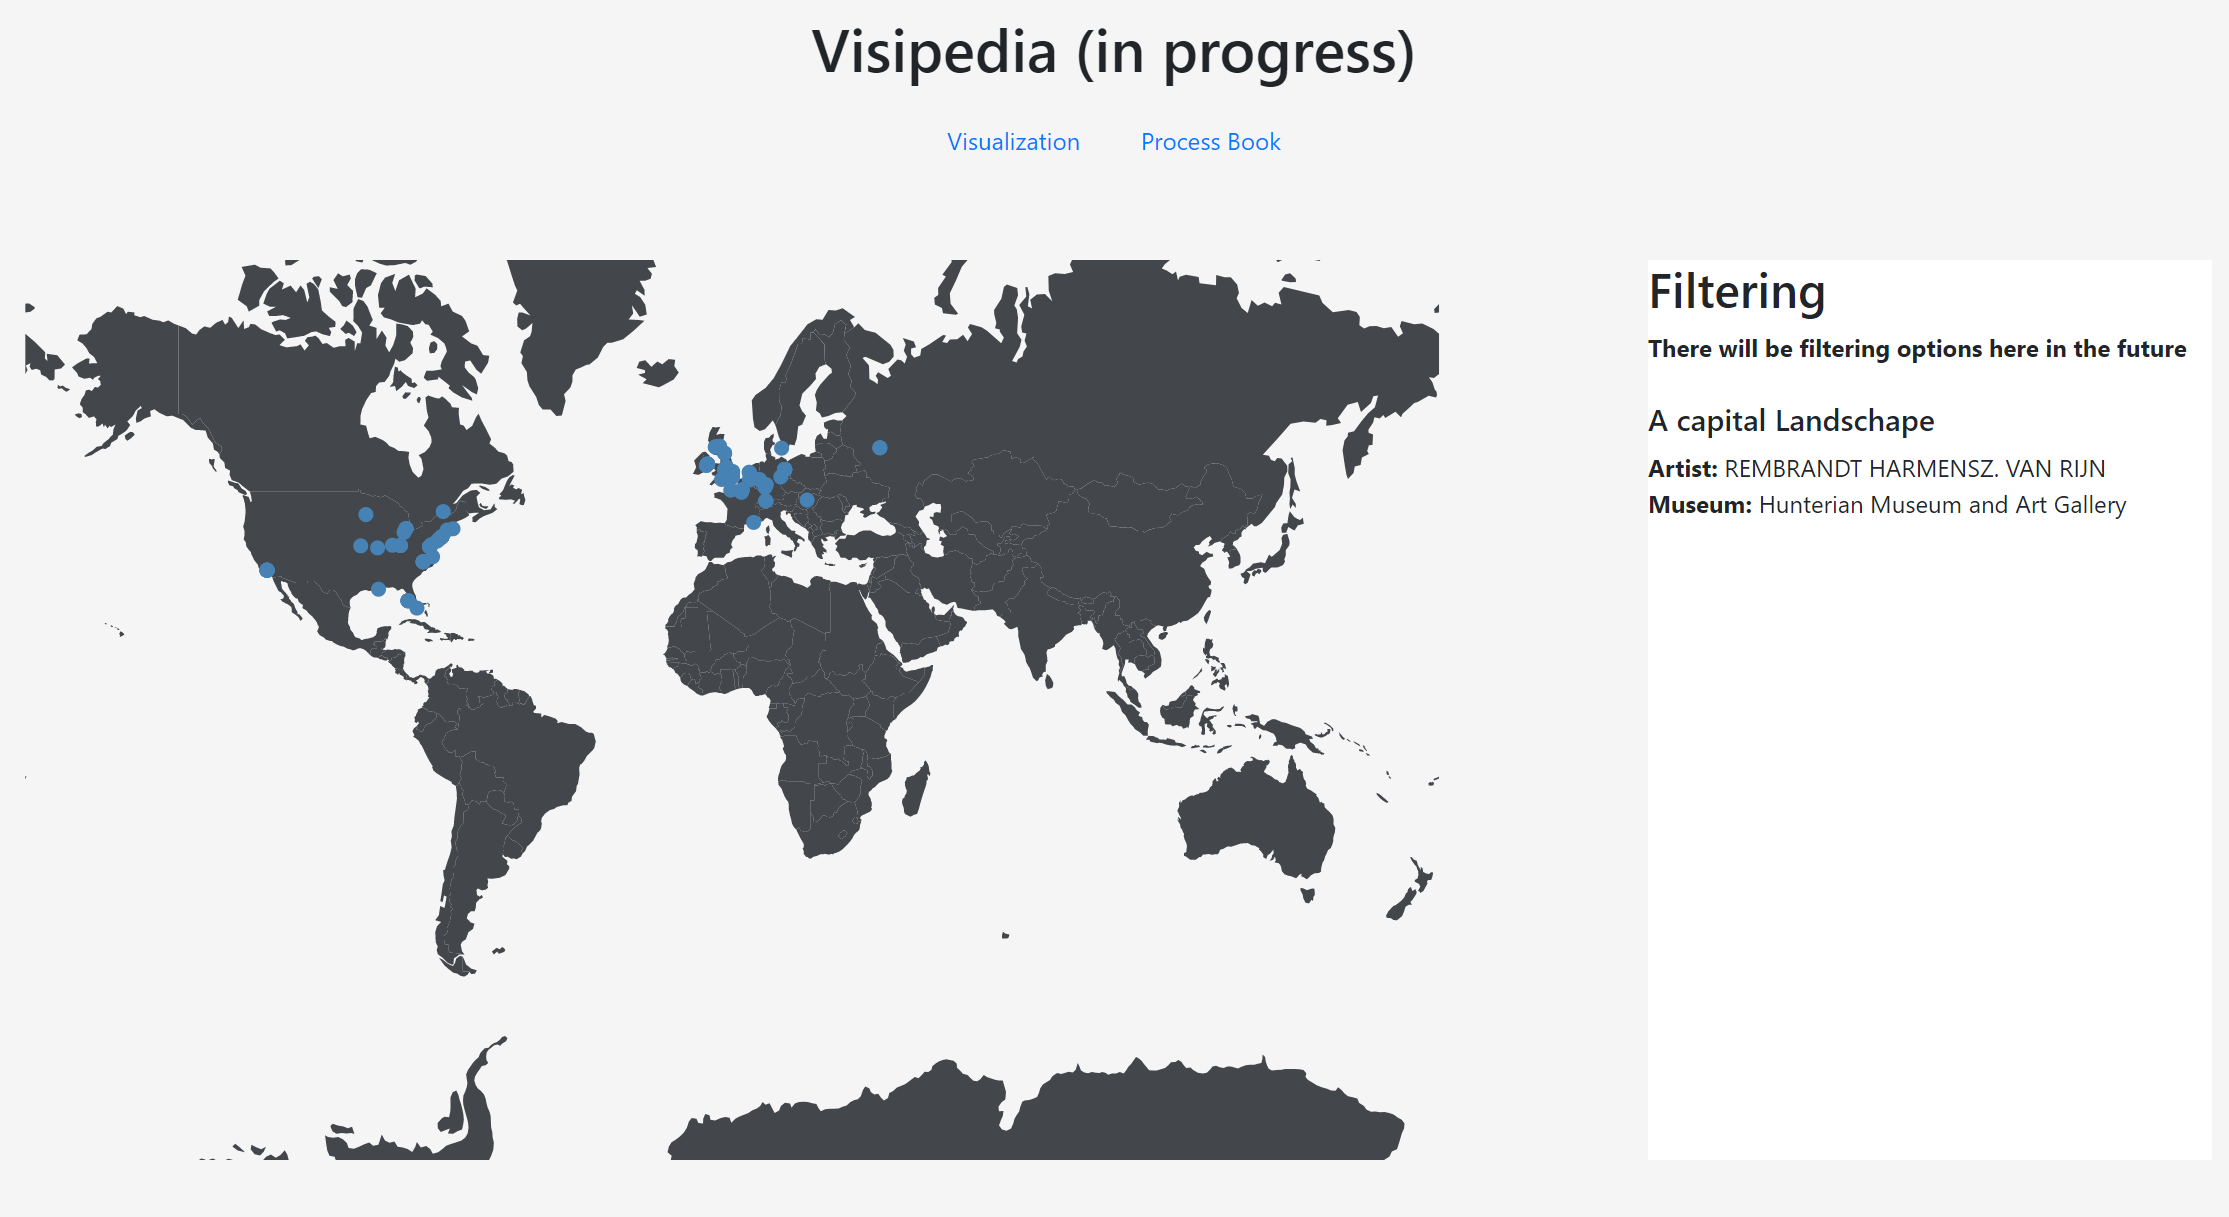
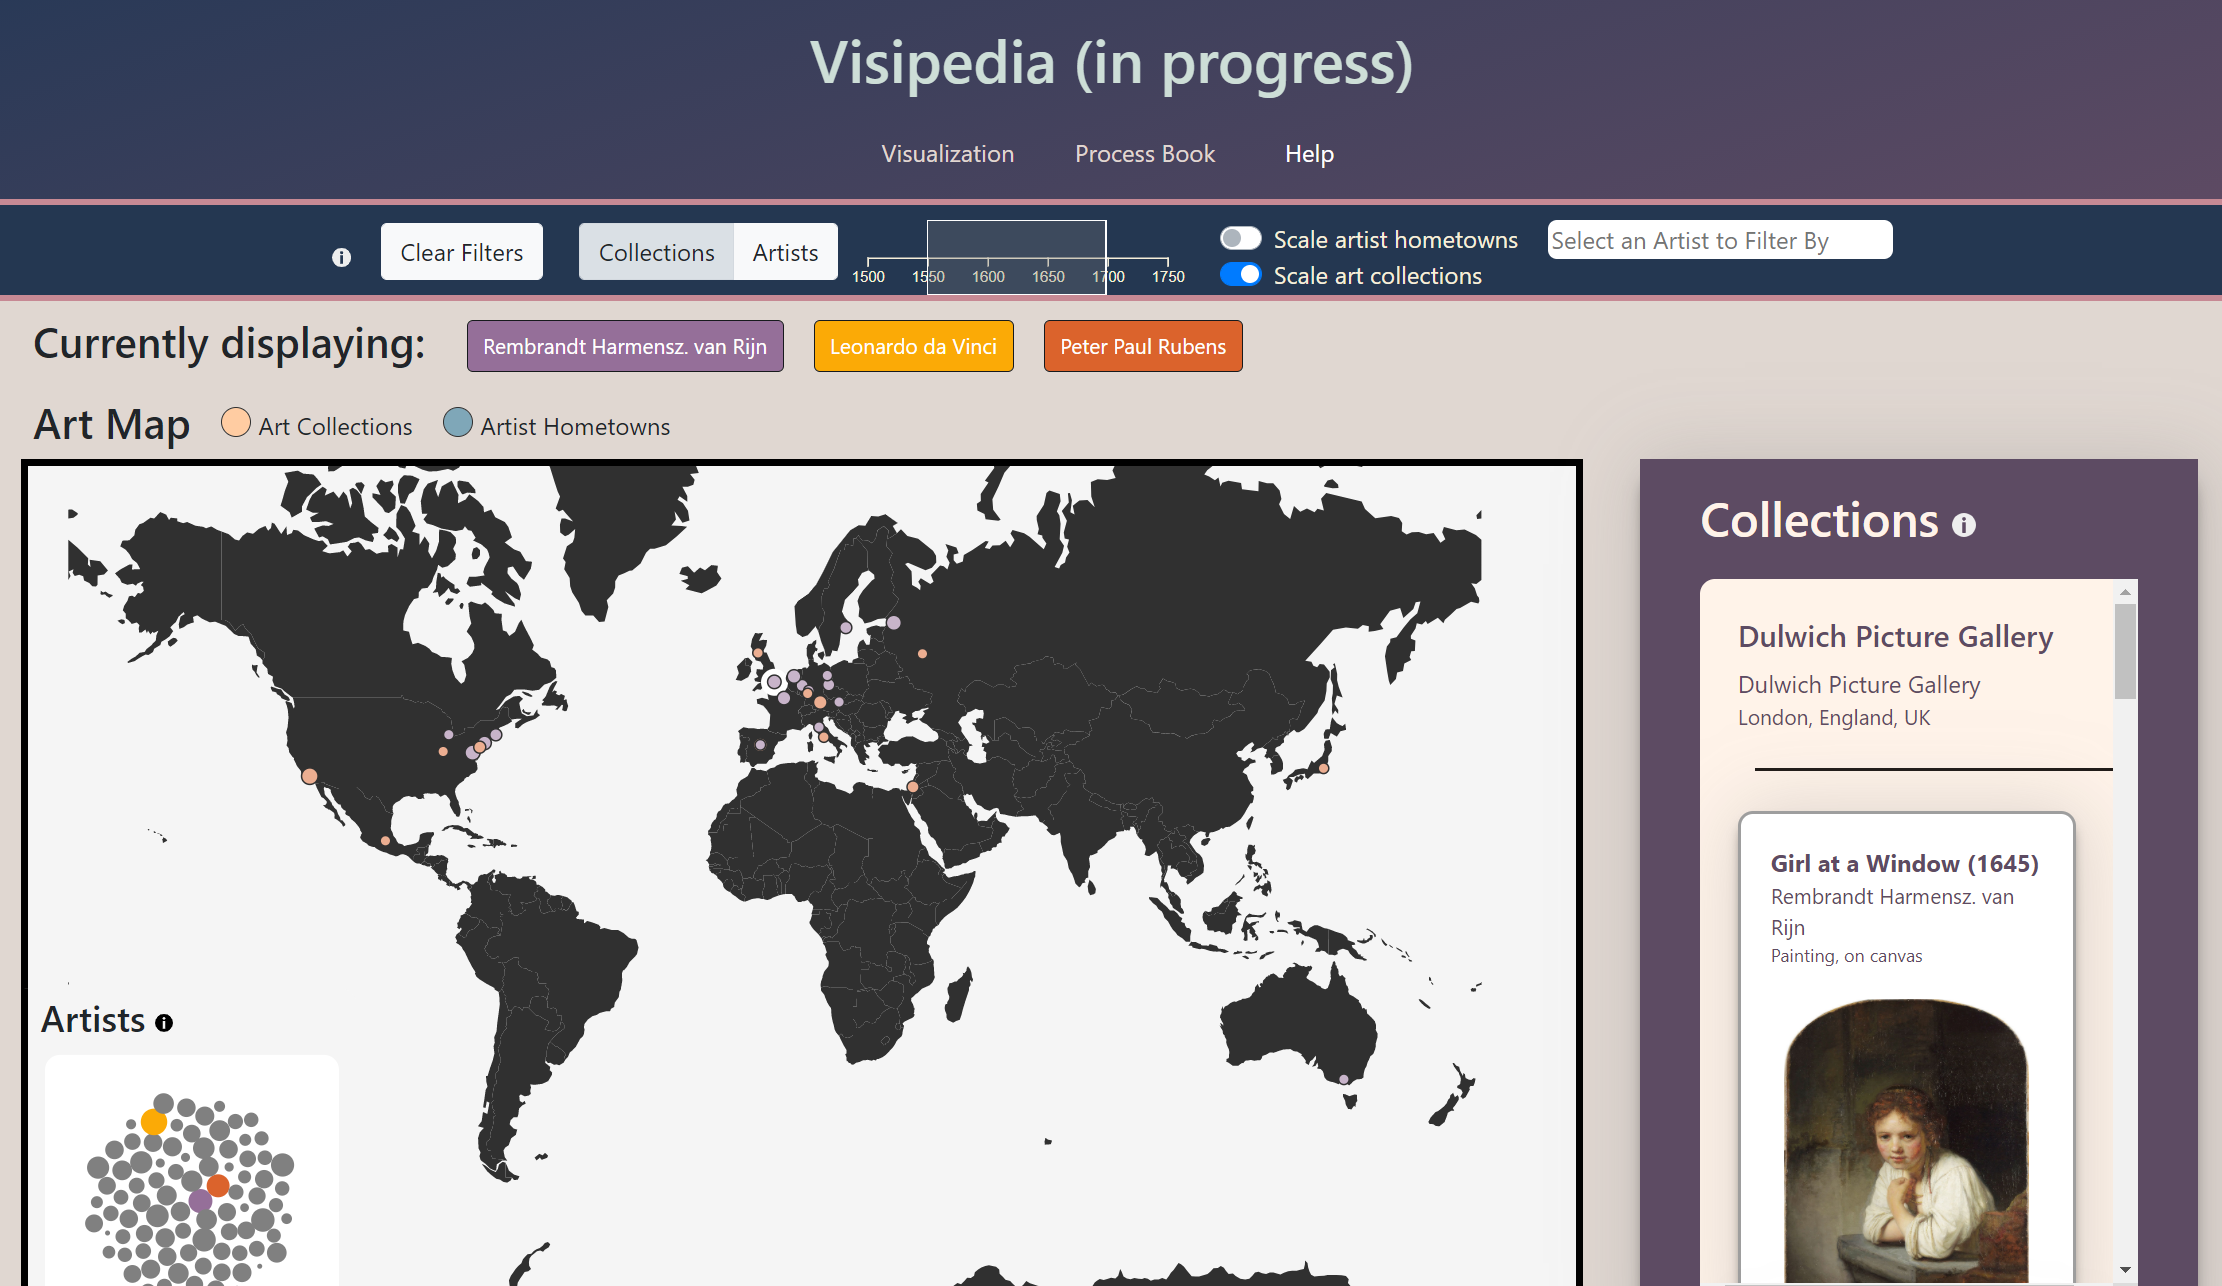
For the average person, we wanted our project to be a discovery and exploration tool. Accessibility and ease-of-use were our primary goals in service of this user group. We found that a clickable map best encouraged exploration of art museums. We chose to populate the sidebar with clickable 'cards' after identifying items like athletic trading cards as a functional proxy already familiar to most users. To retain attention and serve our goal of a visual-focused user experience, all artwork in our data-set includes an expandable image of that artwork. This required manually downloading, documenting, and citing over 400 works of art.
The final visualization requires no artistic expertise and is relatively simple to use. We simplified and expanded our feature set to make our user experience more intuitive after identifying pain-points during user testing. The features that remain ambiguous are supported with info-tips that explain how one can use them.
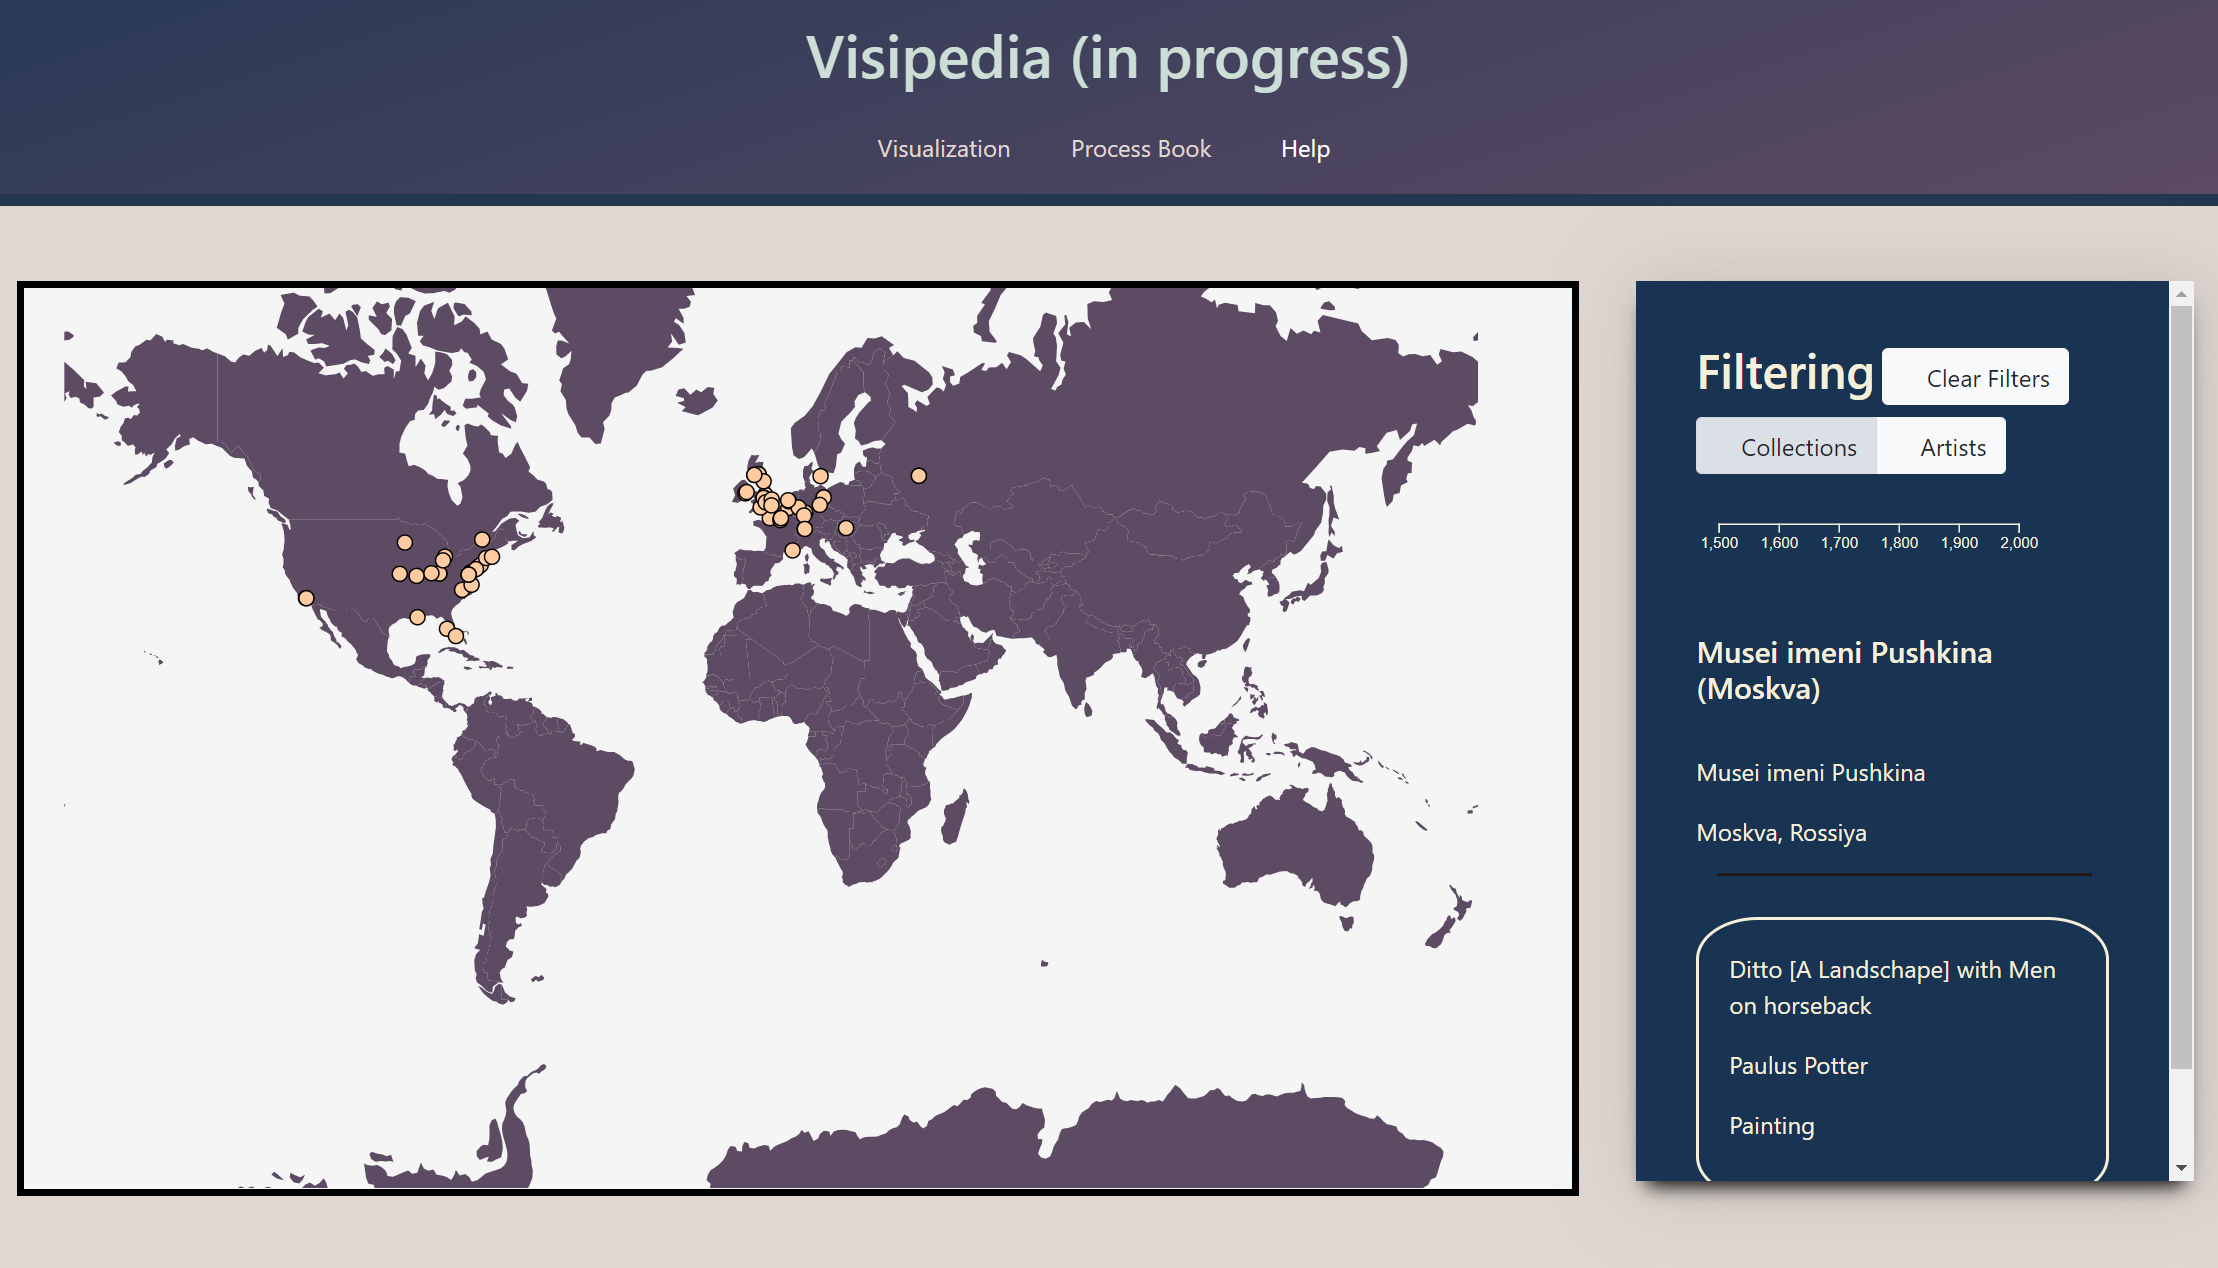
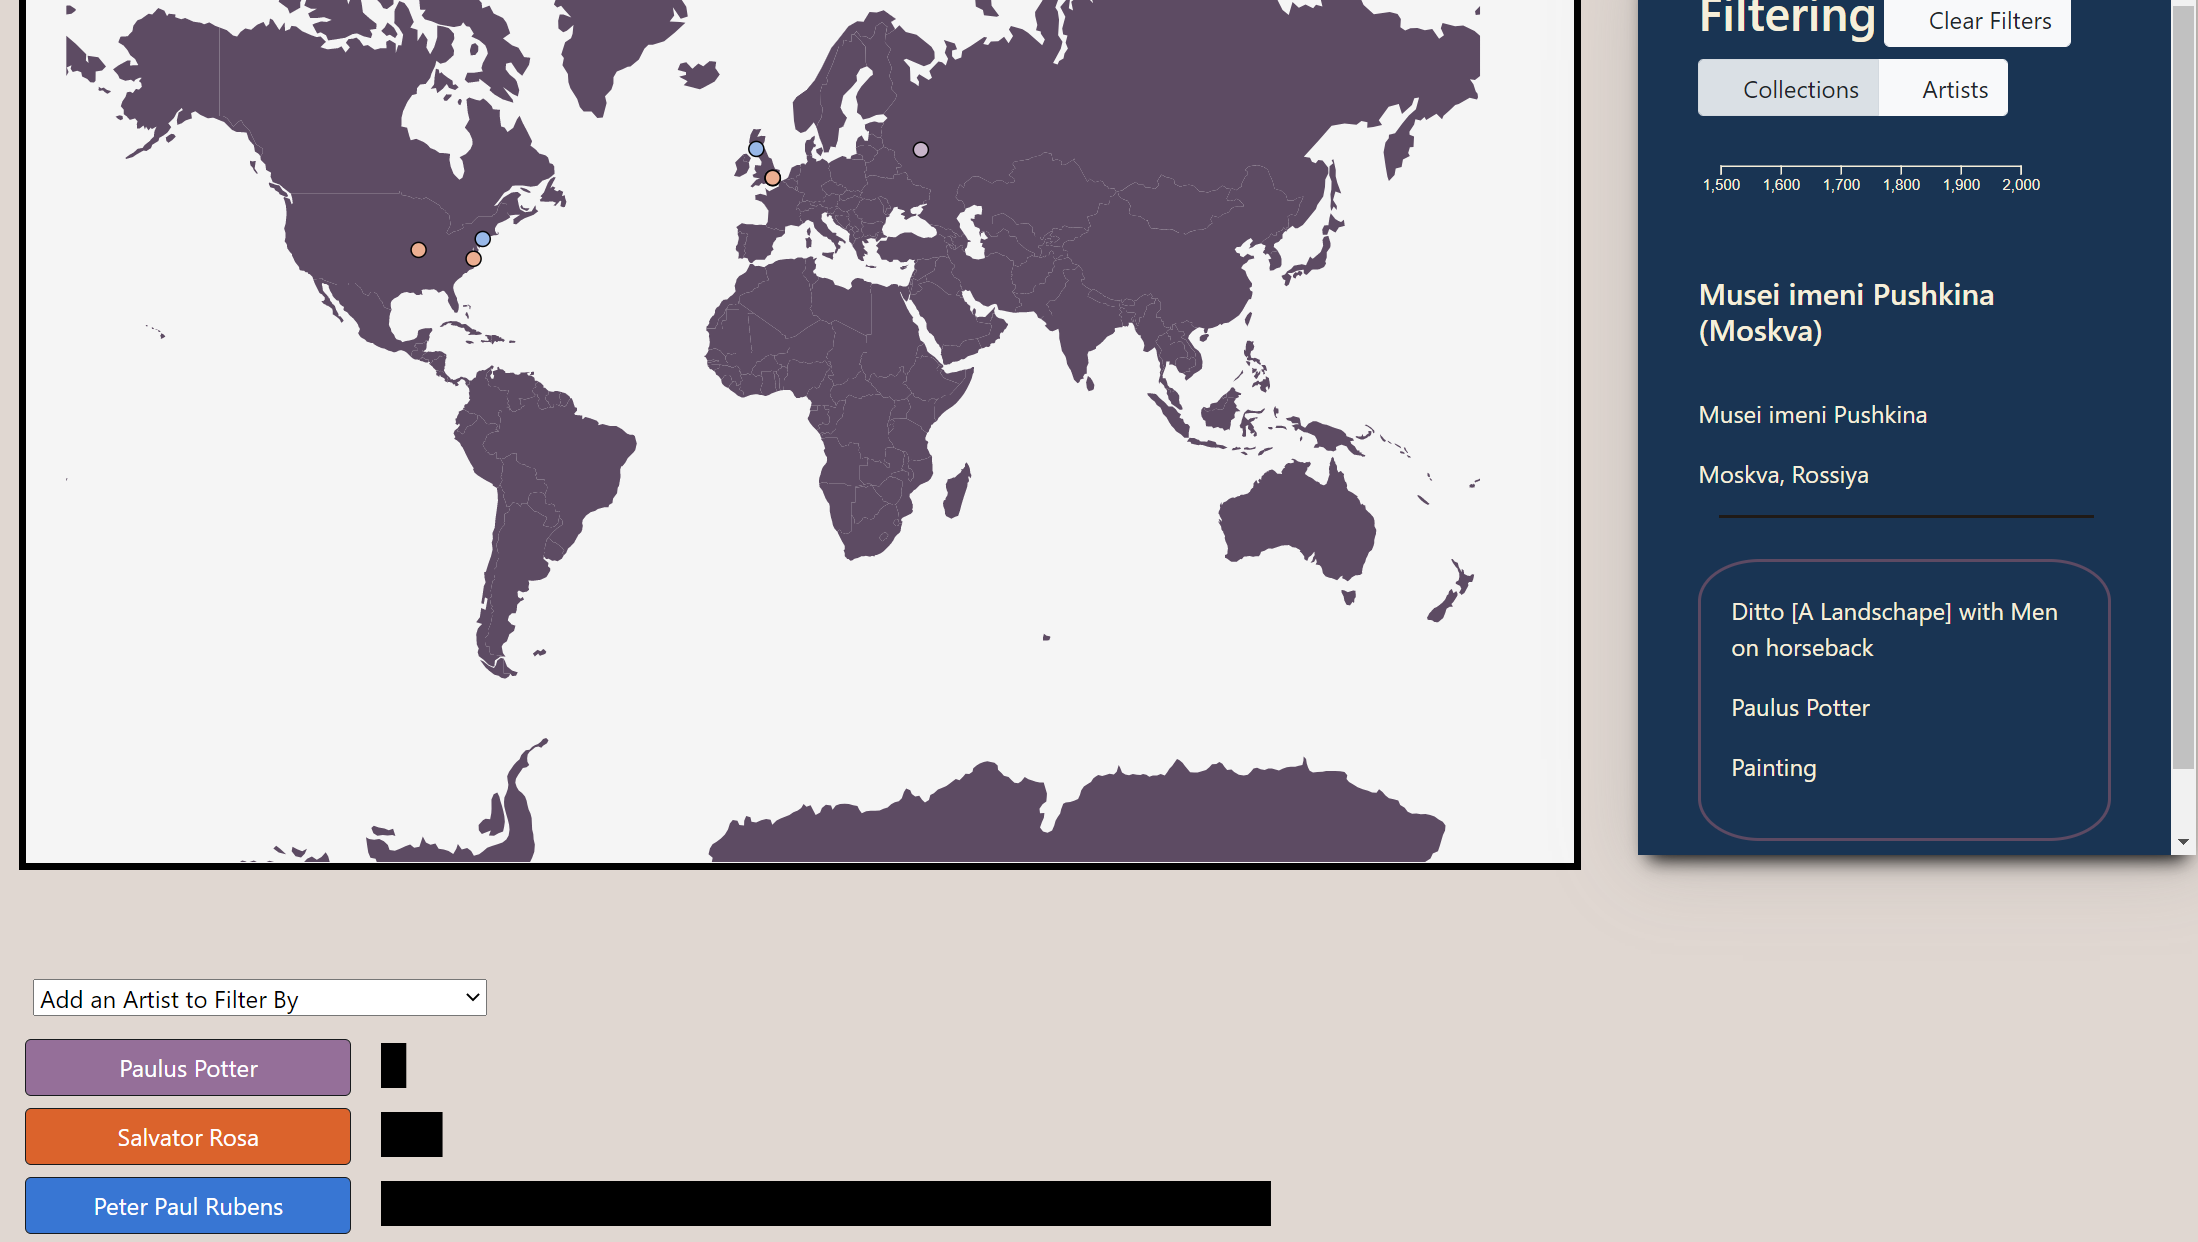
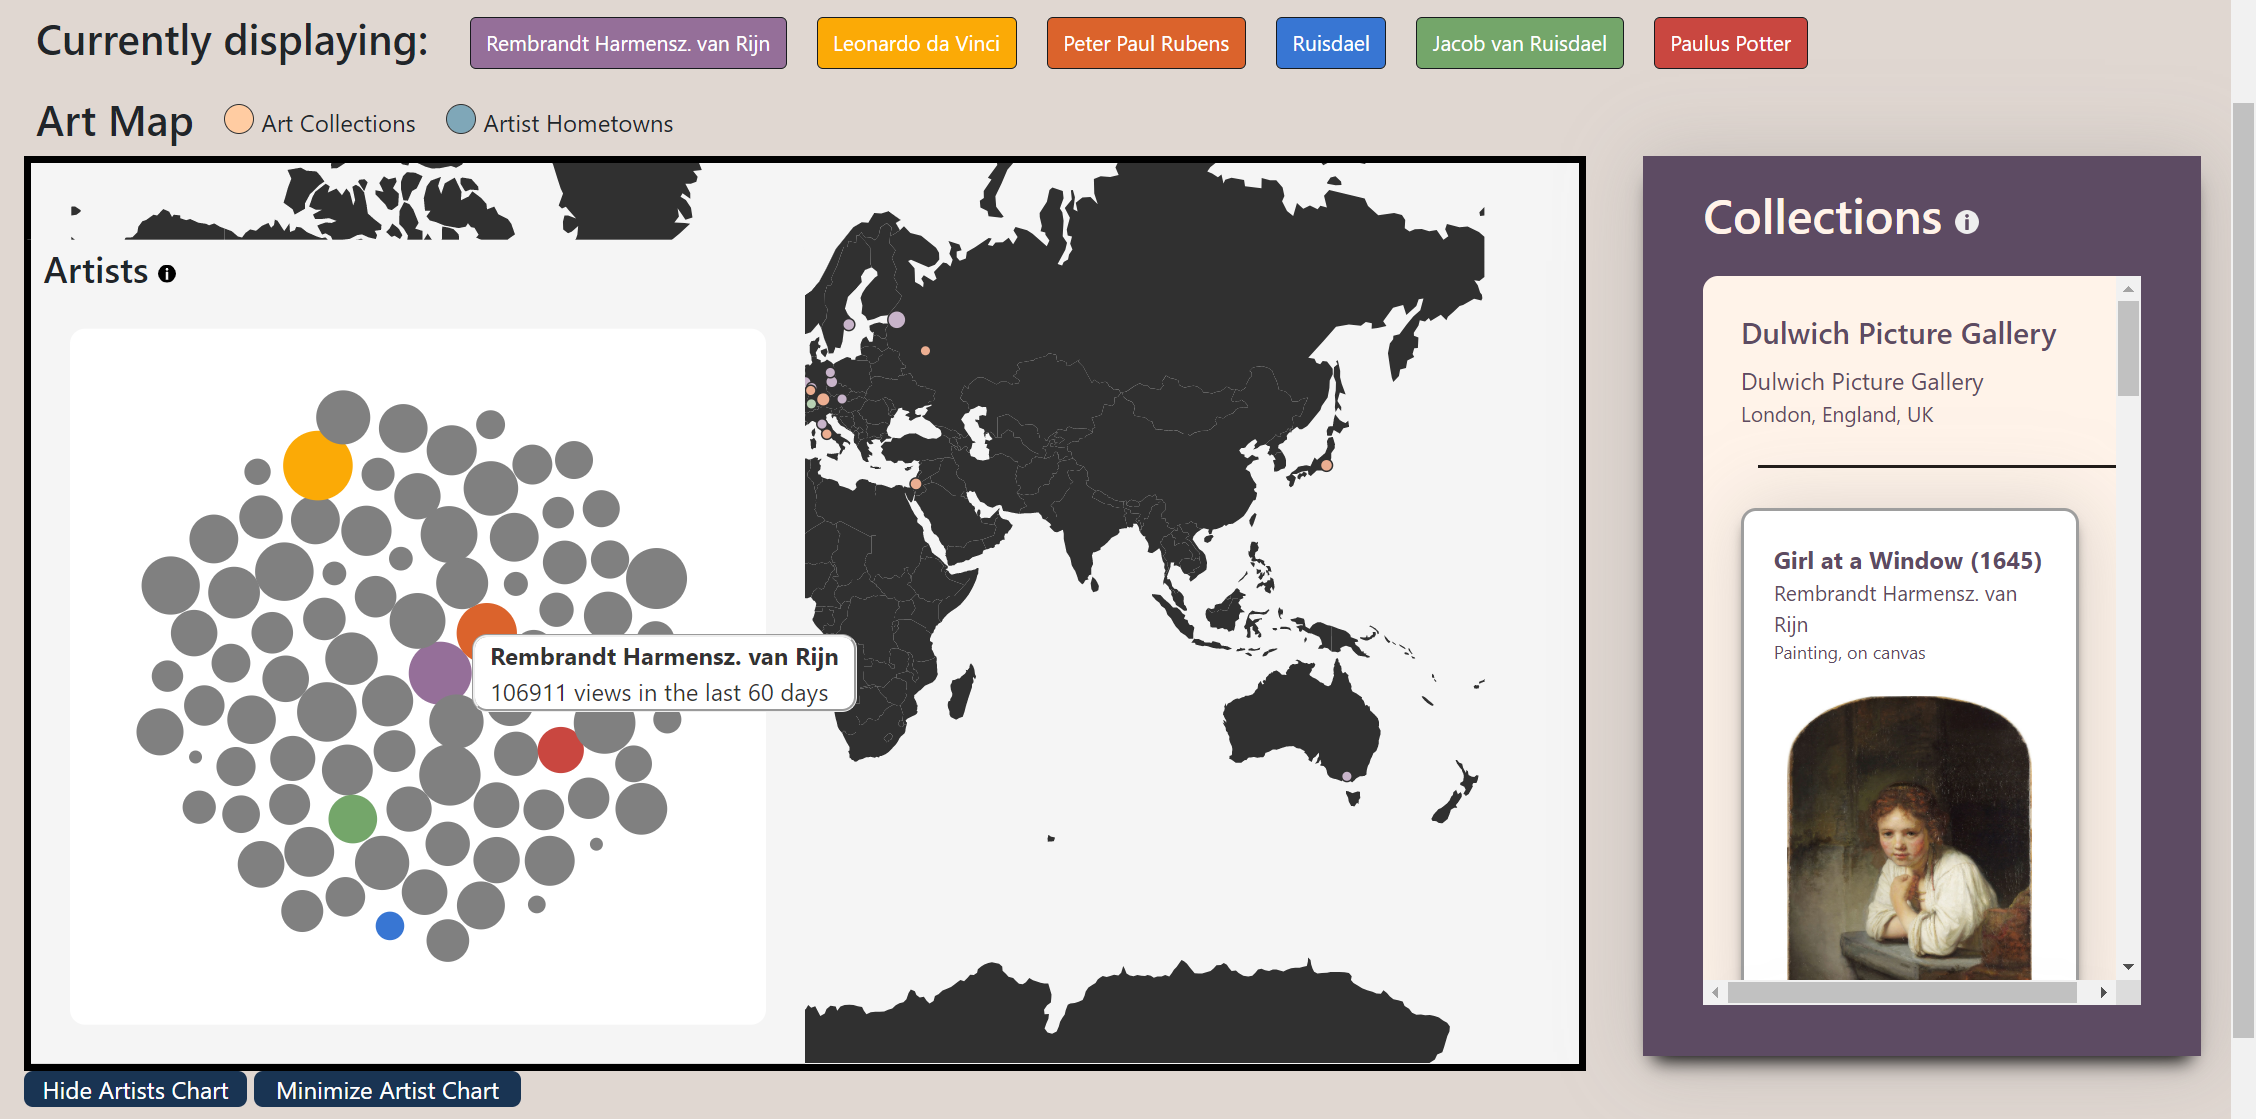
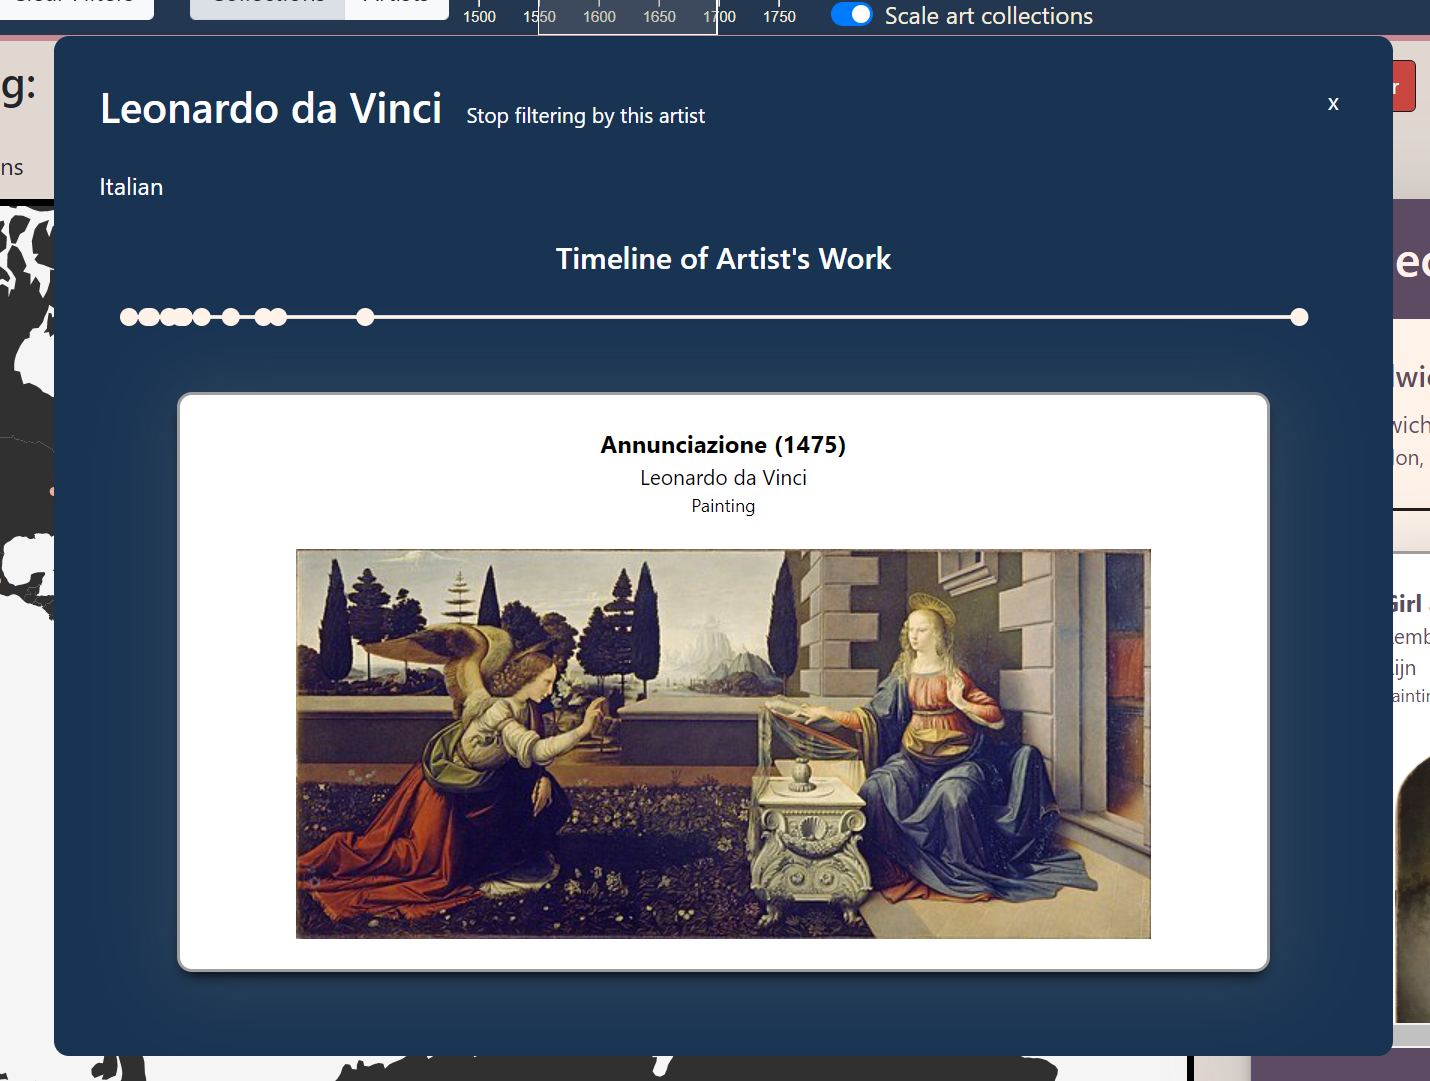
We built a large toolbox of features to serve users that want to narrow down their expoloration to focus on a few specific artists or locations. The artist timeline feature allows one to observe the evolution of one artist's practice over their career. The artist palette constrains the work displayed in collections to focus on as many as 10 selected artists at once and filters out cluttering work. The timeline brush allows users to filter art (from specific artists, or all artists) down to a subset created in the range of selected dates.
While art academics benefit from all of the features built for Users with Specific Interest, we also modified our project to support this group in specific. The ability to scale collections and artist hometowns by influence was included after speaking to art history experts who thought a way to judge the relative size of galleries included in our map was a crucial detail.
We extended this feature to artist hometowns after realising that a few towns in Renaissance Europe (e.g. Florence, Bologna, or Leiden) produced a large number of notable painters, many of whom were peers or contemporaries (this was especially common due to the highly localised manner of life present in Early Modern times). Take the Carraci family, for example: brothers Agostino and Annibale Carraci, with their cousin Ludovico, all borrowed techniques and themes from each other. Ultimately, their partnership led them to found the influential Accademia degli Incamminati and the Bolognese School of painting.
The ability to customize the Visipedia dataset is perhaps the most significant for this user group. Though labor-intensive to compile, our data is simple in structure. By changing one line of code, a user can include a new .CSV file of their choice (provided it is well-formatted). This means Visipedia can be re-adjusted to support any type of visual art, from Ancient Roman Sculpture to Impressionist painting to contemporary architecture. After talking to a few members of the art academia community, it seems that there is currently an unsatisfied desire for a visual reference tool like this. We hope to make our project an open-source and publicly accessible tool for those who might find academic use in it.
After receiving feedback from Mel, we decided to reprioritize; at Milestone 1 we decided tracing the physical locations of art pieces over time would be the primary theme of our project. The technical term for this concept is artistic "provenance."
This new goal came with challenges for our initial target databases. Wikipedia has plenty of information about art history, artistic influence, and current popularity (via page views and internal links). Unfortunately, very few works of art have "chain of ownership" information in their Wikipedia page. When information about provenance is included, it rarely comes with specific dates, locations, or durations. This, in addition to API access trouble from the major museums who might have that info, proved to be a concerning setback.
We found new sources for provenance information. After doing a little more digging, we learned that in the pre-digital age (especially 1800-1900), provenance was a critical part of determining if a piece of art was authentic. As a result, many major European art auction houses kept extensive provenance records for every piece sold in-auction. In principle, the compiled stockbooks of different dealers and auction houses should provide detailed chain of ownership back to the piece's creation.
Sadly, not every dealership and auction house (past and present) makes their provenance information available online. Those online are rarely complete. Thankfully, we discovered that the Getty Research Institute publishes free, .csv versions of several major provenance catalogs. These documents are long, somewhat incomplete, and of various formats—but we found a way to scrape out data that enables our pivot to a narrative-focused visualization of artwork history.
The relevant subset of the Getty dataset is a compilation of 9 .csv files, each composed of aggregated sales records from a given timeframe and a given time period (for example, art sold by major dealerships in Britain during the years 1780-1800). Timeframes generally span the 20th and 19th centuries. Countries included are major European art centers (the United Kingdom, France, Belgium, Austria, Germany, and the Netherlands). Each .csv has approximately 100,000 rows and around 400 columns.
By Milestone 2, the limitations of our location plan stood out in greater detail. We quickly realised we needed to map the creators of each artwork to geographic locations. This was a challenge. Many of our works were created by semi-obscure artists in a time period (1400-1600) when record-keeping was sporadic at best. As a result, it was near impossible to track how artists moved during their lifetimes. It was often difficult to determine where someone worked, studied, or produced a certain piece of art.
Given this challenge, we settled for the most reliably proven alternative: we tied artists to their geographic birthplace. Because most artists were active in a religious part of history, and because birth place is important for baptismal reasons in the Catholic and Protestant traditions, all included artists had a well-documented birth location. I describe how I compiled this data in the Milestone 2 portion of Data Transformations.
Shortly after Milestone 2, we realised many of the issues present in our geographic map came from data that was less robust than we anticipated. After inspecting a few entries in the Getty Institute's provenance data record, we realised that many of these entries were out of date. The geographic coordinates for many of the listed collections were incorrect. Some of the listed collections were private art collections that no longer existed. Cross-checking with Wikipedia and art museum websites showed that a good deal of the claimed current location information was incorrect. This was a major setback and highlighted how incomplete this area of academic research is. It was too late to change the topic or structure of our project, so we proceeded with a manual review and creation of our own data-set.
Our data-set now includes 418 pieces of art. Each artwork has a title, attributed artist, creation date, and current location (both name and geographic coordinates). Each artwork also has a locally downloaded .JPG image which is properly cited. Each artist in our data-set also has an entry including information on their birth date, style, and hometown (historic town name, current town name, and geographic coordinates). The majority of this information came from Wikipedia entries. Art images were often sourced on Wikimedia and confirmed in Art Museum websites. Geographic coordinates were obtained in minute-form from Wikipedia and translated into decimal form. Since this was a manual process, errors are our own fault. As far as we are aware, this is now an original data-set.
I used Python to analyze our original dataset, which consisted of very large .CSV files representing the catalog of art sales. I chose Python because I have a bit of experience using that language for string manipulation and data organization. I used the following libraries and tools for data manipulation and API work:
Below are the selected column values selected from the many columns originally included in the data set, each accompanied by a description for each column value. We selected columns that provided useful information for our purposes and ignored others. We have included a note regarding whether the rows of each type were always or only sometimes present in the data. State of the field final version noted in blue.
The datasets that we found, beyond the one described above, were extensive, non-uniform, and poorly organized. Poor datasets meant we could not pursue that provenance idea around which we originally based our project.
Originally, our visualization showed the current locations of artworks listed in one .csv file of our total dataset. We chose only those rows from our dataset with descriptions of current locations. This was done with the previously mentioned Python script, which generated a cleaned data file by opening a 100,000 row and 400 column .CSV, parsing through that file, sending requests to the Google Geocoding API, performing string manipulations, and sending requests to the Google Cloud Translate API. Data filtering in this manner was ultimately irrelevant. The Python scripts, though still included, can be ignored in the context have no baring on the final form of our project.
I used the Google Cloud Translate API to translate art titles to English. This was necessary because the .CSVs of art sales in France, Belgium, the Netherlands, Austria, and Germany had titles in native languages, rather than English. All titles are now represented in English.
I used the Google Geocoding API generate latitude and longitude information from the "present_loc_geog" and "present_loc_inst" records included in our selected data sets.
Compiling birth locations and other artist-related data was a labor-intensive process. First, we revised our data structure for artists. When the "artists" mode is active in our visualization, artists are grouped by birth city. To build artistLocation.json, I manually went through our list of artists and repeated the same process for each one:
At this point in our project, we modified our Python script that created our .CSV files. This involved helper functions to create standardized IDs earlier in our process of data wrangling. There were challenges that came from this (not all artist names followed a similar convention, especially since artists came from different cultures and language groups). This attempt to salvage the integrity of our .CSV files was ultimately fruitless.
Our filtering feature was another Milestone 2 development related to data transformation. The basic concept at play here is simple; when the users click on an artist or artwork card, the artist corresponding to that card is added to an array of selected artists. The circles displayed on our map are filtered to only include the city where a selected artist was born and the collections where the selected artist's work now resides. Despite this simple idea, implementing this feature was an iterative process that overcame several challenges.
Our first issue was in organization. The nature of our data, and the multilingual names involved in our data, meant that there were often several versions of a single artist's name in our original data set (remember, I translated our CSV data to English using the Google Translate API). We had to manually review each of the artist names to look for duplicates, then build a "pseudonym dictionary" that standardized the names of artists with multiple attributed titles. We also had to change our code to make sure we were referring to different records via a standardized key: this appears as "artistID" in our code and is usually calculated from the art_authority_1 field in our dataset.
The next task was applying the artist filter to different types of data. Artist and collection objects are structured differently in our code, but both were filtered by the artistID field that their daughter elements contained. After working this issue out, our visualization successfully showed a filtered artist in blue and only the collections containing that artists work in cream. However, a user was unable to add more artists to the filter list. To fix this, we changed the logic that rendered our visualization to be more conditional and added a toggle bar of buttons. Now, a user can apply a filter and then choose to redisplay the non-filtered collections and artists. This allows you to filter by entire sets of artists at once, rather than by just one. We also added a clear filters button so you can go back to an unfiltered set of artists, if you desire.
Allowing users to filter by multiple artists at once produced a new issue; it was hard to tell what collections corresponded to each artist. We addressed this by building an "palette." Now, users can filter by up to 10 artists at once. Each artist is displayed in a unique color, and the collections housing their work is displayed in a second, related color.
Following a complete manual review of our data set, described in Data Sources, all transformations related to cleaning and preparing the data were no longer relevant. Transformations involved in filtering and search features were still relevant. We improved these features for final turn-in.
Our feedback for Milestone 2 inspired us in guiding our features and focus, particularly in reimagining the user experience and how to convey relative popularity of artists. As recommended, we looked back at our initial sketches, and we realized we preferred the bubble chart over the bar chart for describing artist popularity. The bubble chart, while not as accurate in terms of visually comparing sizes, has the added benefit of fitting all artists in a smaller area and allows us to display all artists at once. Since we made a conscious effort from the beginning to keep our project very modular, we were able to use the same function we had already written for retrieving an artist's page view count. By storing this information, we only had to make one call per artist rather than making a new call every time we needed the information.
We also took into account usability, making several changes such as moving our filters to the top of the page, as recommended. We also changed the dropdown filter to work both as a dropdown and as a search, which makes it easier for the use-case of a person who knows they want to focus on a particular artist.
Our most striking insight about our data regards the state of art databases. Given our experience with art as a well-documented subject, both in museums and online, we all thought of art as subject rich in existing data. That was not the case. There are few to none robust and high-quality databases about Renaissance and Baroque artwork online. Our promising leads were underwhelming in respect to completeness and accuracy. We don't know why this is the case (perhaps because it is difficult to monetize public information of this source, or perhaps because high-quality databases are private to museums or academic institutions). We think a good-quality database of this information is needed.
In the process of cleaning and preparing our data, we learned a lot about the dominant themes and motifs in Renaissance and Baroque art. It was interesting to see how these themes changed and adapted as the Renaissance emerged, peaked and bled into the Baroque period. For example, late Gothic depictions of Catholic saints become less frequent as the emergent Renaissance ushers in a new era of portraiture and scenes from classical mythology. However, as the Counter-Reformation begins, Baroque art brings back a surge of biblical scenes (alongside a strong showing of secular work). Techniques and styles that are first seen in Renaissance works can now be seen in these Baroque pieces, adding a new sense of drama to traditional religious scenes. We saw this clearly as we downloaded each picture, and hope that our filtering features and visual components allow users to discover similar ideas through their exploration of our data.
Geographic data also provided new insights. It was interesting to what artists overlapped in hometown and working area. One may presume these prominent figures knew each other and influenced each other's work. This would be a fascinating area to explore, if records and documents supporting such relationships could be identified. This is definitely beyond the scope of this project.
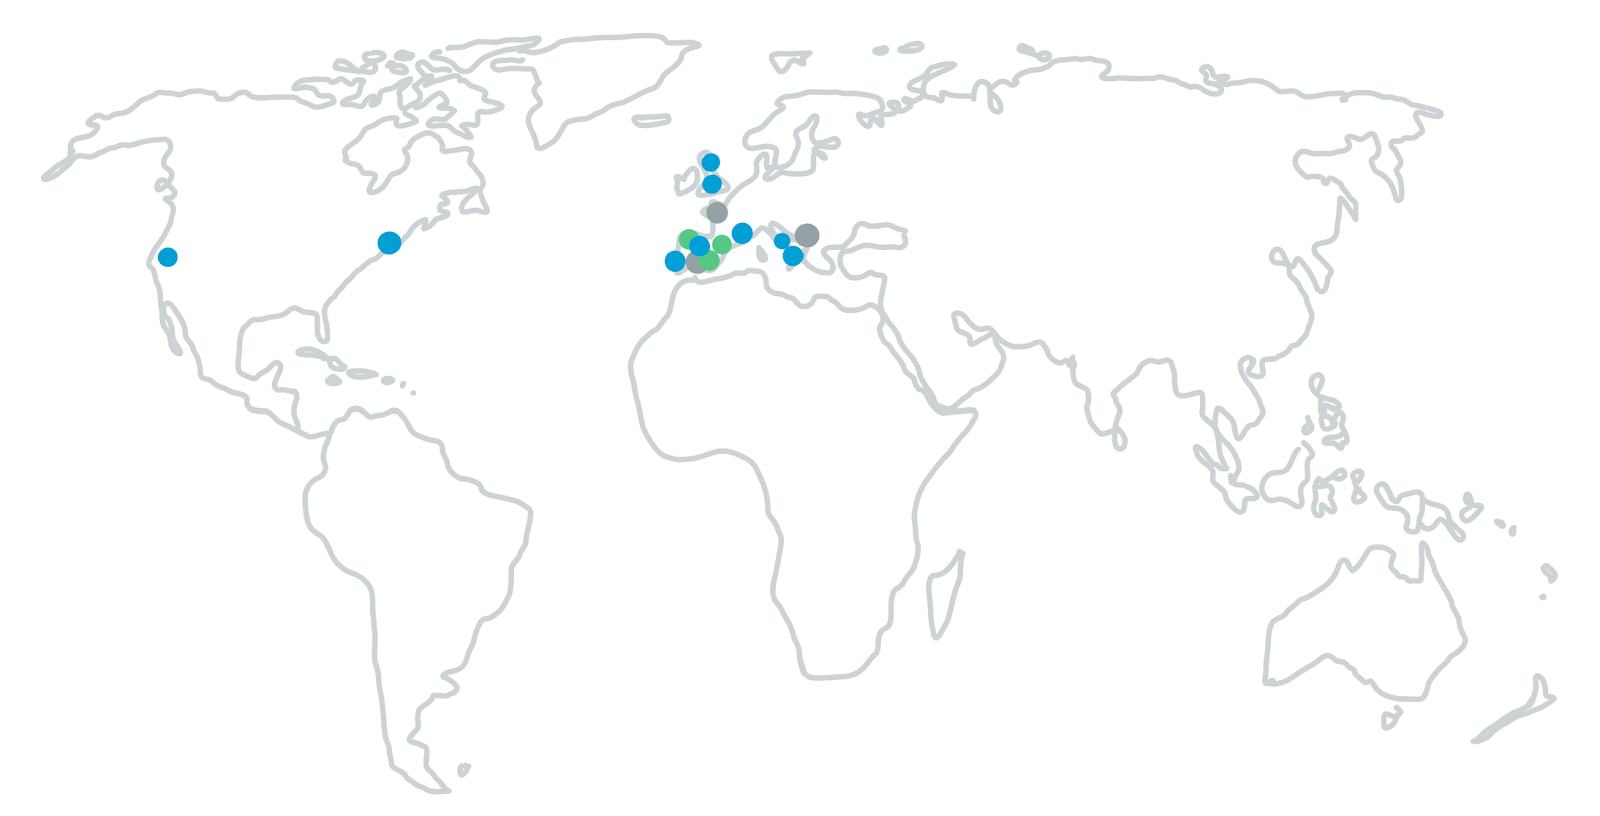
The geographic distribution of collections is also interesting. Though our data set is far from complete, it seems to be the case that the majority of Western art from the Baroque and Renaissance periods remains in Western Europe. A sizeable amount now exists in the United States, with other developed countries like Australia, Japan, and Israel also having sizeable collections. A good deal of interesting stories about provenence lurk in this data. Although our project does not attempt to describe the causes for the locations for these artworks, we hope our visualization may inspire users to make their own research and discover stories such as how a good portion of the Israel Museum's collection comes from Jewish families that left Europe after World War II. If art is a window into history, our data is only the tip of the iceberg.
We are confident that our project provides an accurate and accessible tool to explore and compare art. We started with the goal of telling a story about art ownership, but found that the data publicly present in this discipline did not support that goal. We pivoted and created a product that resembles a living catalog or reference book. By manually assembling a data set and building several features to allow for exploration of that data, we hope to give users the ability to find their own story.
We believe we have made great strides since our Milestone 2 submission, both in terms of collecting additional data and in presenting the data in a user-friendly way. We incorporated the feedback we received to improve the user experience, fleshing out filtering and clarifying ways to use our interface, along with fully reimagining how to display selected artists and all artists' popularity. By recentering our focus on the user experience and putting in the extensive time necessary to organize the data, we were able to make a much stronger visualization.
We think this project has value beyond this assignment. With more time and assets, we would like to improve Visipedia in the following ways: