Women and Wages
Examining the Gender Pay Gap in the United States
Basic Info
Team Name: Coder Bros
Team Members: Ana Boyer, Haley Berg, Kriti Bhattarai
Github Repo Link: https://github.com/washuvis/paygap
Video Link: https://www.youtube.com/watch?v=DVje5SlQ28o&feature=youtu.be
Overview
Gender pay gap is persistent in the United States
and all across the world. Women, especially
women of color, are the ones most affected by pay discrimination. It is prominent in all areas of
occupations and across every nation. Closing the gender pay gap takes lots of efforts from
individuals and policymakers. This project will be an effort from our side to visualize the pay
gap.
As three women in stem, we are highly invested in
understanding more about the gender pay
gap in the US. Our team name, "Coder Bros", exemplifies one of the many cultures of masculinity
in the tech world. Understanding the pay gap, especially along the lines of race and education,
is crucial to close it further.
Project Objectives
Our goal for this project is to visualize income
of men and women, and how it compares to their
race and education.
We wanted our visualizations to effectively allow
users to answer the following questions:
- How much more do men make than women?
- How does the amount of money men and women make relate to race?
- How does women's education level relate to the wage gap between men and women?
- How much more do men make than women of the same race?
- How does each state differ in how educated women are and how much they earn?
- How has the wage gap changed over time between men and women and different races?
- How many women hold executive positions?
- How many minorities hold executive positions?
- How do female executive’s income compare to men’s?
Data
We decided to visualize the datasets available
from the United States Department of Labor because this was the most comprehensive dataset in terms of amount of
information available about
education ad wages by gender and race across the United States. Unfortunately,
the most recent point at which the data was gathered was in 2013; nonetheless, we still believe this dataset
effectively represents the paygaps that continues to exist in the United States. Links
to the dataset resources can be found here: https://statusofwomendata.org/explore-the-data/download-the-data/ and
https://www.dol.gov/wb/stats/NEWSTATS/facts/median_an_earn_sex_race_hisp_2016_txt.html
We also decided to incorporate information about
top earning CEOs in the United States because we felt it added an added an additional element that would be of
intrest in demonstrating not only the
discrepancies in how much people make, but also in how many hold executive positions.
https://www.equilar.com/reports/11-2014-equilar-top-200-highest-paid-ceo-rankings.html and
https://www.equilar.com/reports/49-equilar-200-ranking-the-largest-ceo-pay-pakages-2017.html
Data Processing
We did not do extensive data cleanup for this
project; there were only alterations made for one of the datasets obtained from the United States Department
of Labor. Quantities from the data that we derived are:
1. the breakdown in wages of men and women by race by state
2. the income of the top 100 CEOs in the United States in 2013 and 2016
3. change in income in the United States by race and gender
Data was processed by exporting excel files to
csv and then converting those files to JSON format.
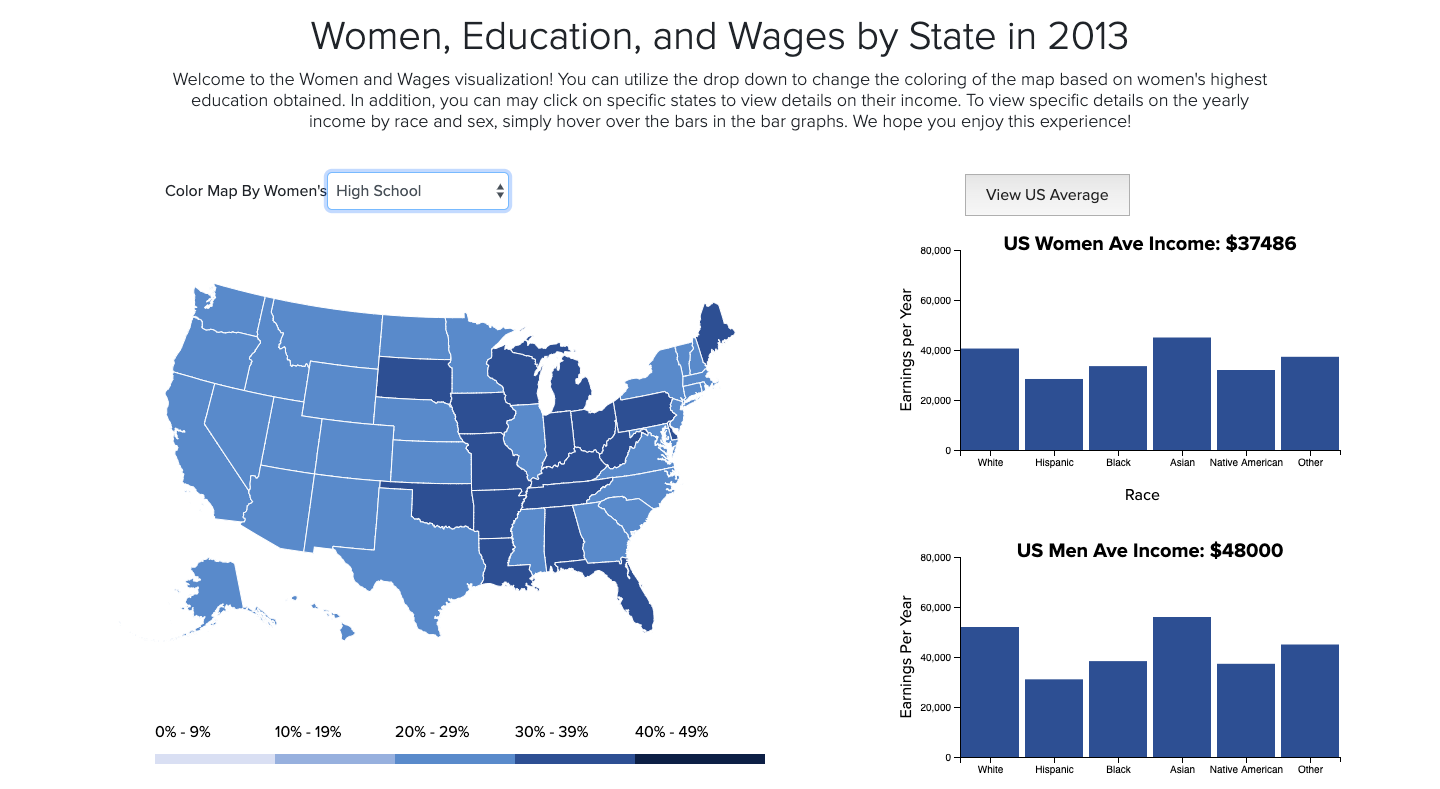
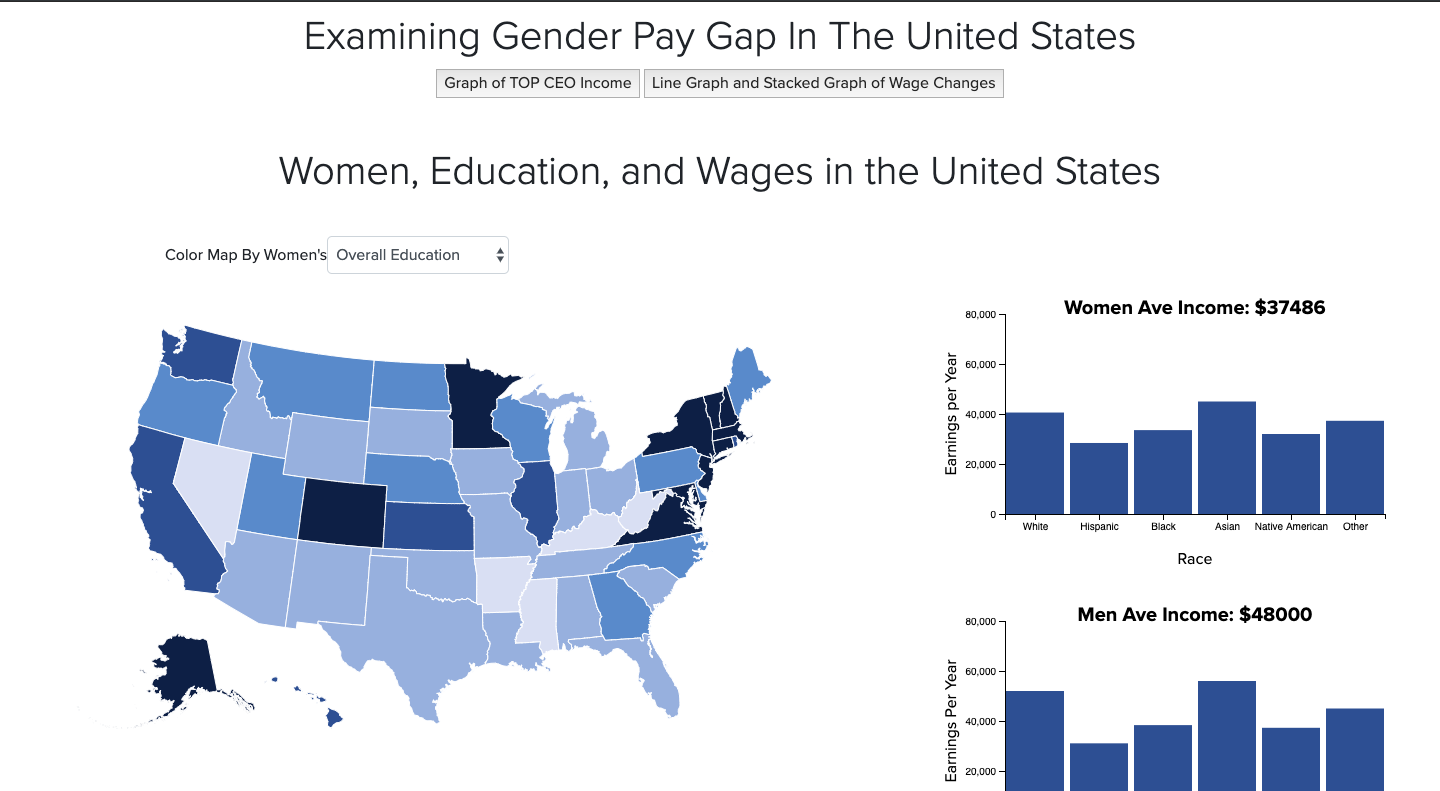
Map Depicting US and Race
Interactive map that displays women's education levels and the racial breakdown of education between men
and women
in each state.
Questions it Answers:
1. How does the amount of money men and women make relate to education?
2. How does one’s race relate to their level of education?
3. How much more money do men make than women of the same education?
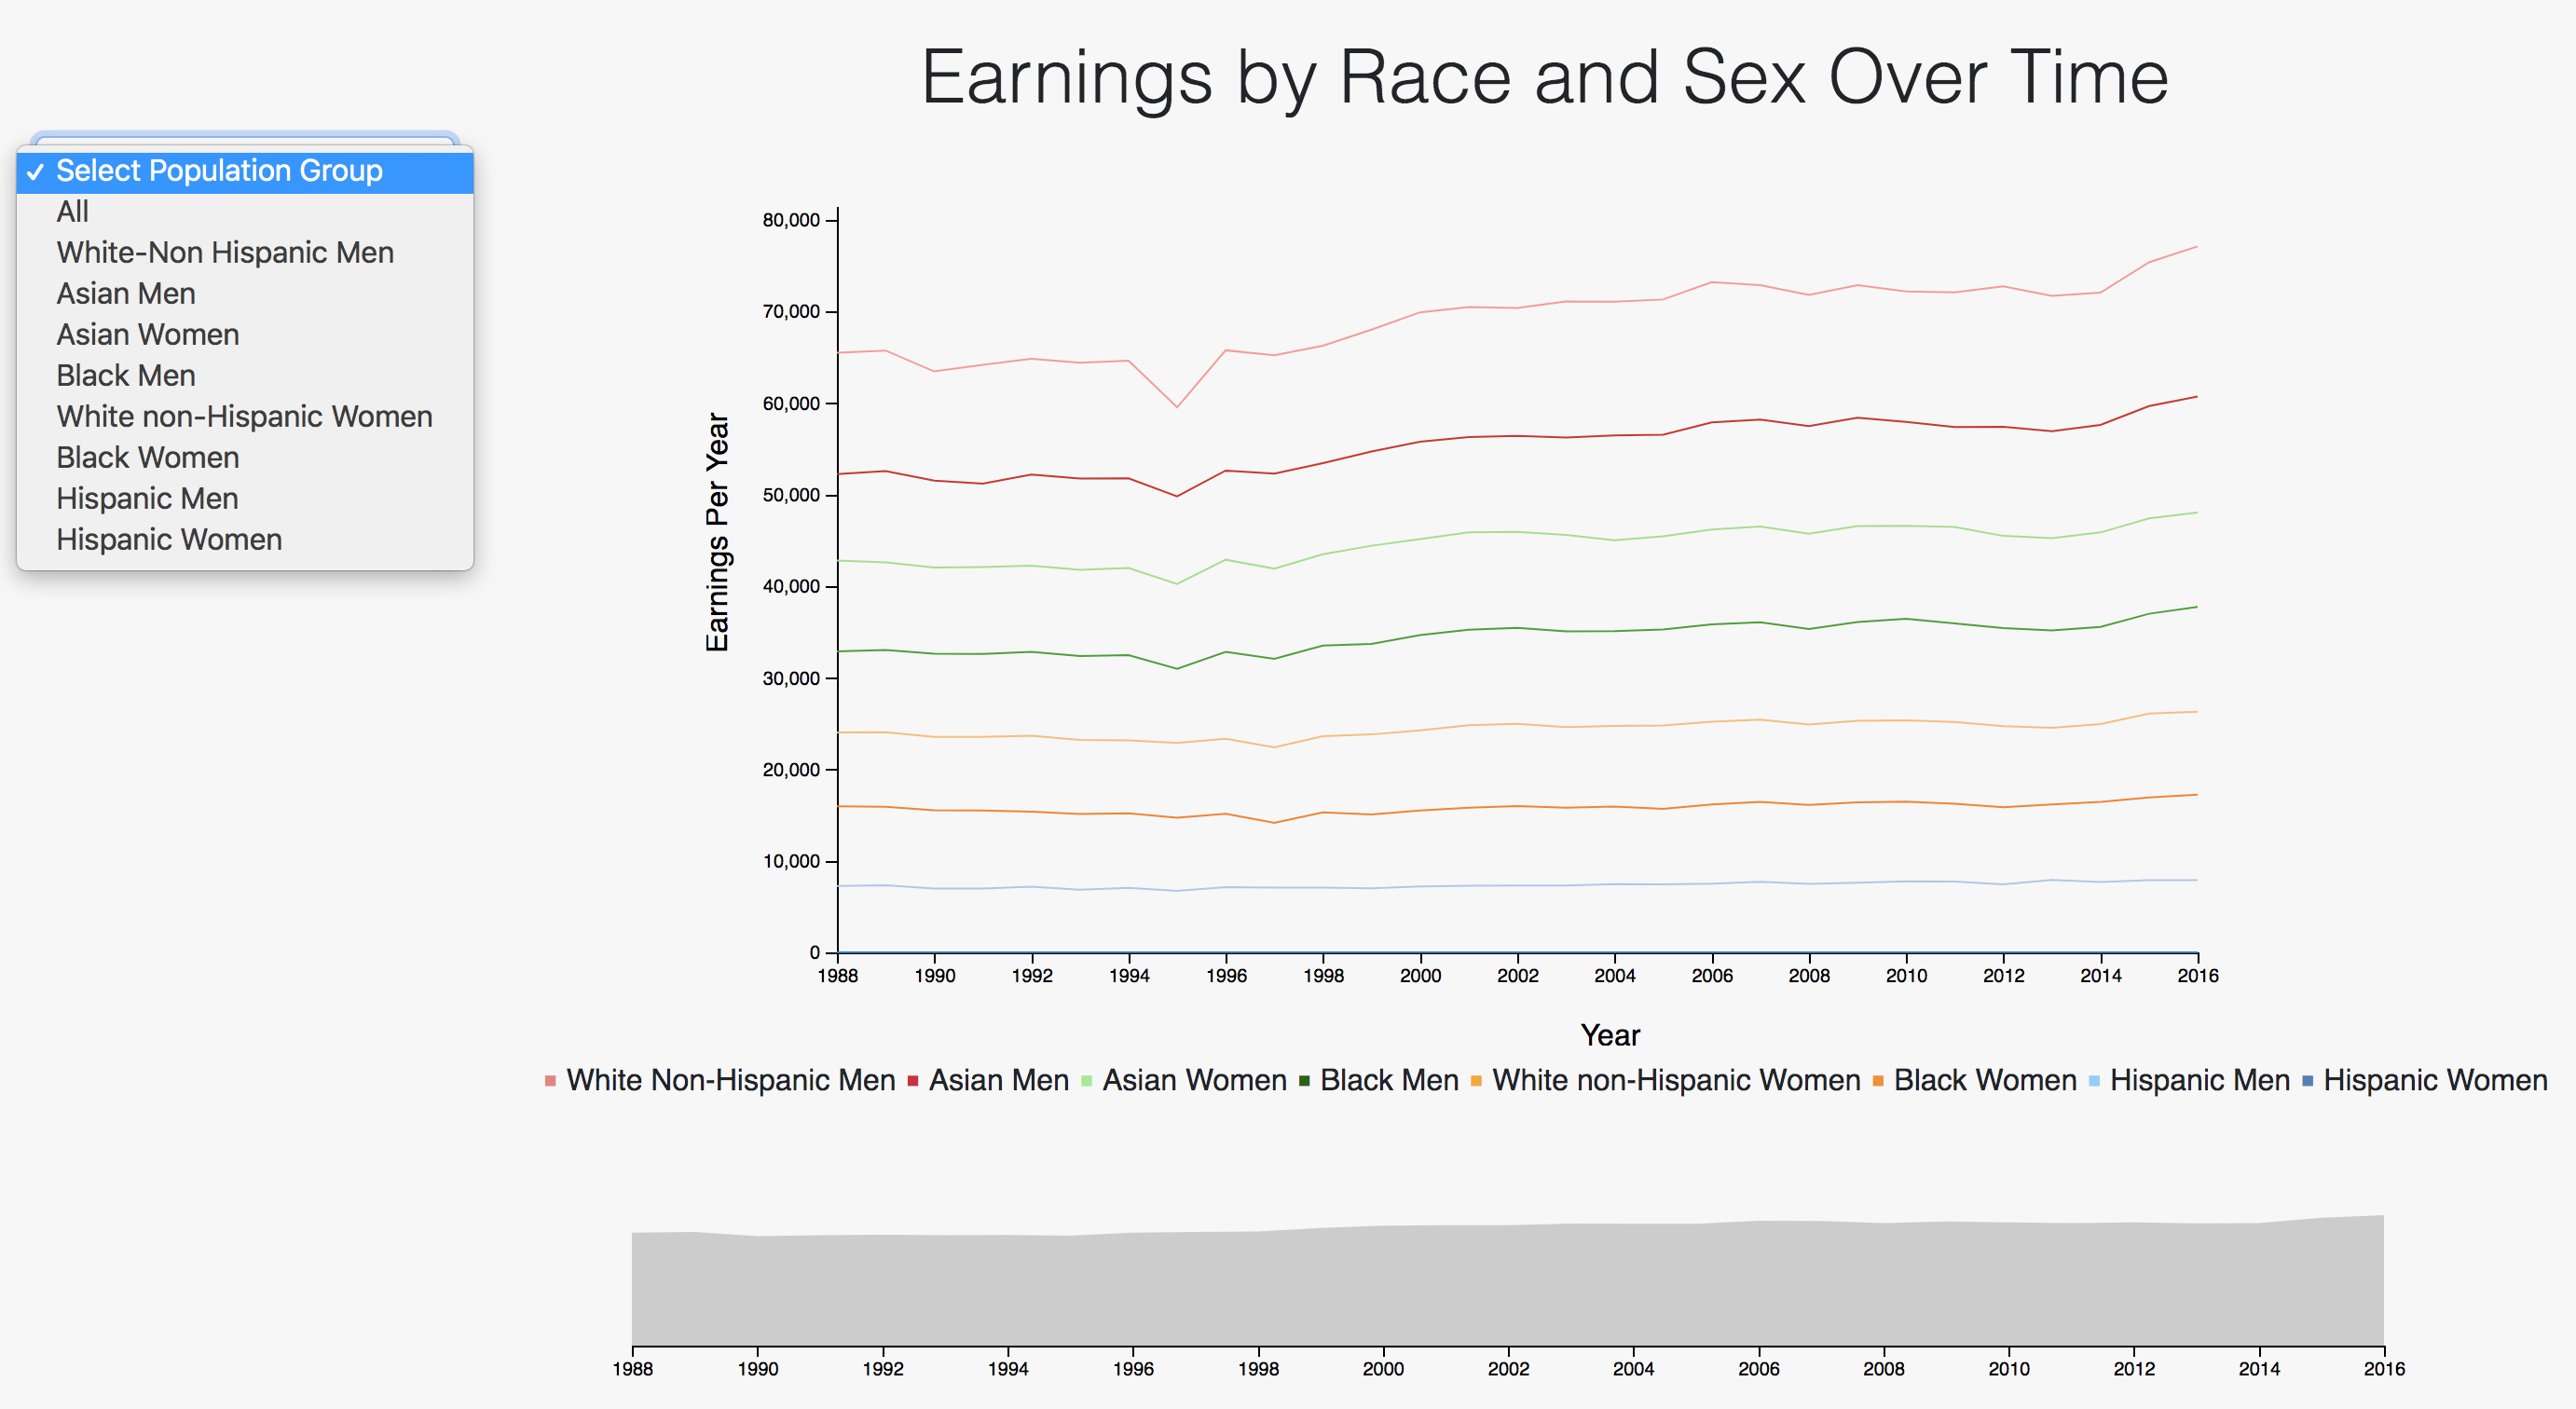
Line Graph of Wage Changes
Line plot depicting change in income over time by gender and race
Questions it Answers:
1. How has income changed over time in relation to gender and race?
2. How has the income gap changed?
3. How do gender and race relate to one’s income?
Graph of top CEO Income
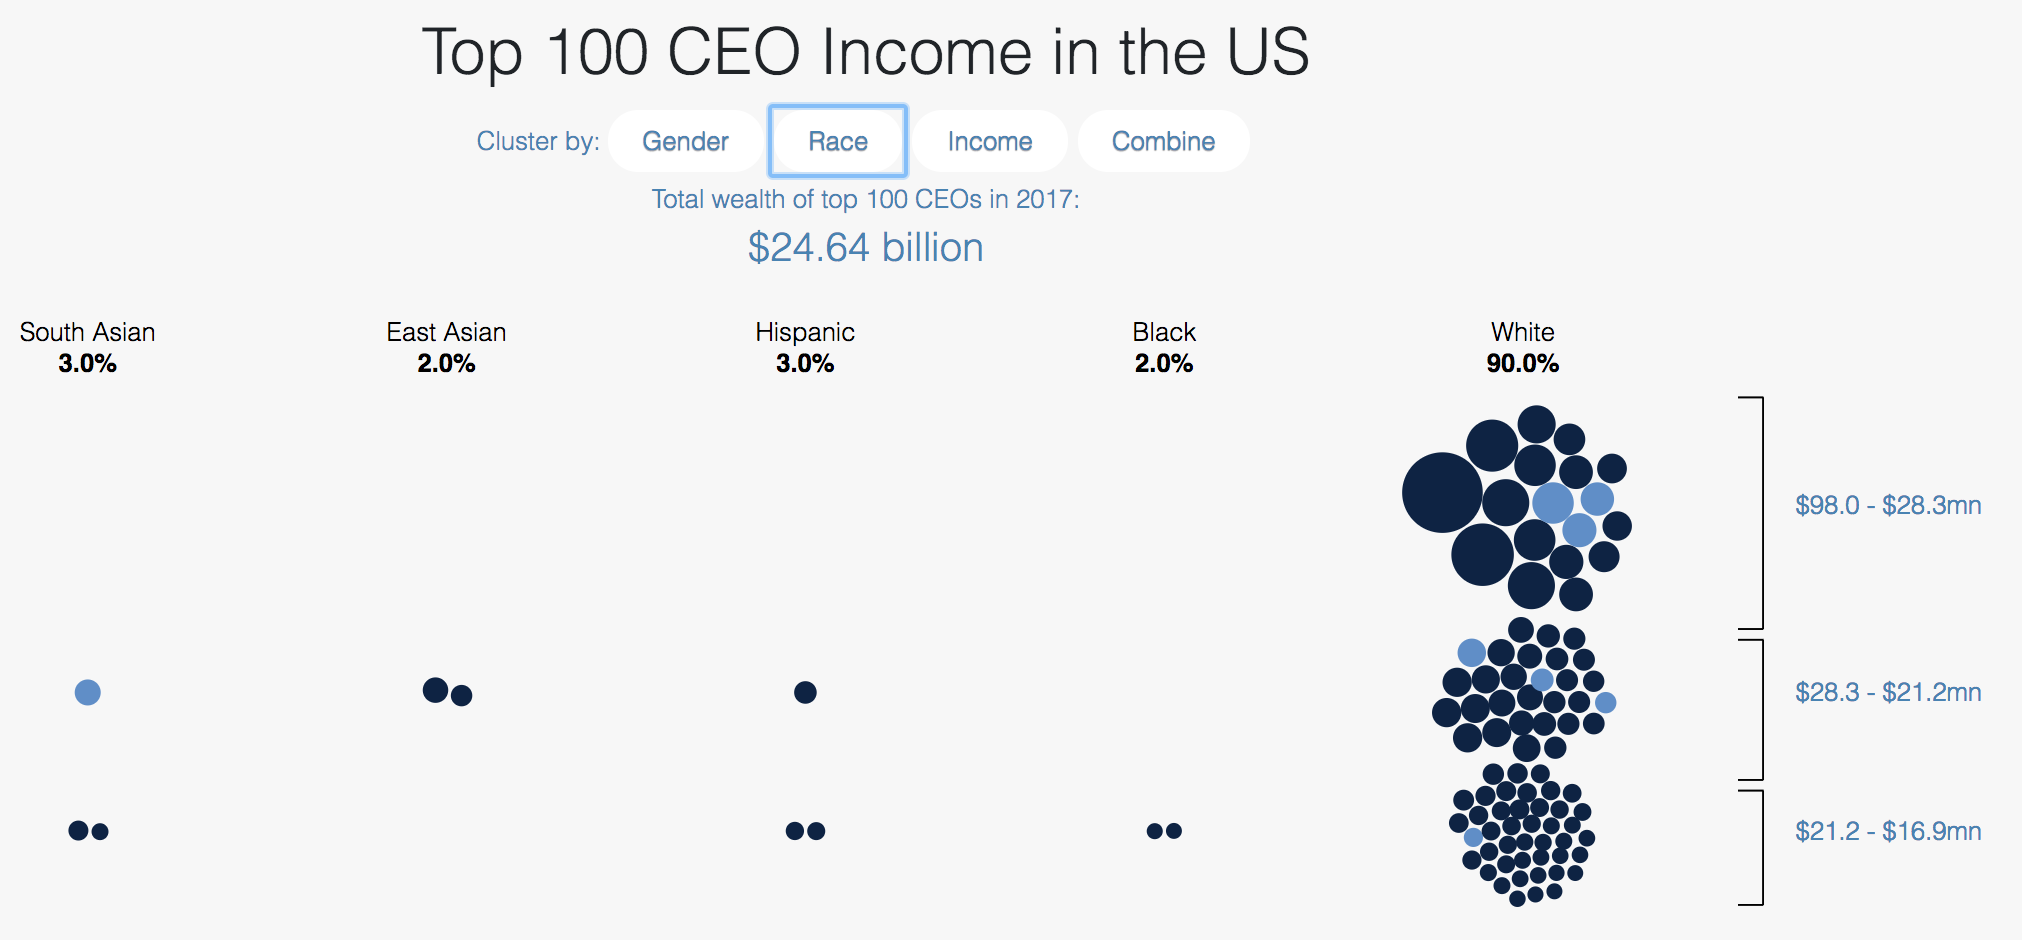
This is an interactive circle graph that allows users to analyze data of top 200 earning CEOs in the U.S.
Questions it Answers:
1. How do female executive’s income compare to men’s?
2. How many women hold executive positions?
3. What is the breakdown of race in top executive positions?
4. How much do minority executives make compared to white executives?
Visualization Implementation
Here is the schedule in which we approached our
project implementation.
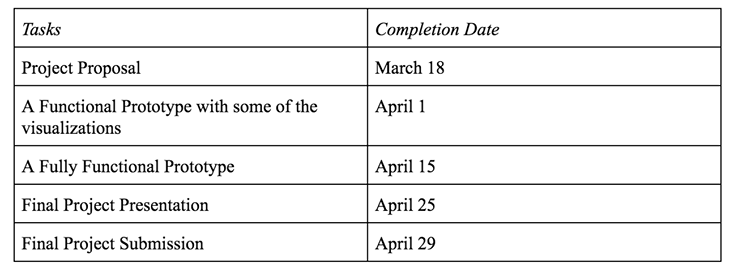
From March 18th to 15th our main focus was on
implementing each individual visualization and ensuring that
all of the functionalities were there. However, there were changes made in terms of design decisions during
this period of time.
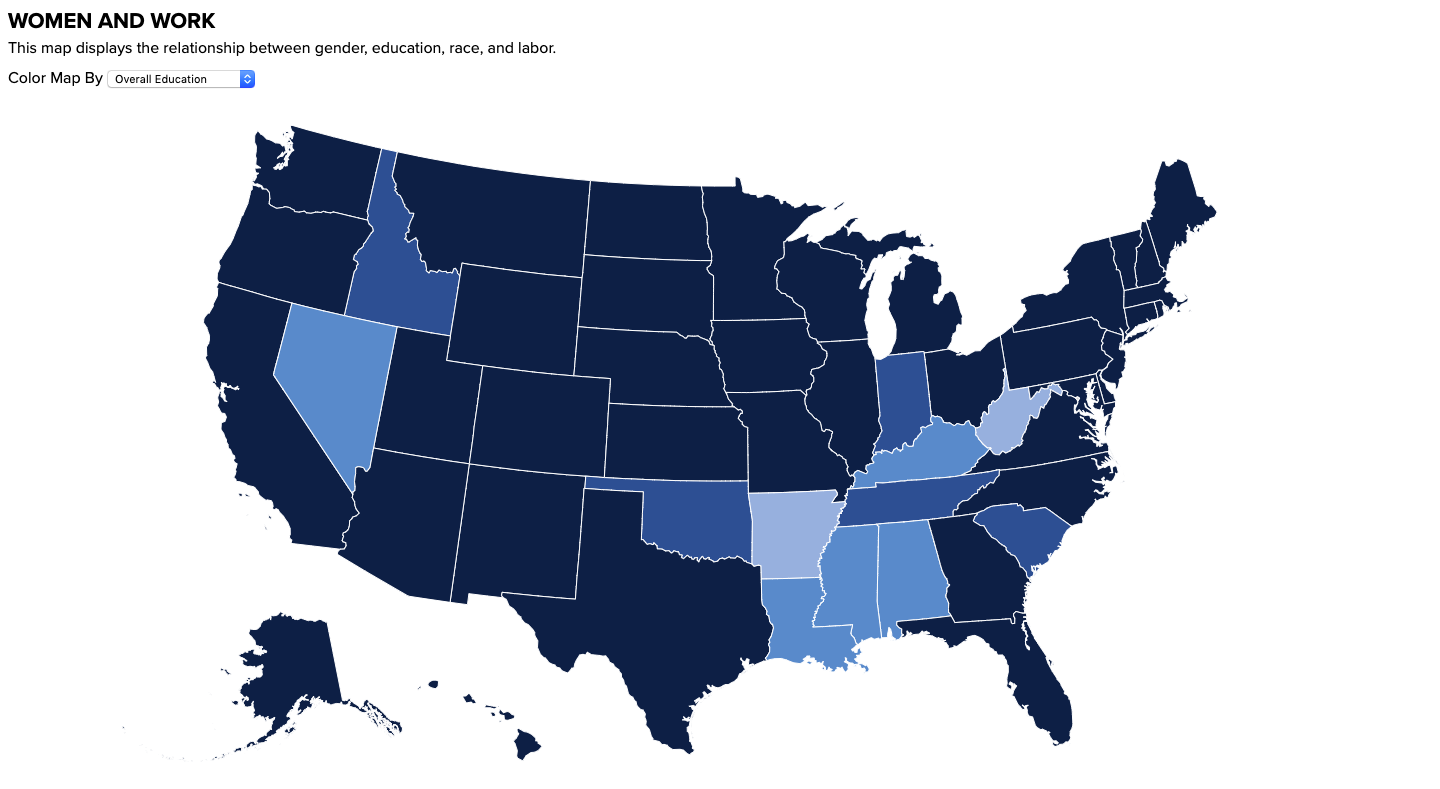
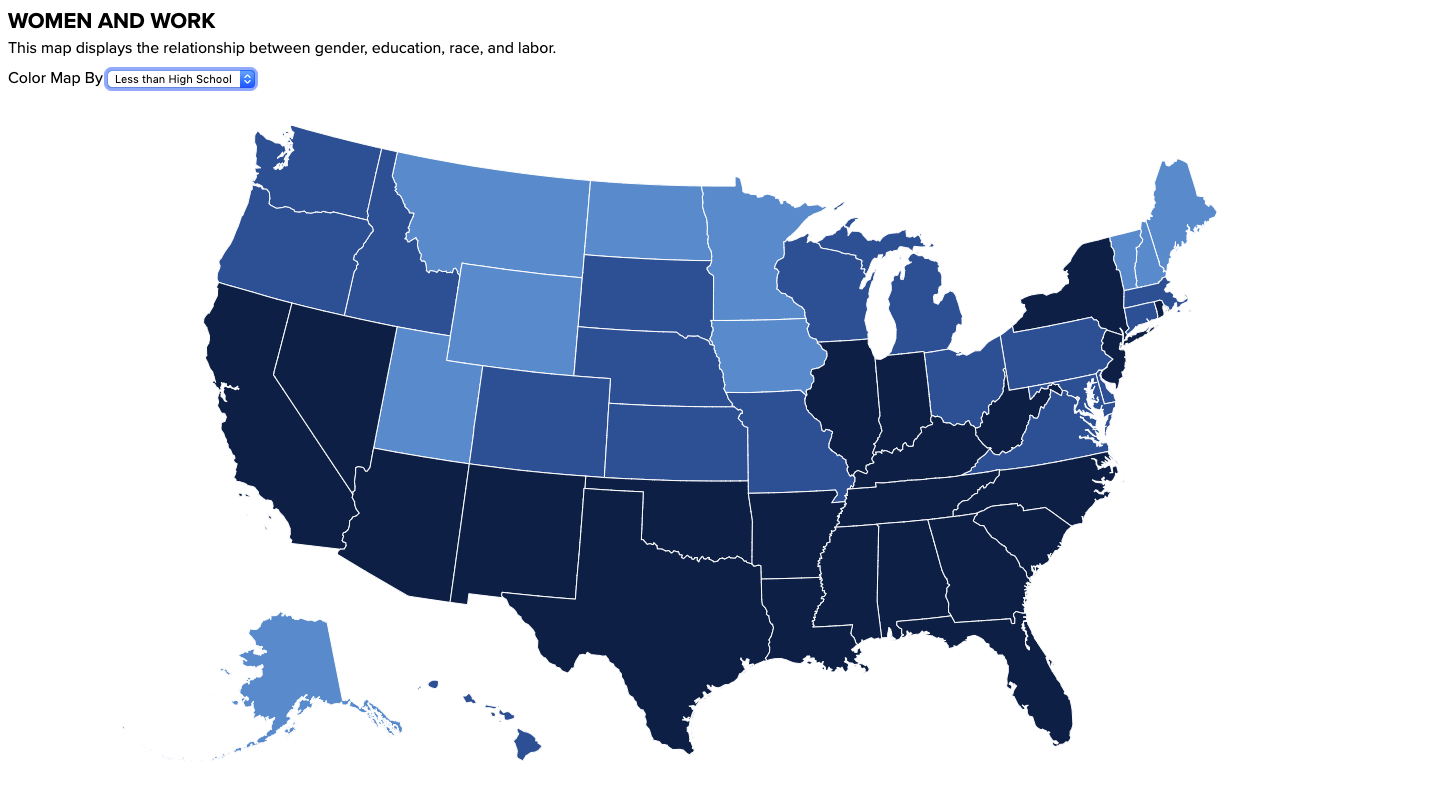
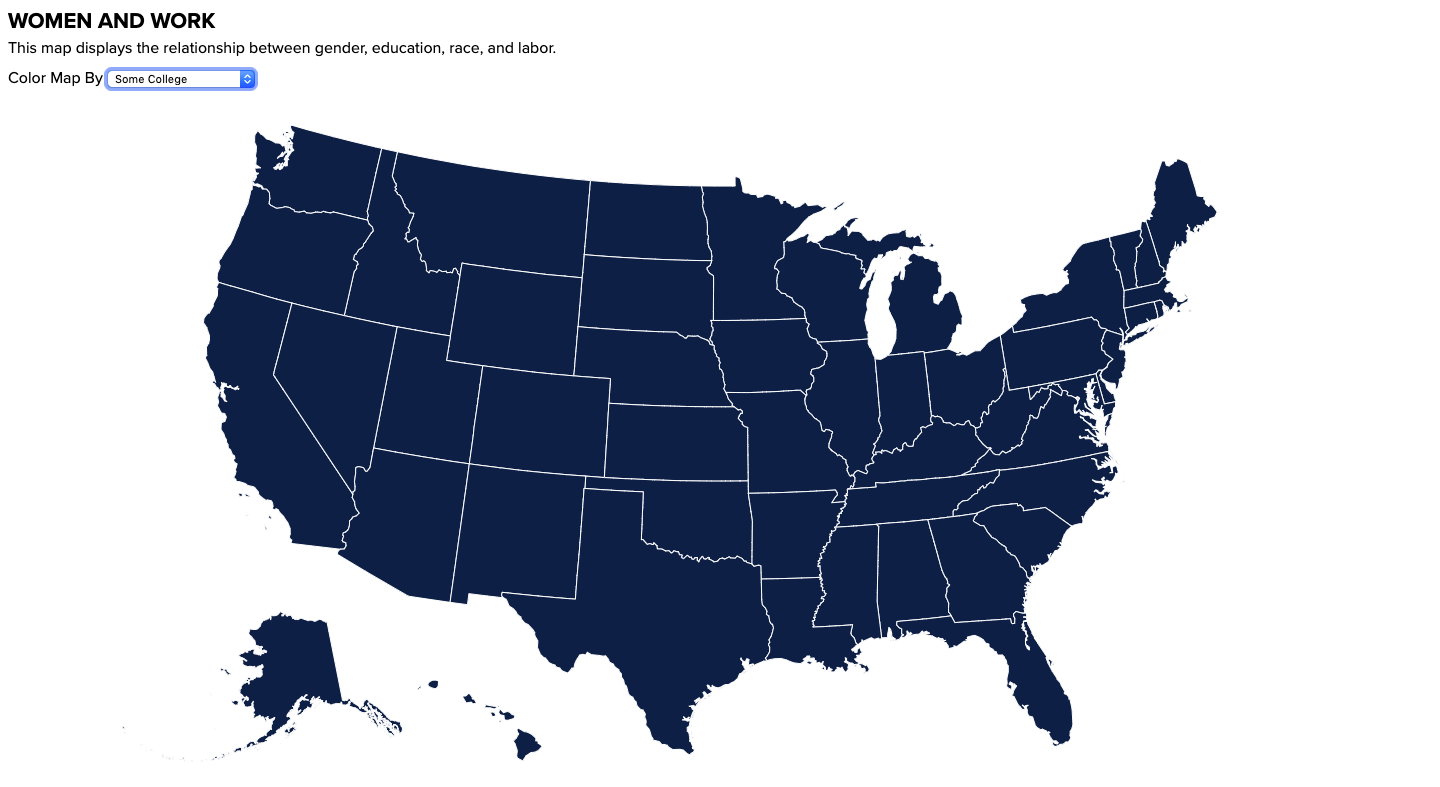
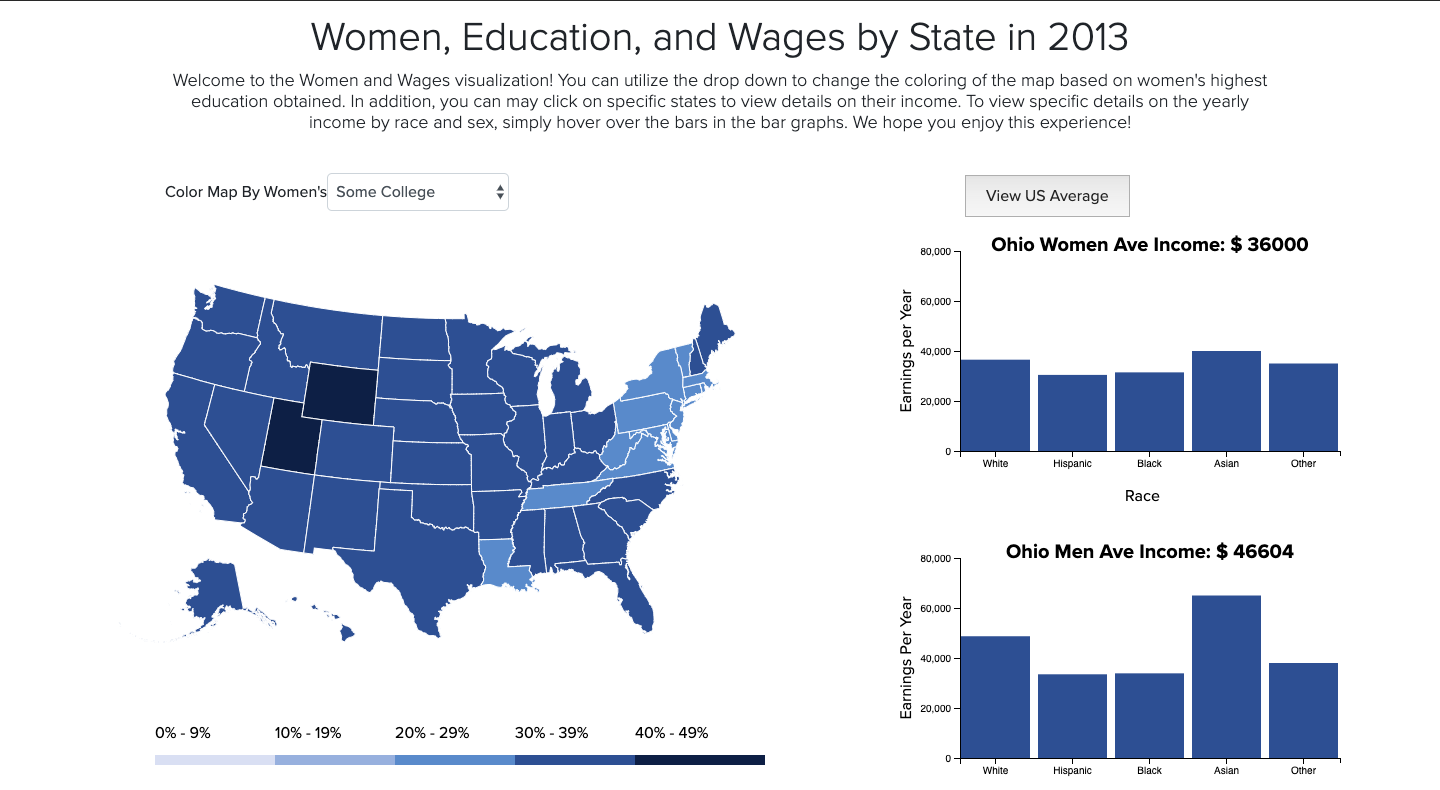
Map Chart: Milestone 1
Initially, the map was colored based on the
average education obtained. However, upon implementation we realized that this
was not particuarly helpful due to how the distribution of highest level of education obtained influenced the map
coloring. We then
experimented with making the coloring for each level of education depend on each given education dataset's
average, but realized that this too
would be confusing due to a lack of consistency in how the states were colored. Therefore, we finally decided to
color them based on
set percentage groups of 0-10%, 10-20%, etc. and eliminatng the overall education coloring as this would add
confusion since that coloring is not based on percentage
but rather points that were calculated for each state based on ratios of women with higher level of education.
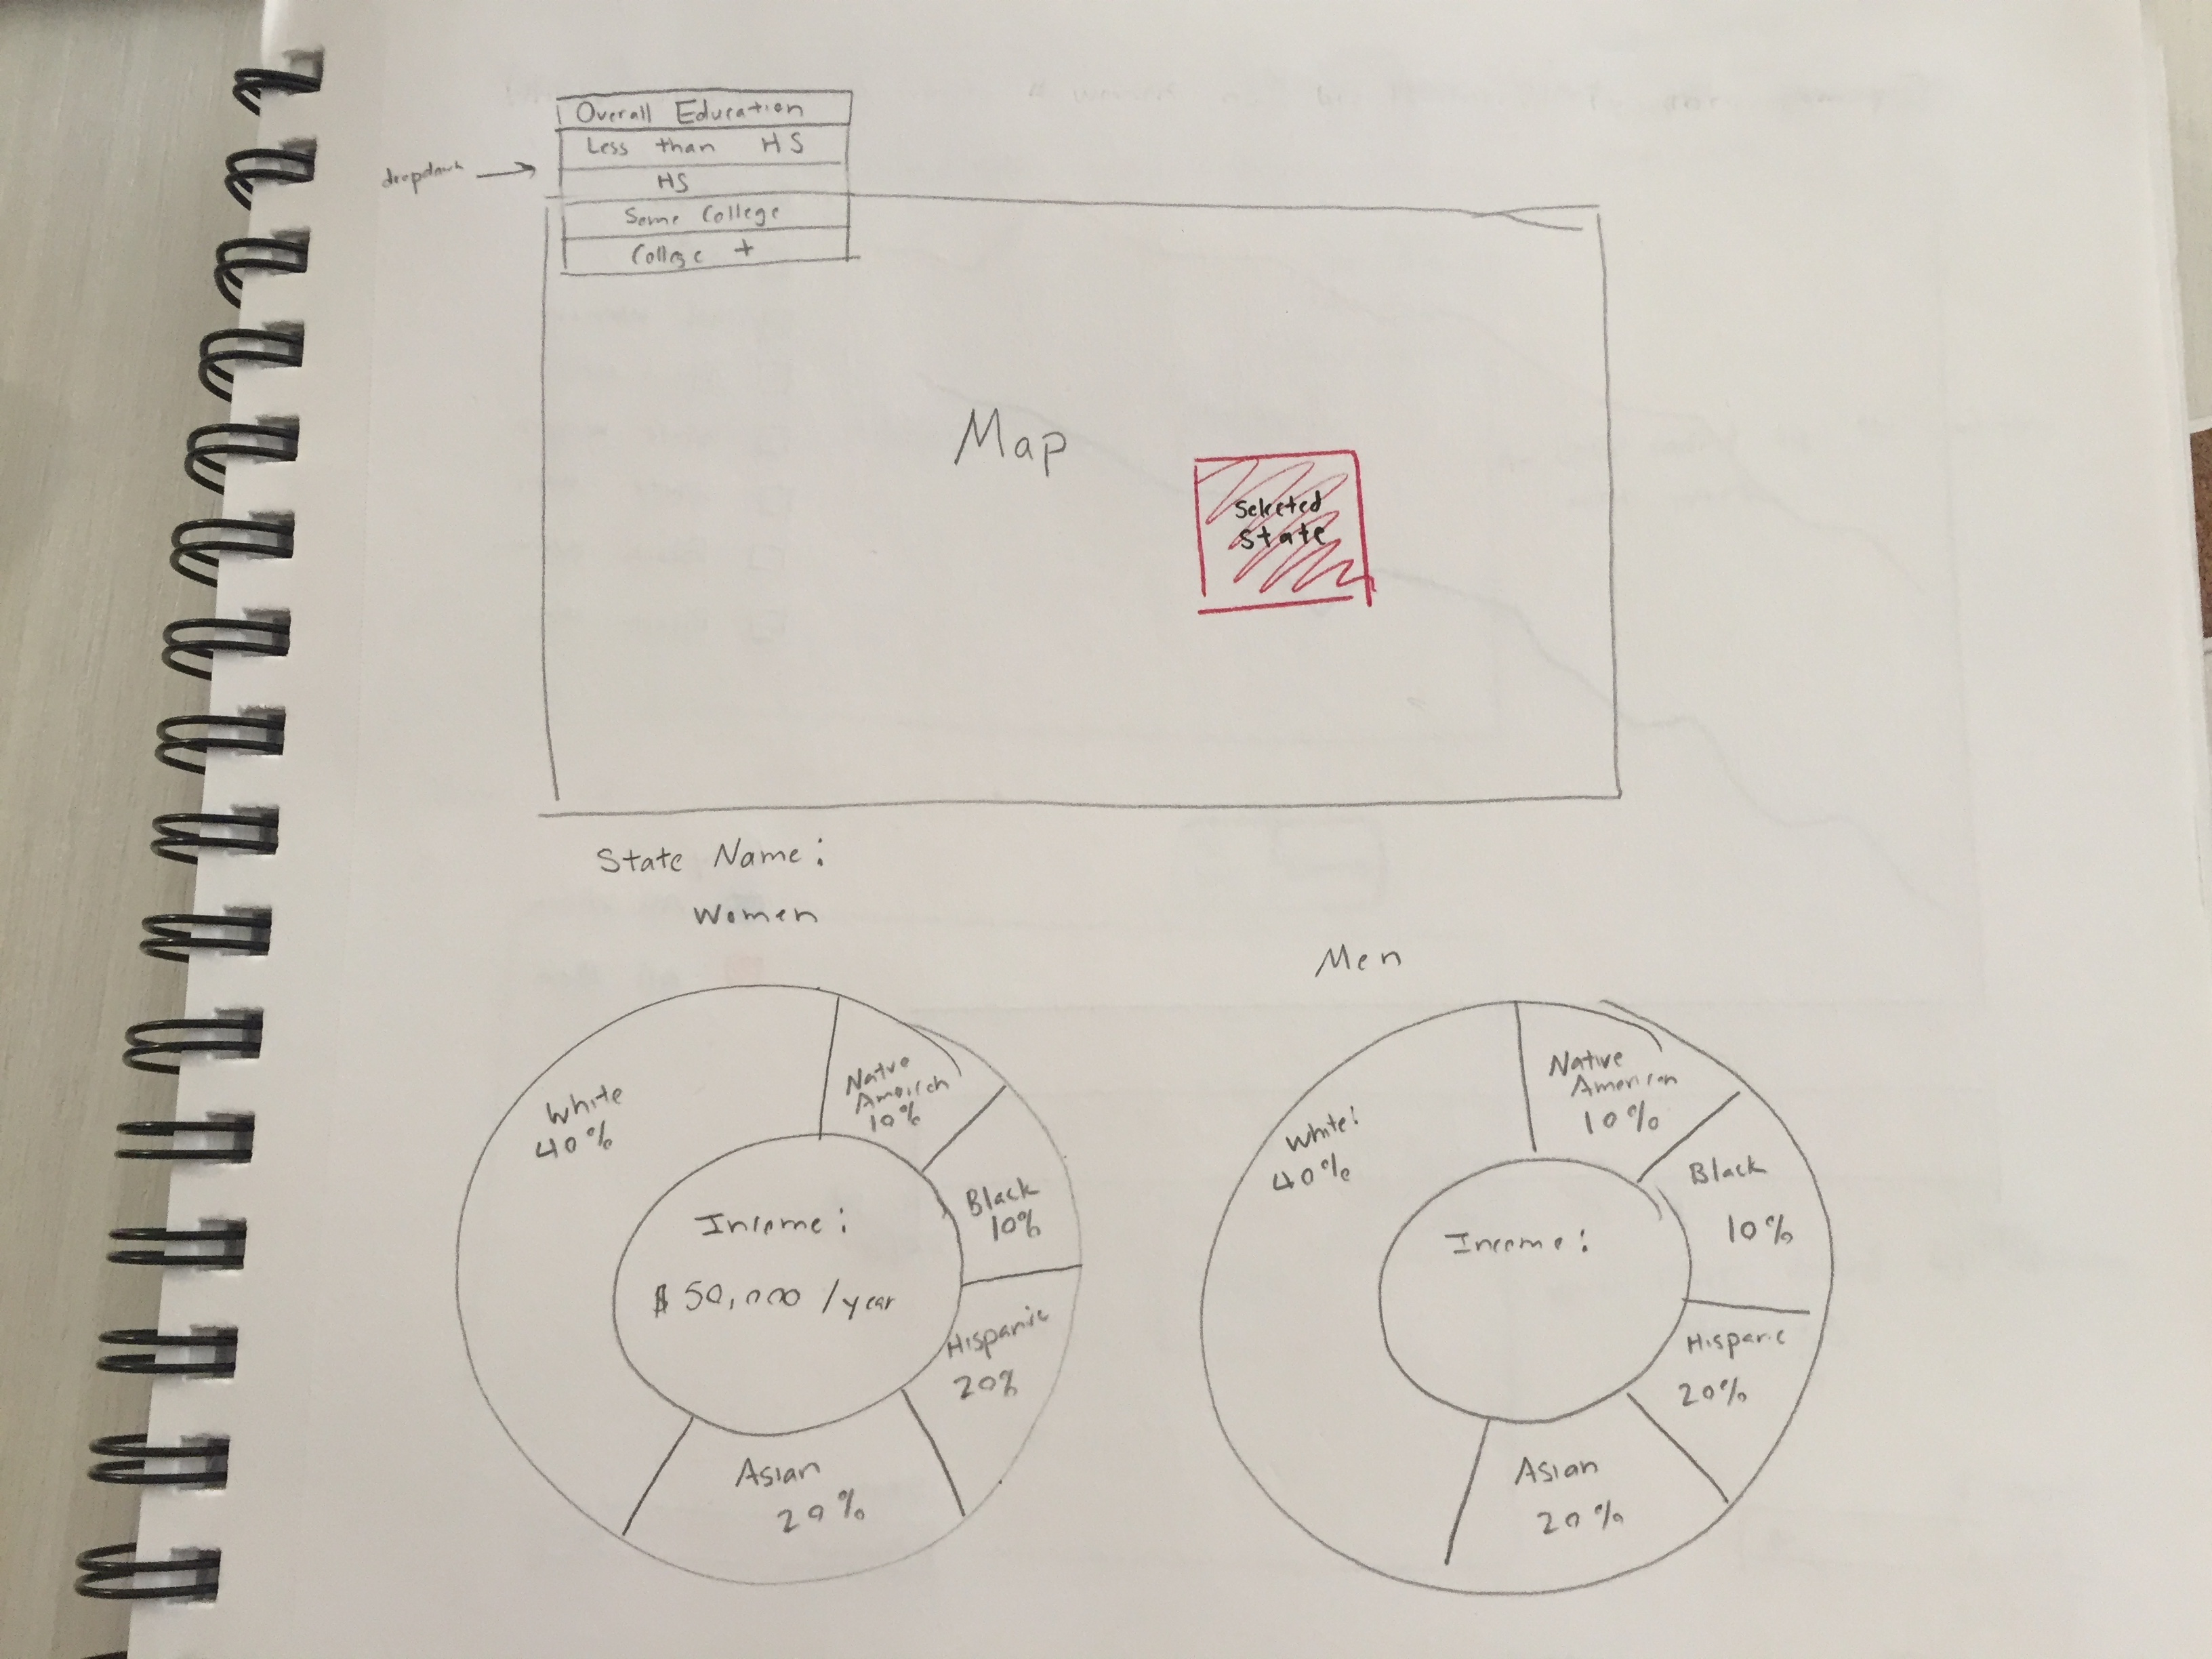
The initial design for this visualization also
utilized pie charts to communicate the racial breakdown of income for men and women for in each
state. However, we decided to change this to bar graphs because pie charts are more difficult when it comes to
comparing the size of different
sections, and we wanted it to be easy for users to compare the gender pay gap between men and women for each race
and within each sex. In addition,
pie charts communicate the concept of parts of a whole which we felt was an inaccurate and misleading design for
the given dataset.
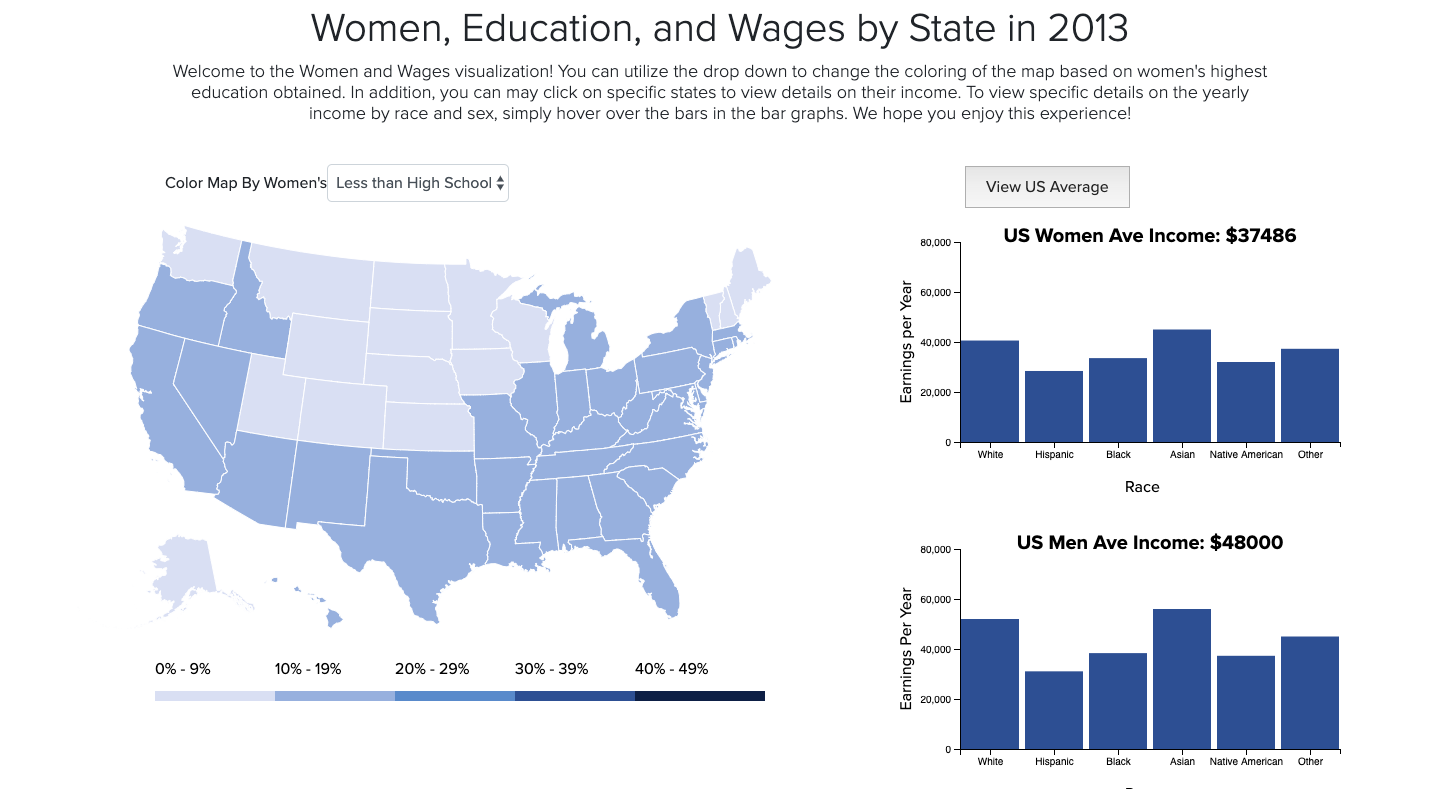
Map Chart: Iteration 2 (after User Testing)
Labels were added to the key for the map's
coloring
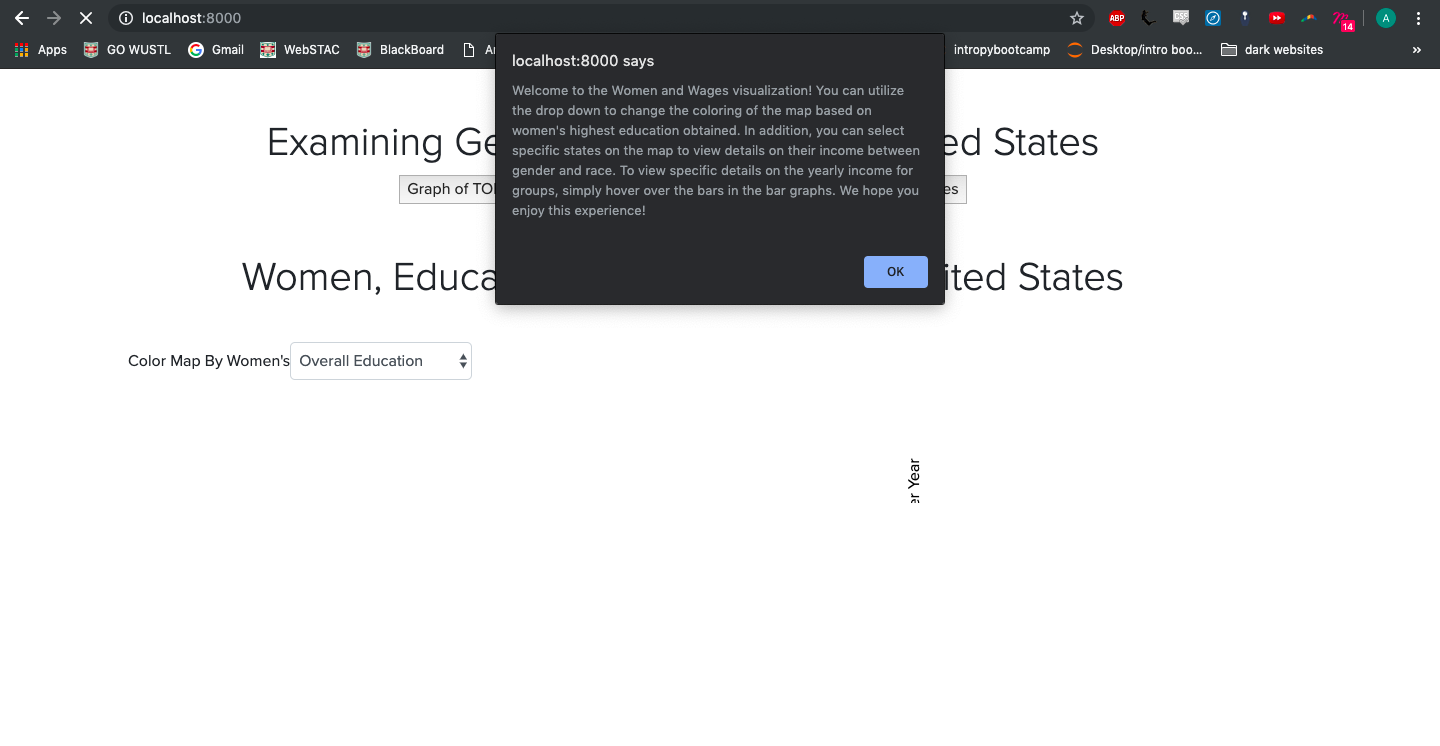
in order to remove confusion as to what the colors meant. In addition, a button was added that allowed users to
switch back to viewing the gender and racial breakdown of income for the united states as a whole and instructions
were placed
at the top to provide users with context and instructions on how to interact with the visualization.
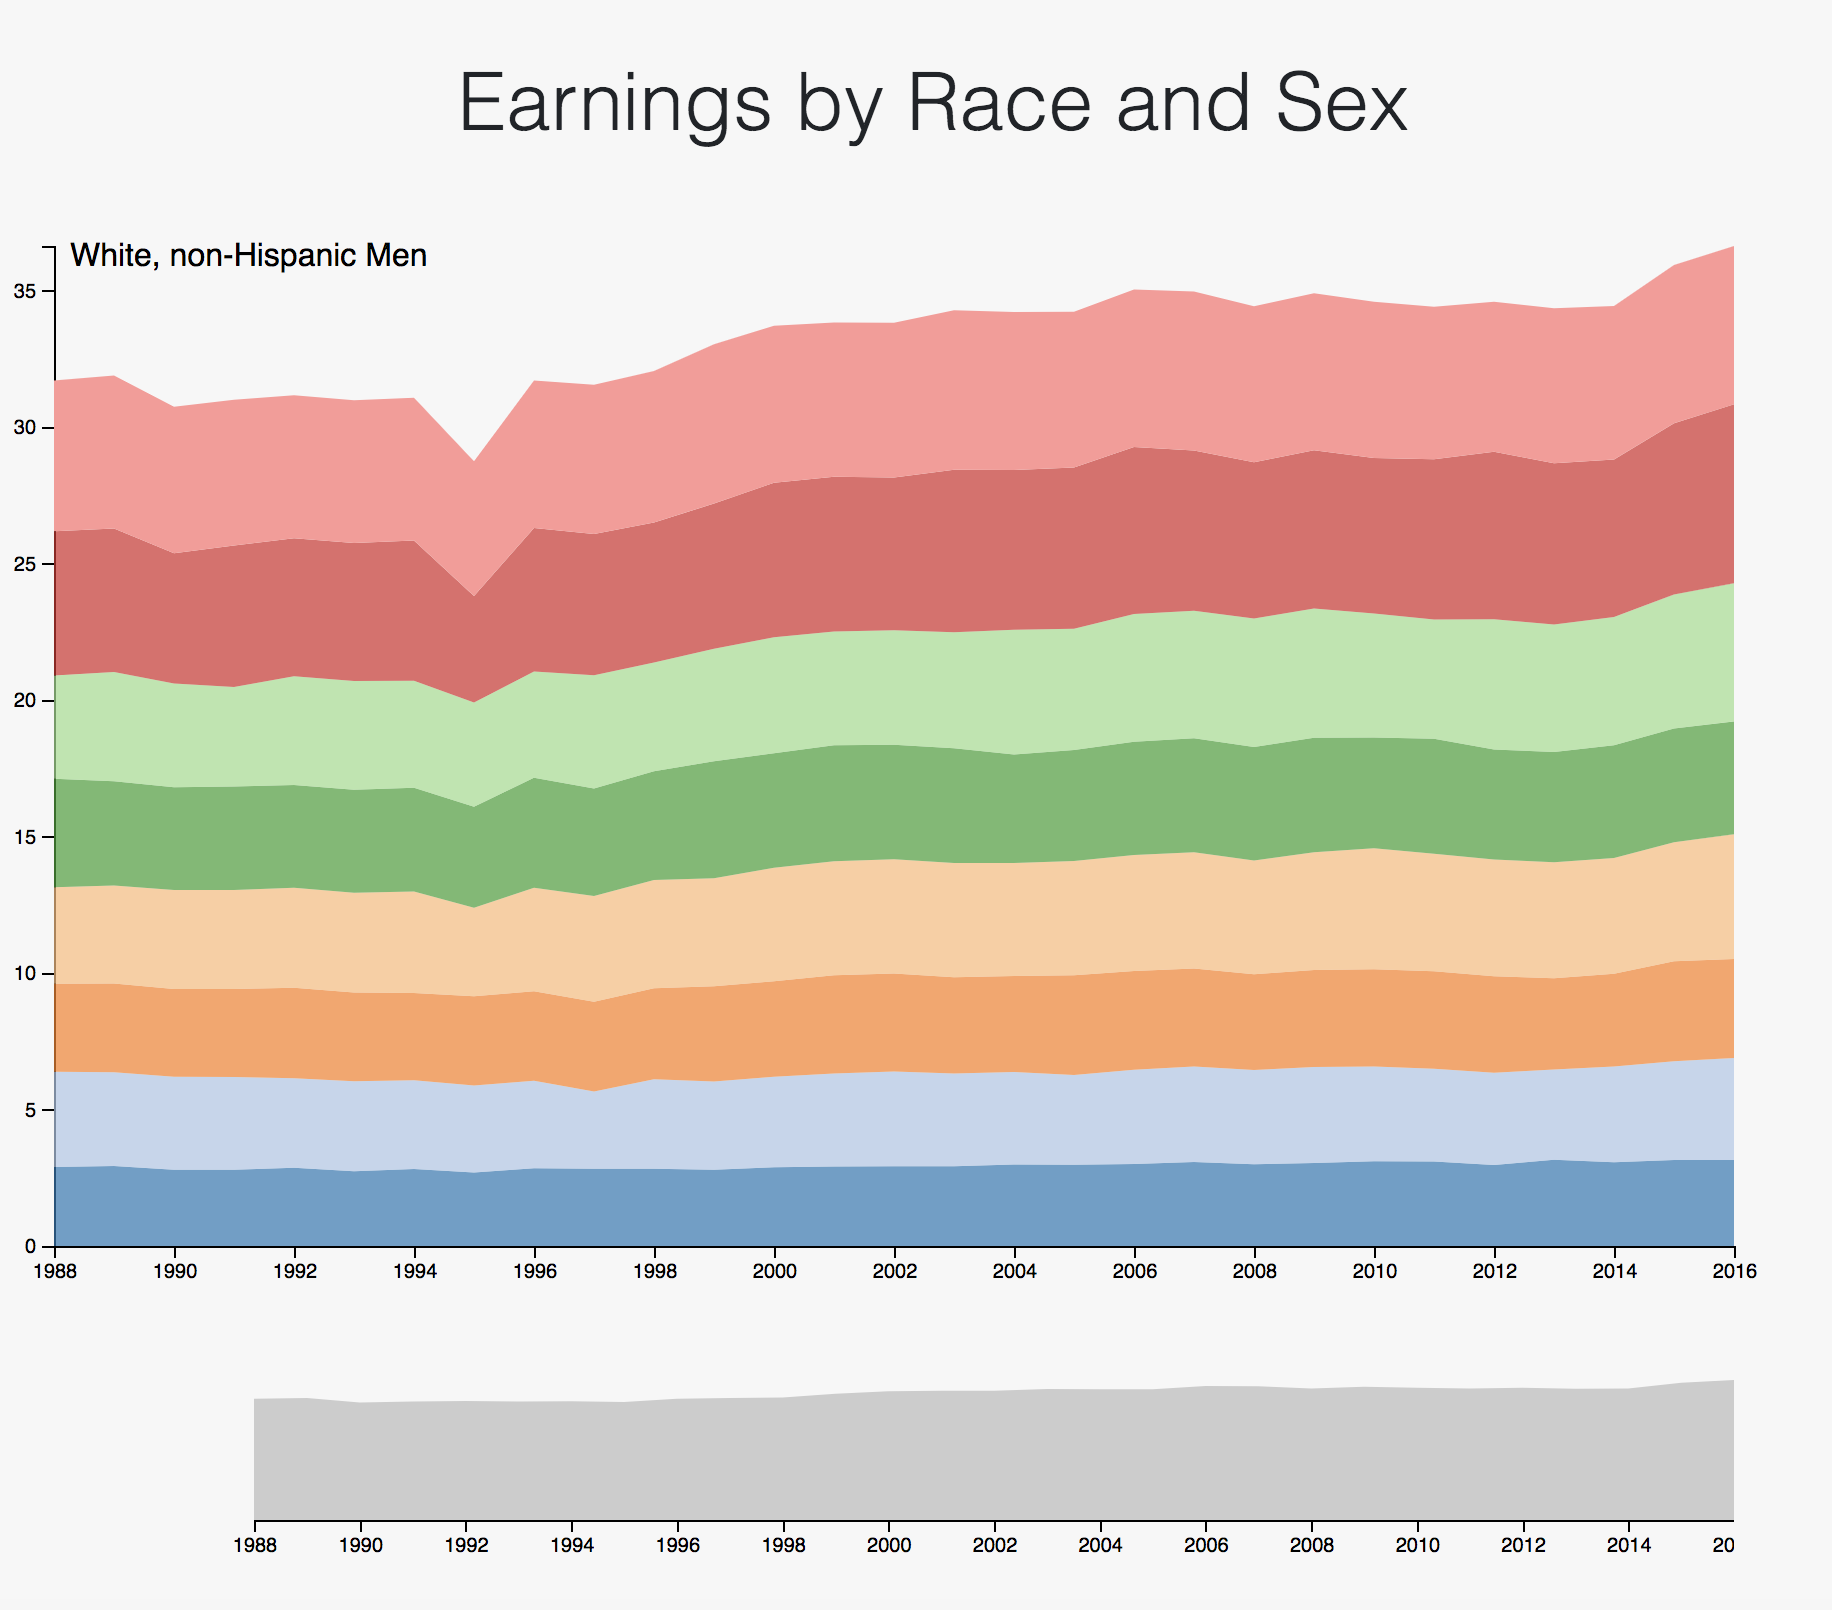
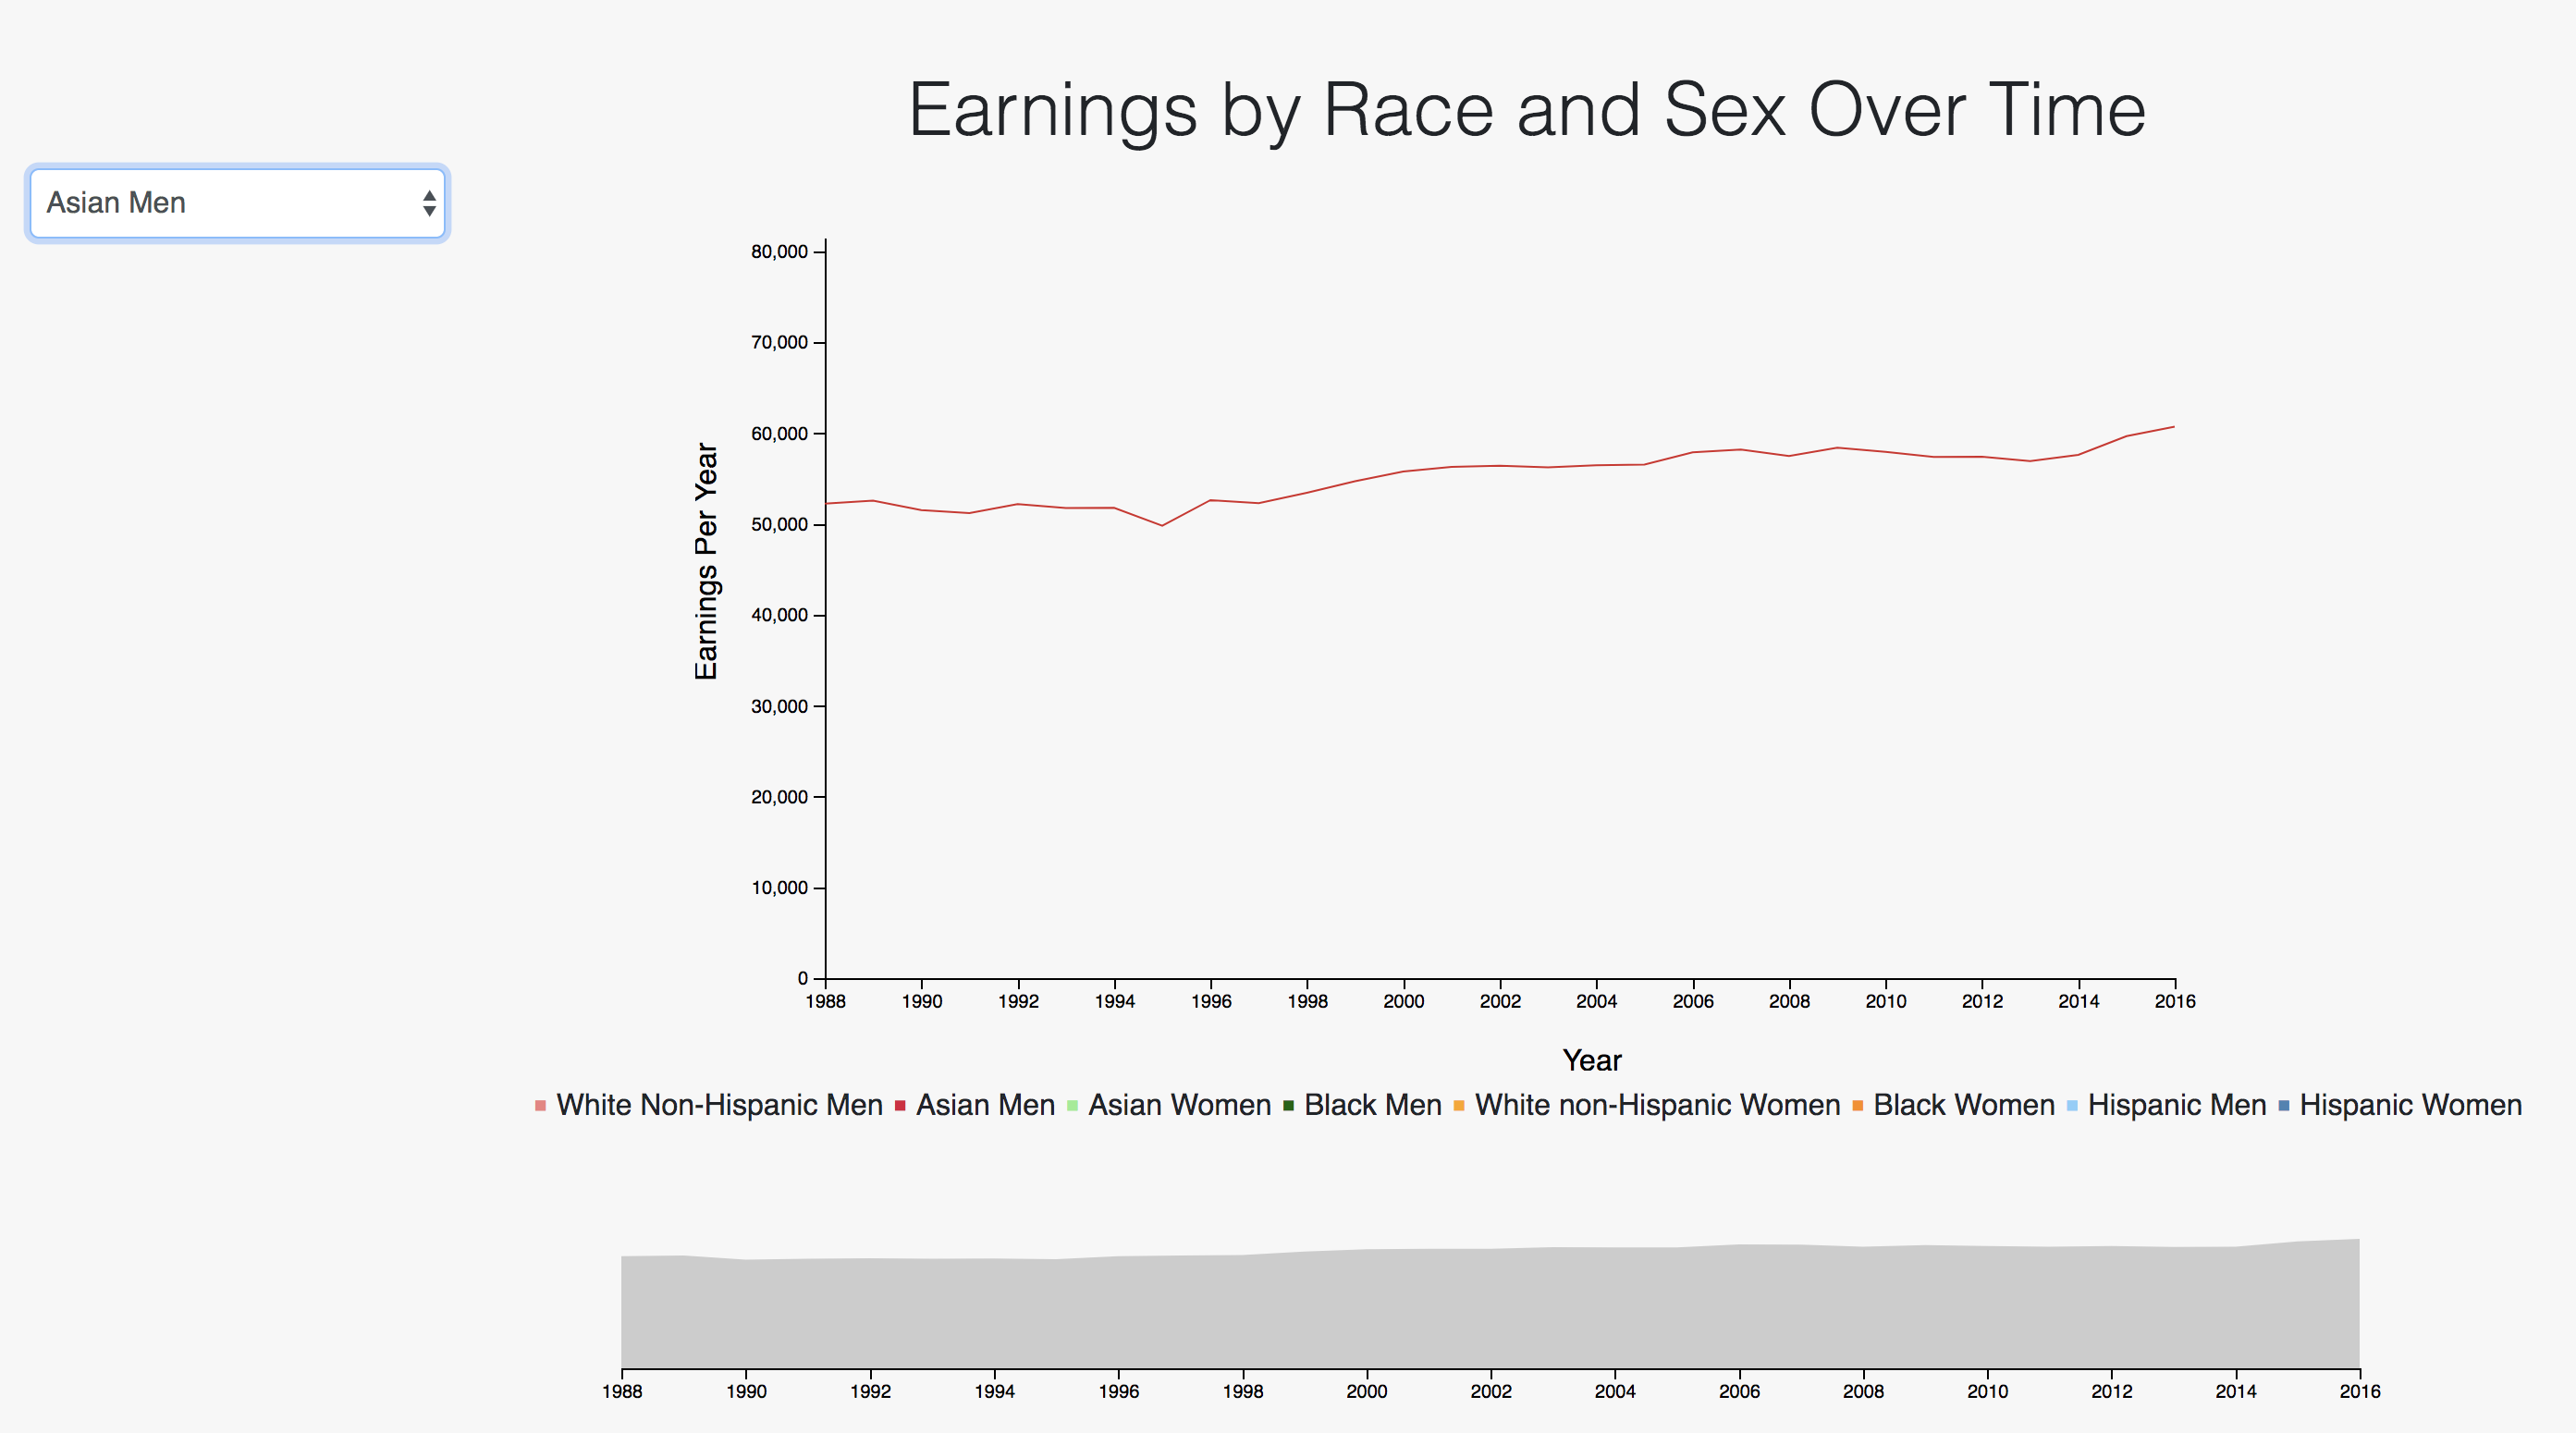
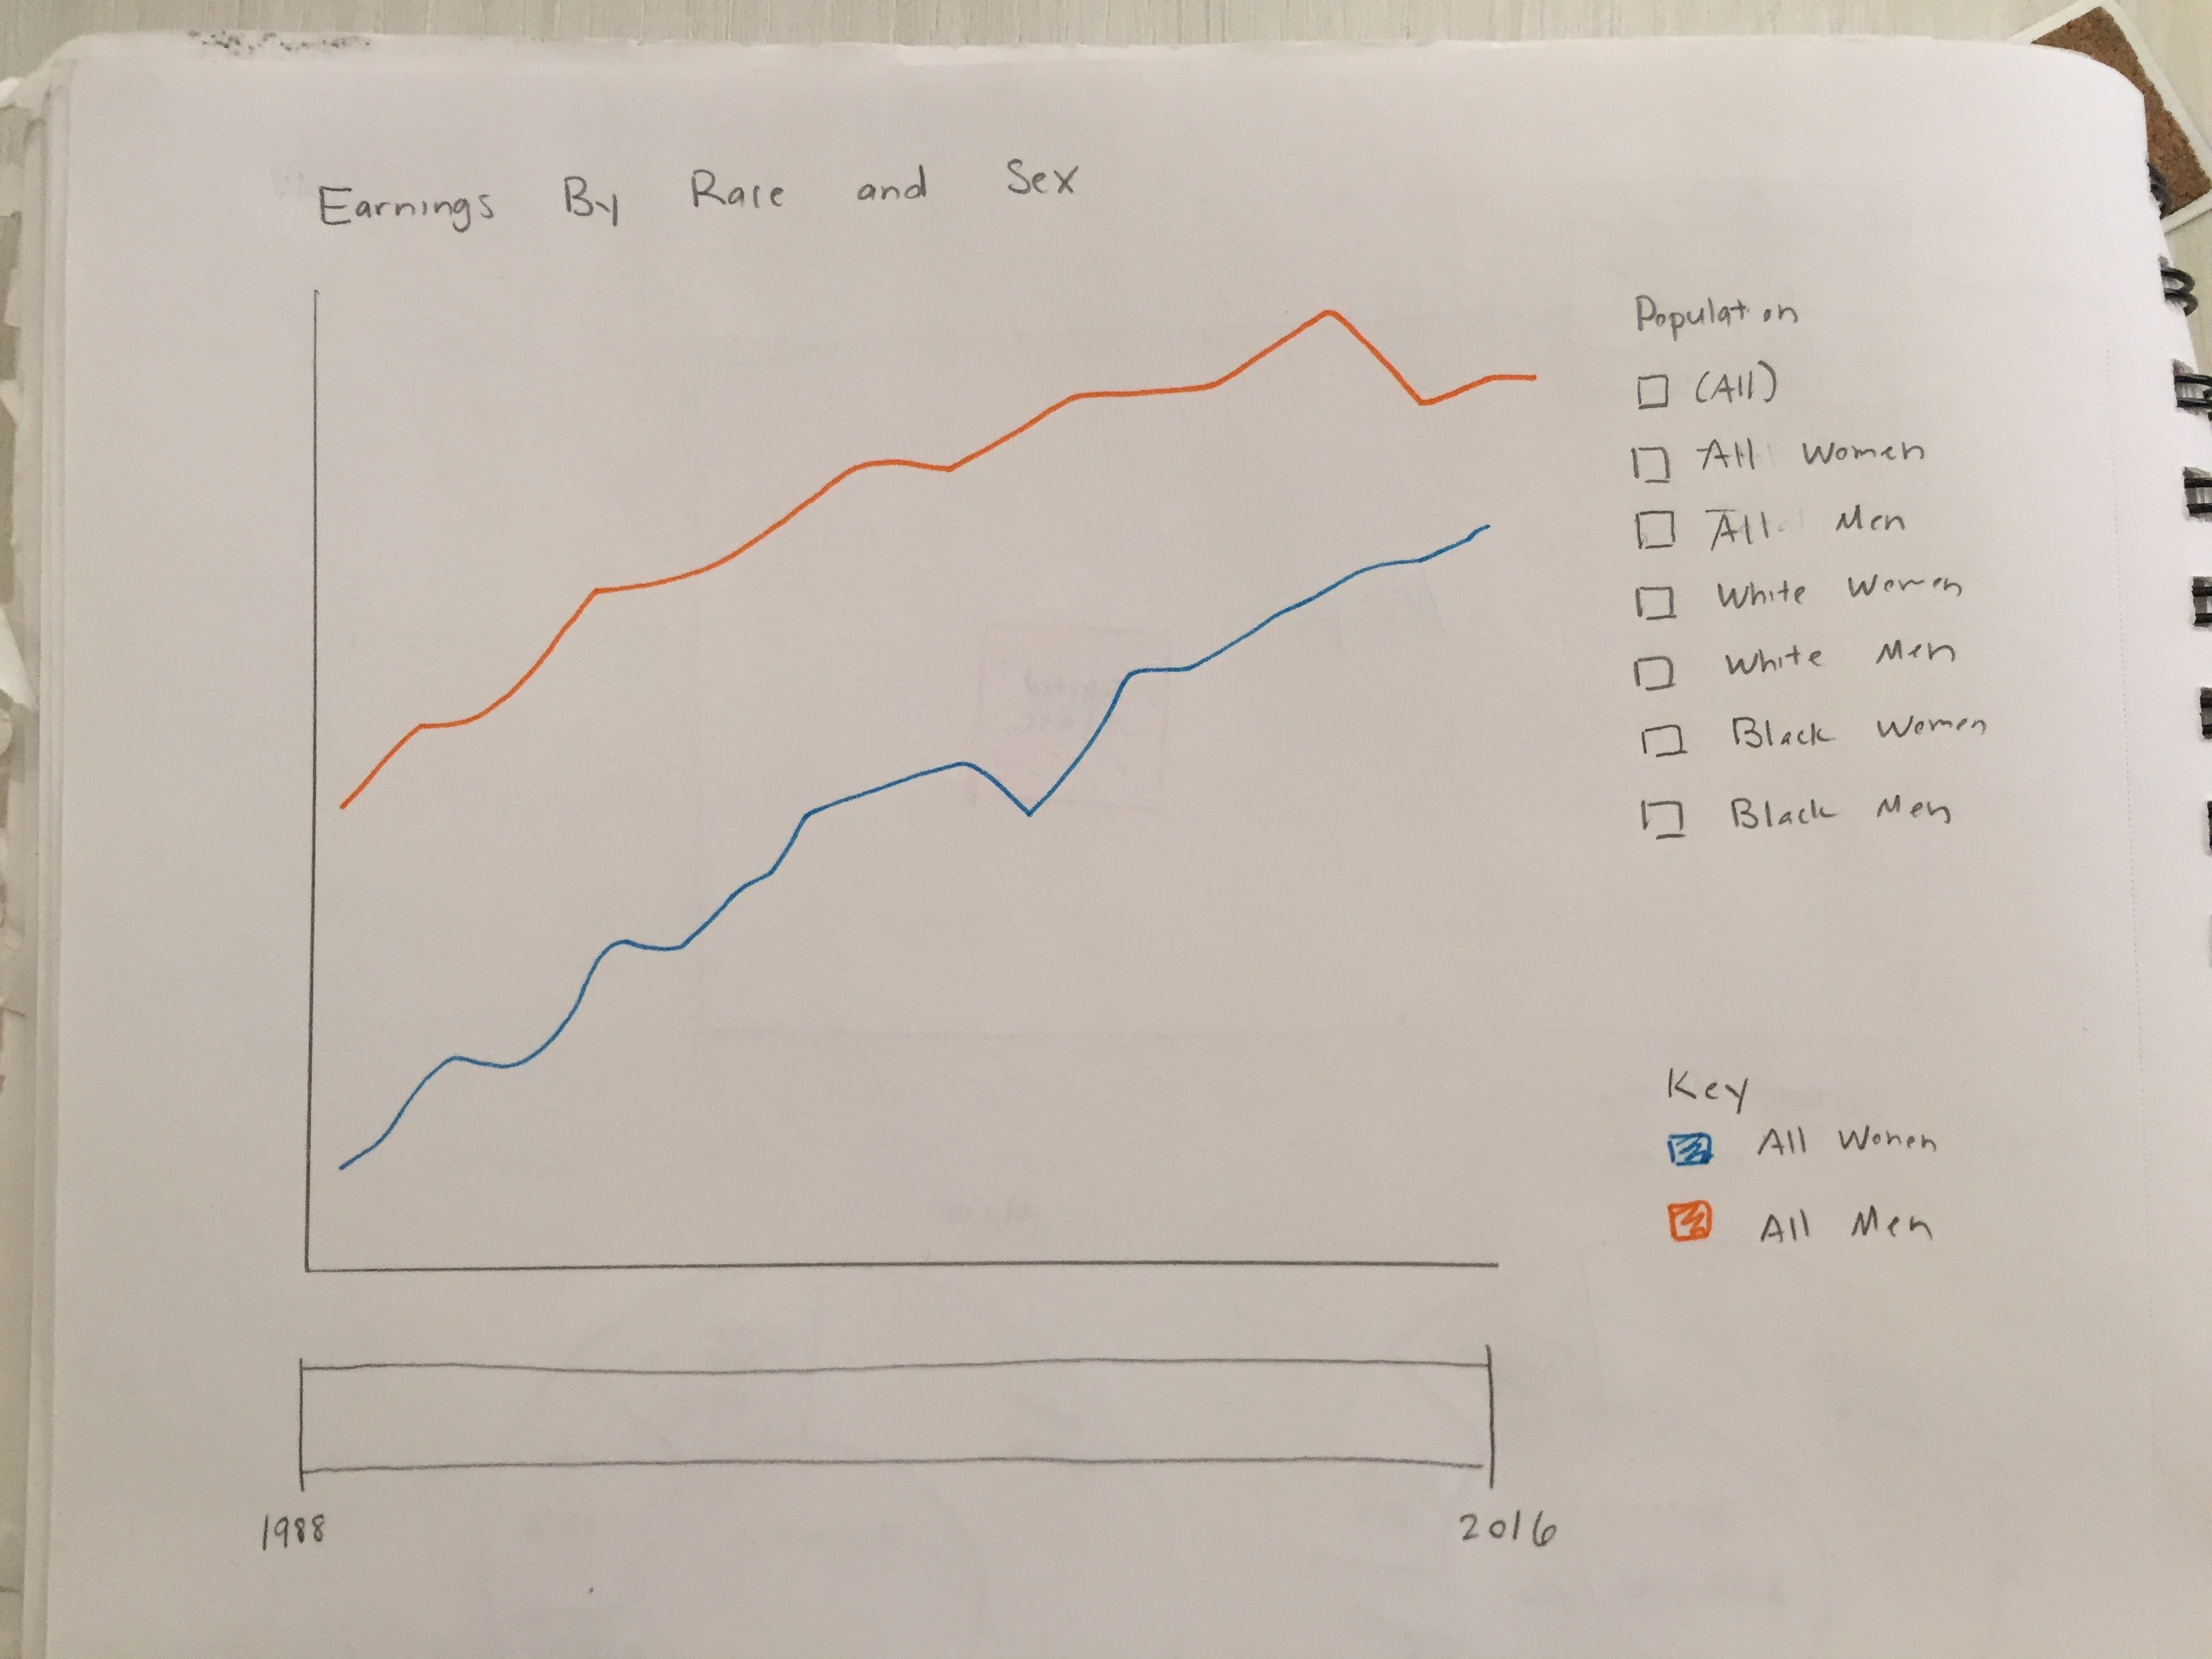
Line Chart: Milestone 1
Our first implementation had a stacked area
chart to display earnings across all races and sex. However,
did not represent data well for users to visualize the trends. Therefore, we decided line chart would be a
better form of visualization. For line chart, initially, we had drop down
displaying
all combinations of race/gender instead of checkboxes. We realized that this did not lend itself to as much
usability,
as to change anything the user would have to go into the dropdown and click another option.
Furthermore, the users had to look at the color of the line and find which race/gender it represented through
the labels
on the bottom. With our data representation, there was some discrepancy on how the data was represented in the
lines which was
fixed in the second iteration of the project implementation.
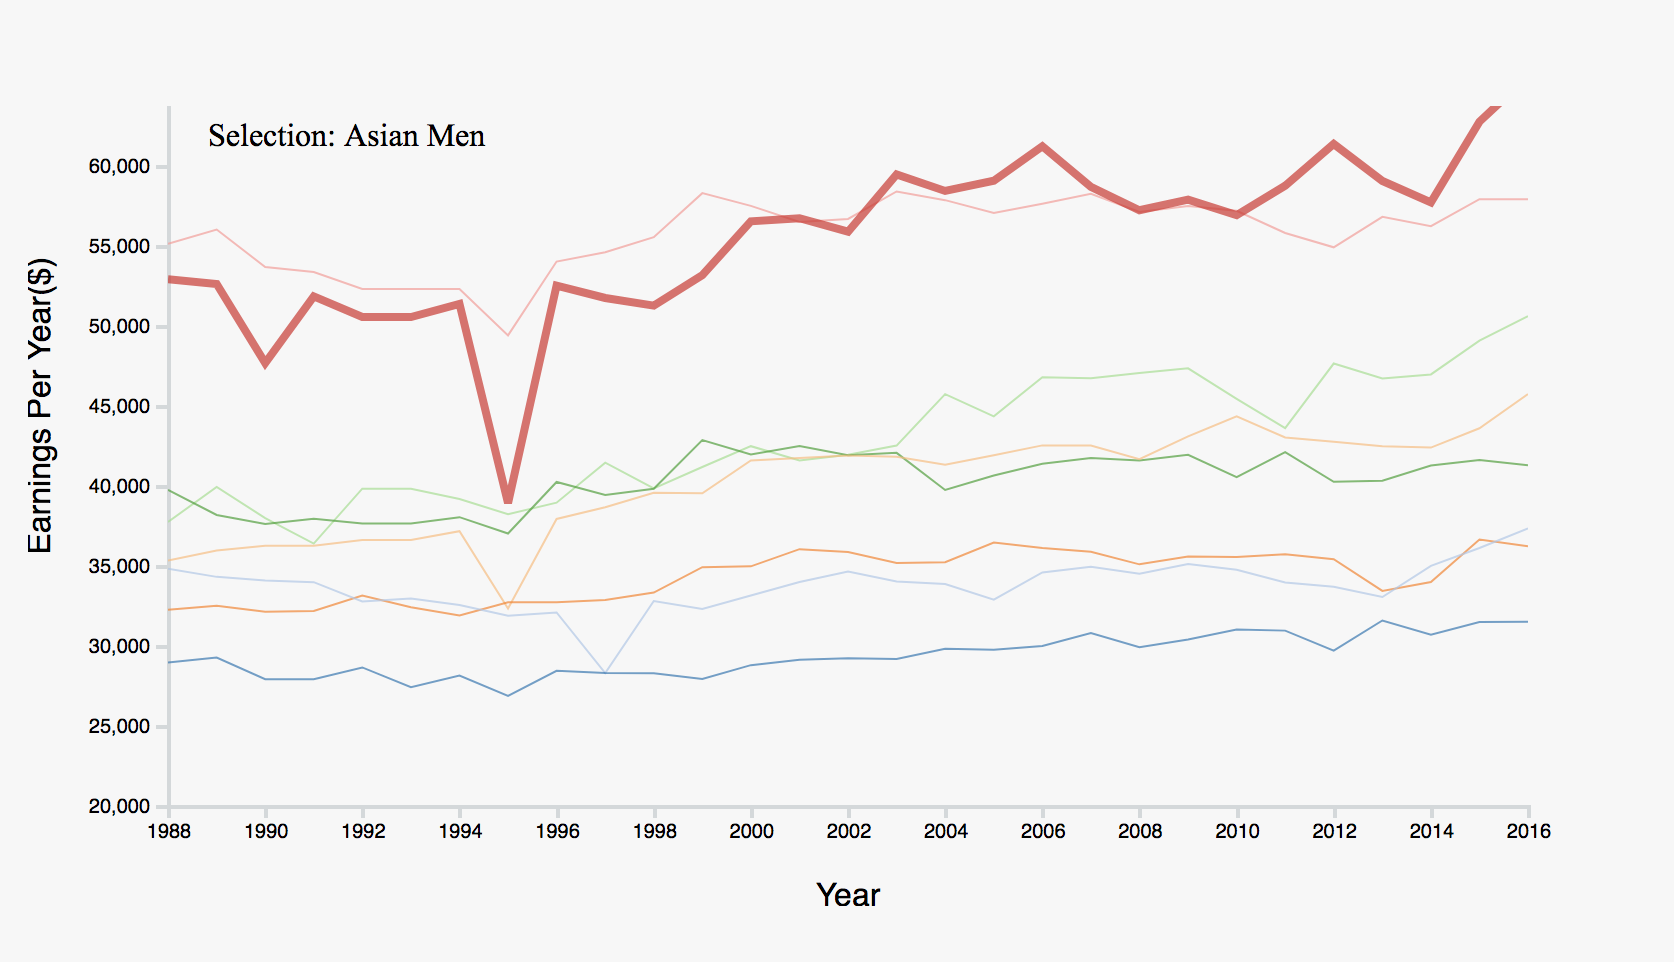
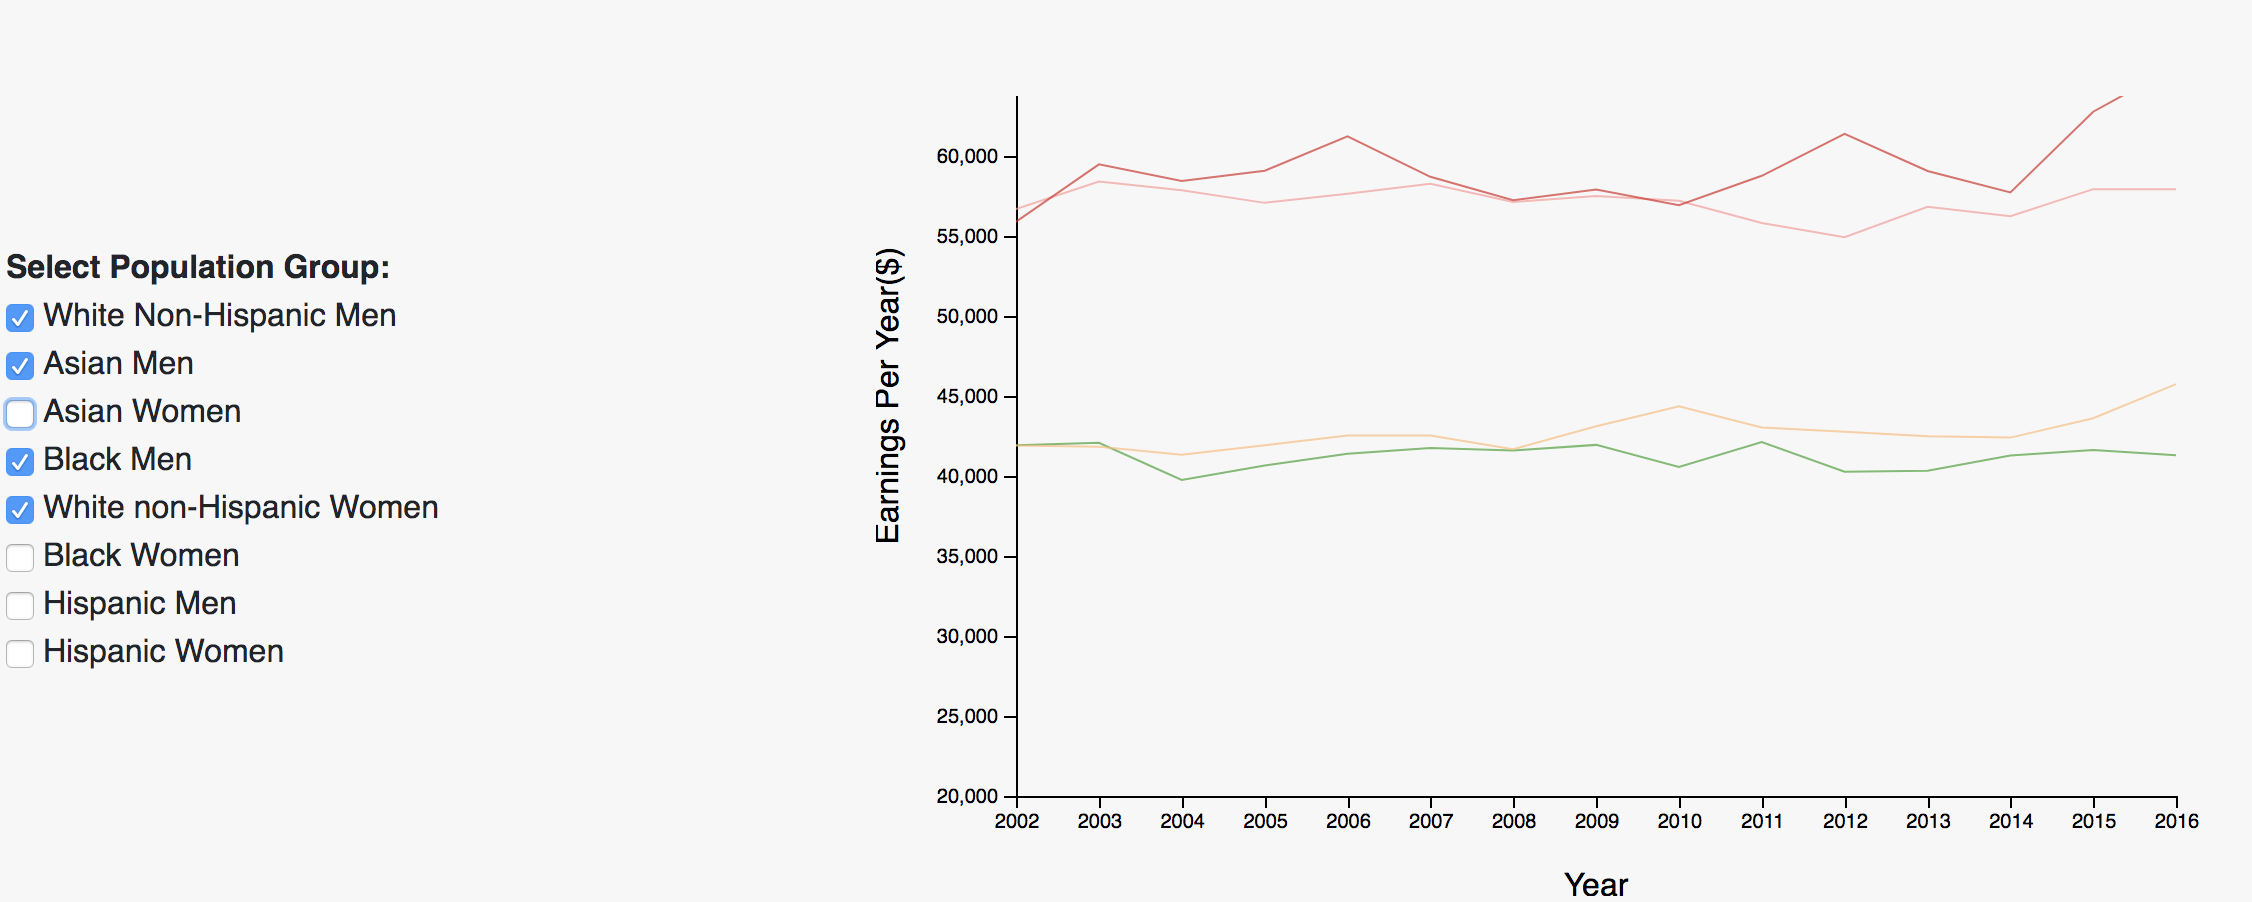
Line Chart: Iteration 2 (after User Testing)
After our first implementation, we realized
that it would be easier for the users to navigate through different lines if they had the
ability to click on a check box for each race/gender group. The checkboxes would be visible at all times,
which would
lead to better usability, as the user is always sure what they have clicked. Therefore, we changed our
dropdown option to
checkboxes.
We also realized that it would be user friendly to add feature where users could hover over the lines and
recognize which race/gender represents that line.
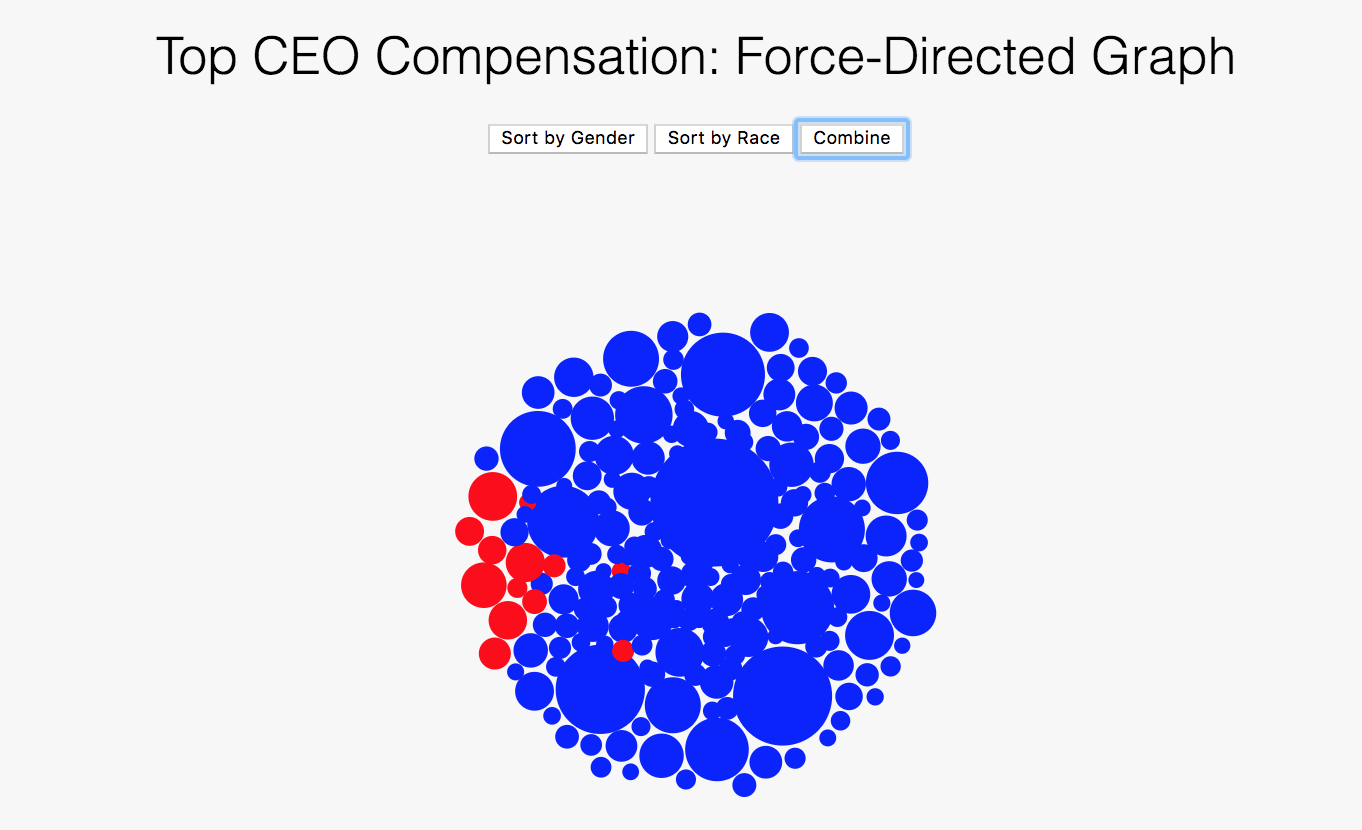
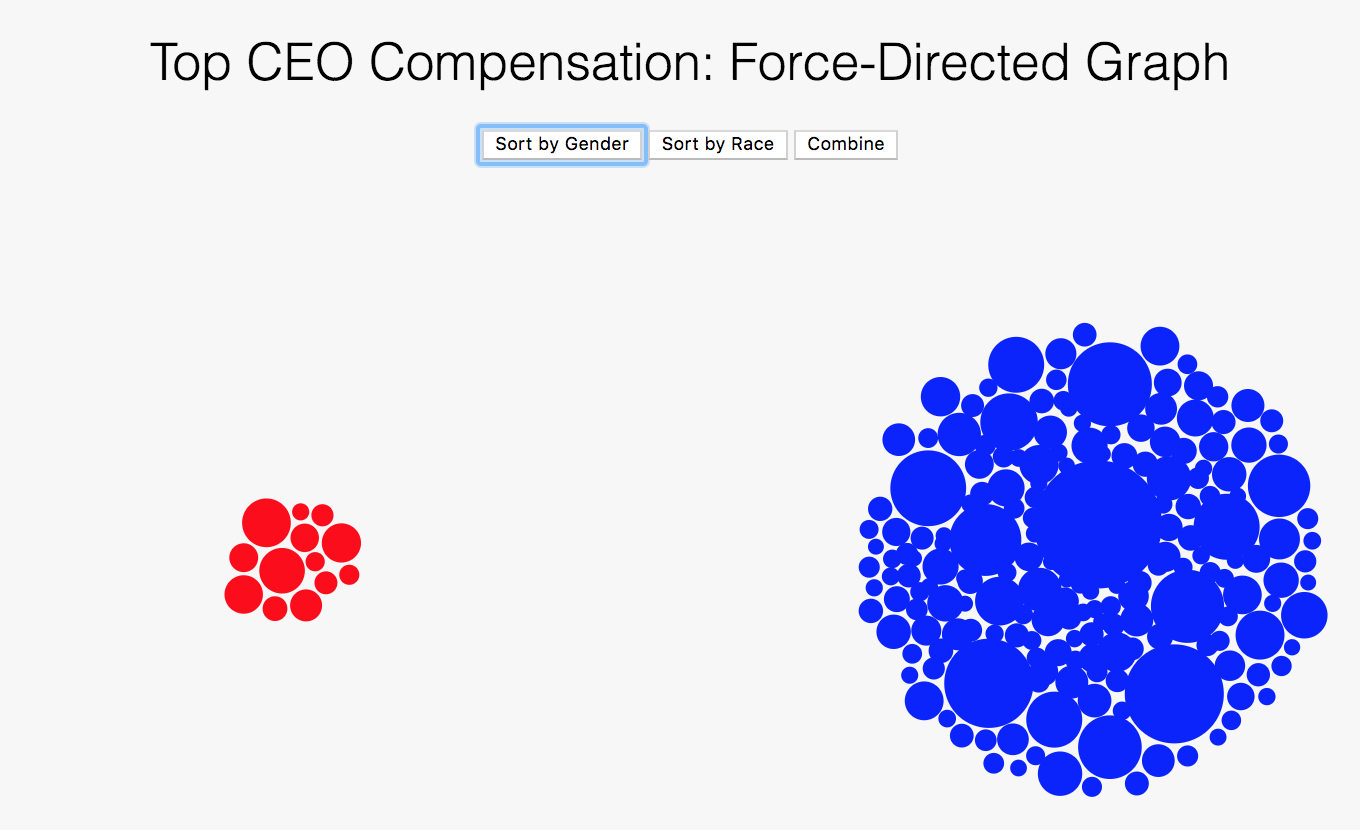
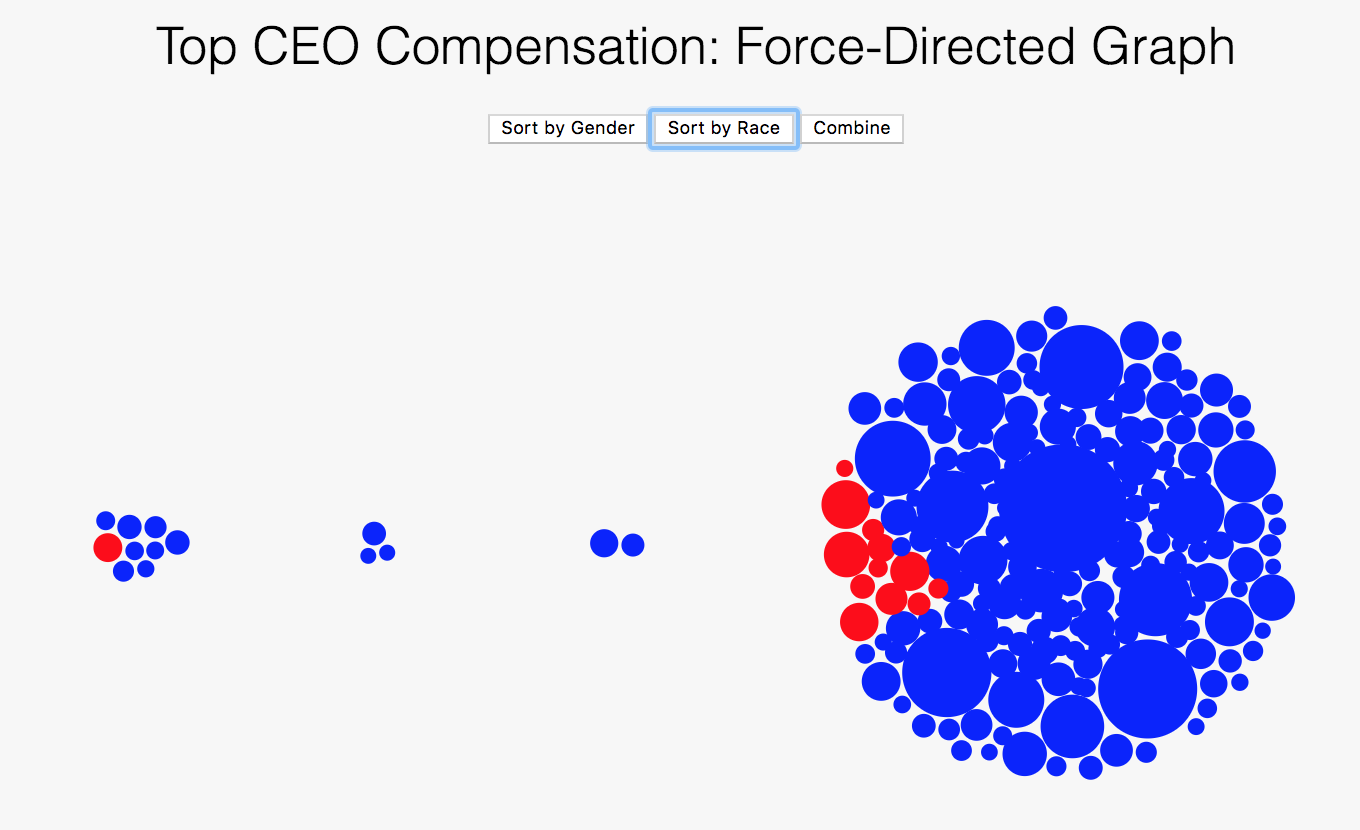
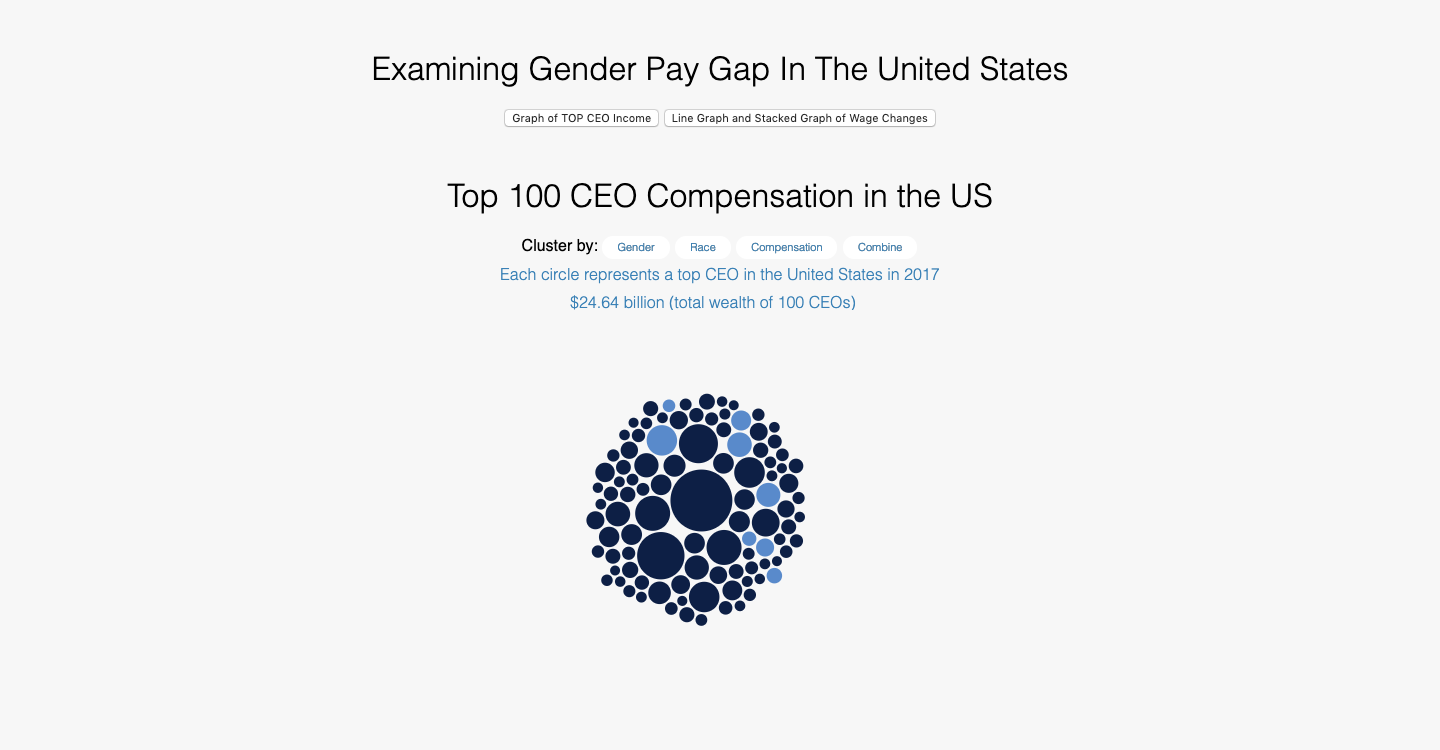
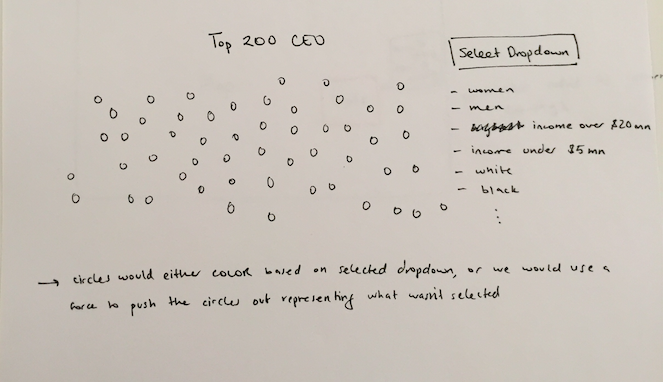
CEO Force Graph: Milestone 1
In the first iteration of design for the
CEO
force graph, the colors were blue and red to represent male and female, and there were only two clustering
options: by
gender and by race.
The force was not working correctly because on any button click, the circles would violently shake and
interact with one another.
In addition, the layout was not visually aesthetic, and neither were the buttons. Users had no way to
click
on or hover over
each circle to understand more about the particular CEO they were interested in. Overall, the
visualization did vaguely what it was supposed to do, but gave the user very little information and was
not aesthetically interesting.
We realized upon talking with Professor
Ottley that we should
unite our visualizations more cohesively. Thus, we all chose the same color scheme and the shaking of
the
circles was fixed.
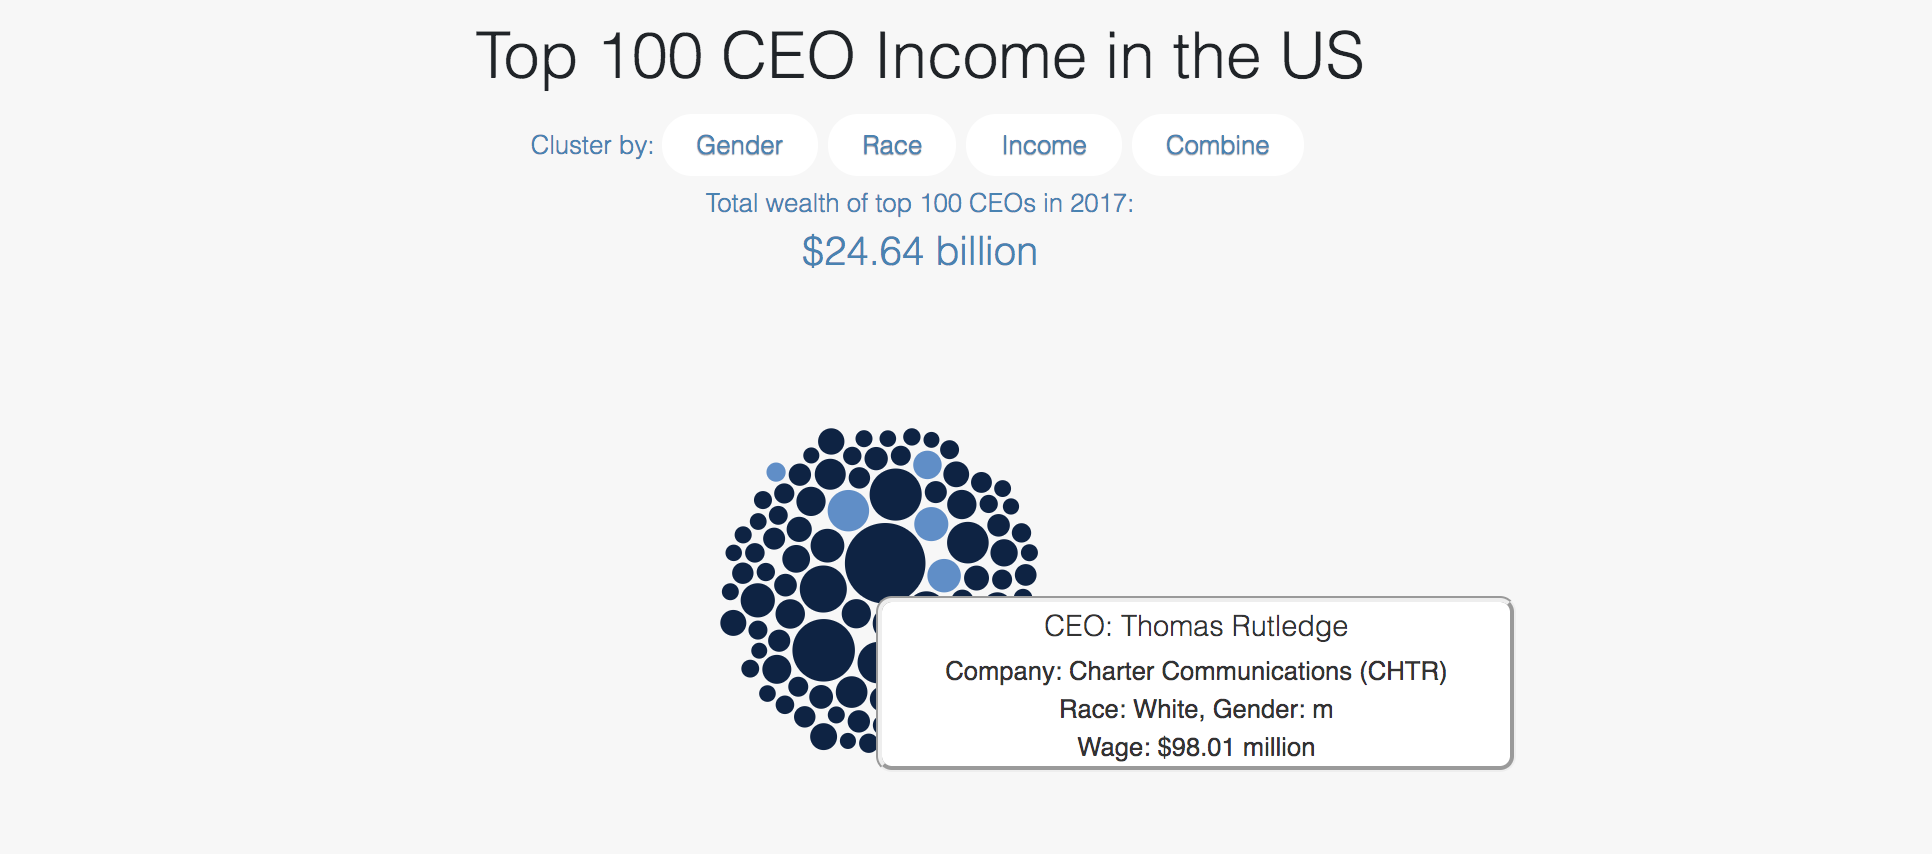
CEO Force Graph: Iteration 2 (after User Testing)
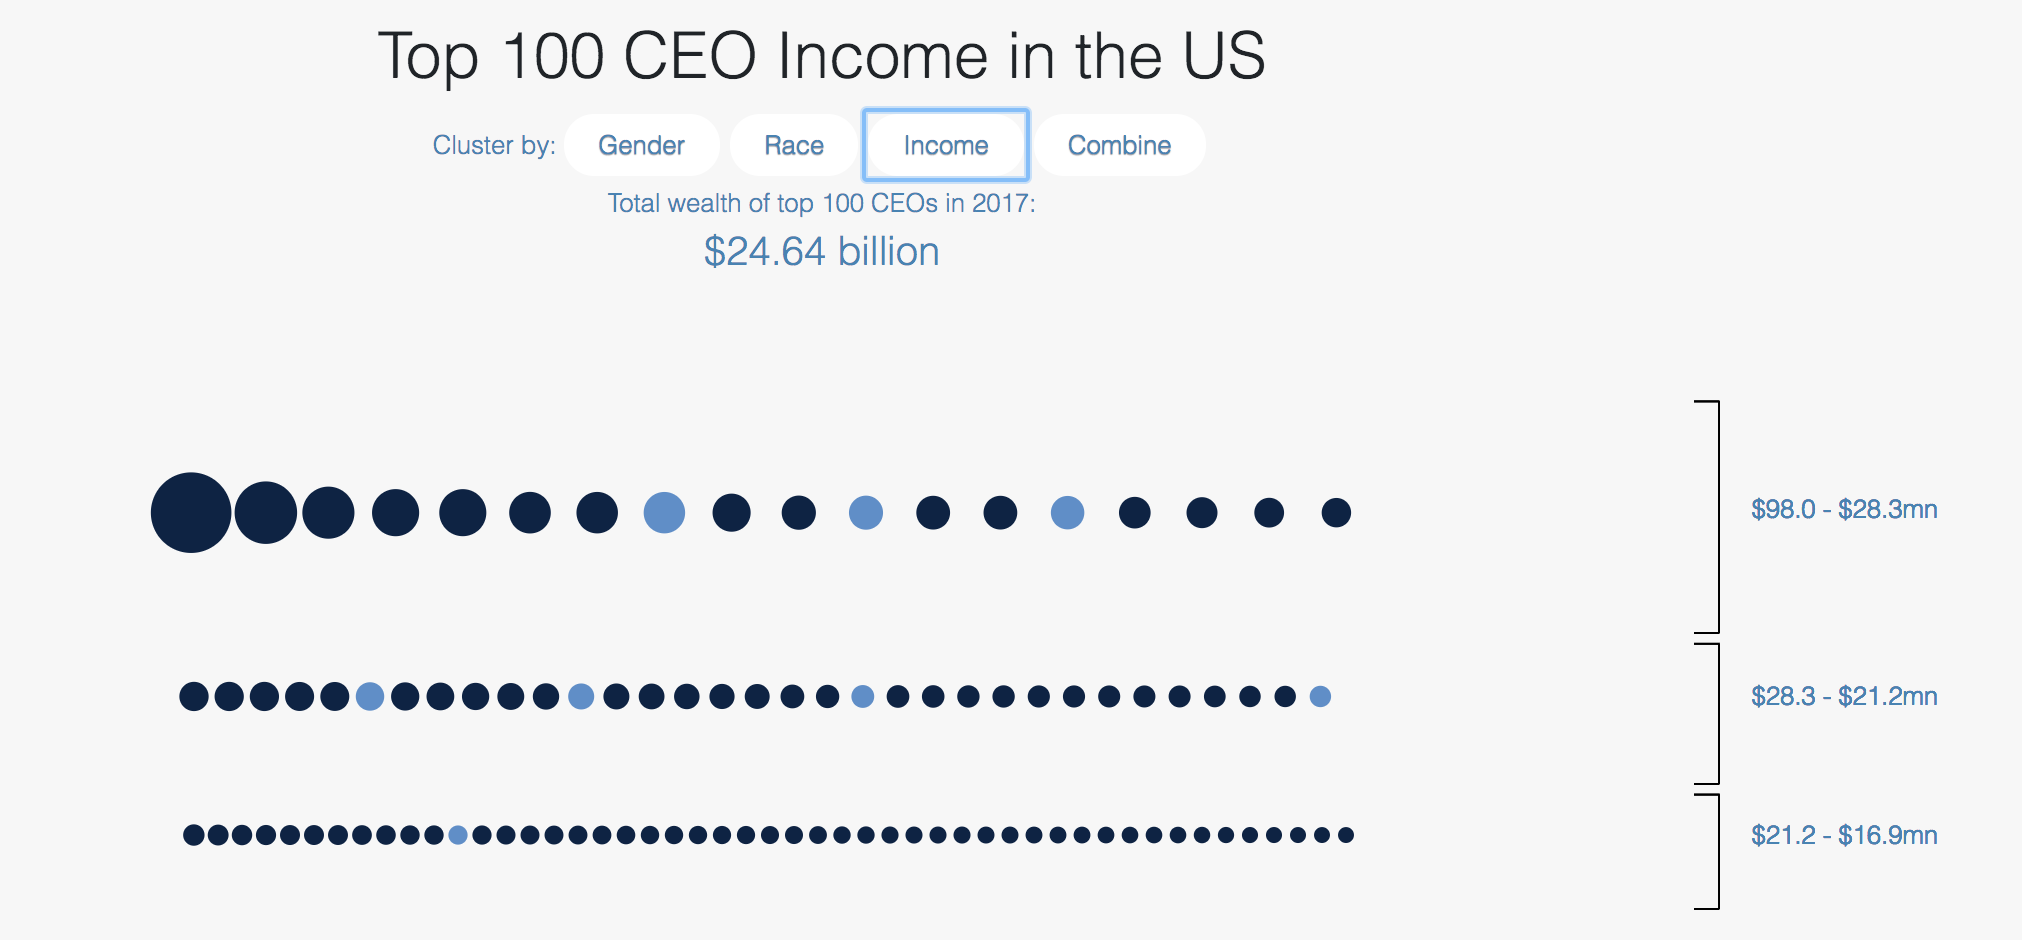
In one of our final implemetations,
on
page load of the CEO force chart, the circles move smoothly into a spread out cluster (the force issue
was fixed). From there, users can click on buttons to cluster the circles by gender, race, and an
added
function, Income. We changed the coloring of the circles to dark and light blue to match the color
scheme of the Map chart, and to increase cohesion of
the visualizations. Styling was added to the buttons to make them more aesthetic, and to make them fit
the
theme of all three visualizations. We also added tooltip hovering to each circle so that users can
better
interact with the visualization and
gain more insight into particular CEOs that they are interested in.
Finally, we created a bracket system to make better use of the data. We realized that the user was
not getting the full effect of how few minorities there were in the data, and how little they were
making when compared to
their white counterparts. Thus, upon click of each of the buttons, the data is split into brackets
based on income.
These brackets are labeled on the right side of the visualization, to provide clarity on where the
data breaks are.
User Testing
Here is what our visualization looked like when we
conducted user testing
Tasks
When we started conducting user testing, we first
had users go through the visuaization by themself
and vocalize any thoughts they had. Then, when users felt they were familiar with the visualization, we
asked them a series of task-based questions to test the usability of our visualization. The tasks were:
MAP VISUALIZATION
- Name a state in which many women receive only up to a high school level of education
- In this state which demographic (by gender and race) makes the most money per year?
- About how much more does this demographic make than those of the same race and opposite gender?
- On average about how much more or less do men make than women?
CEO VISUALIZATION
- In the highest paid CEOs in the United States, how many are women?
- Generally, how much do those women make in comparison to men?
- What is the racial makeup of the top CEOs in the US?
- What are the highest paid and lowest paid racial groups?
LINE PLOT VISUALIZATION
- What is the highest paid income group across all races?
- Which group’s income has been consistently low over the years?
- Which year and group has a sudden change in annual salary?
After the users performed the tasks, we asked for
them to provide feedback
on what they thought worked and and what could be improved.
Testing Conclusions
MAP VISUALIZATION
- Unclear that states could be clicked on
- Add labels to map key so users understand what the colors mean
- Clarify which year's data the map is representing
- Add way to switch back to viewing US overall average income for men and women
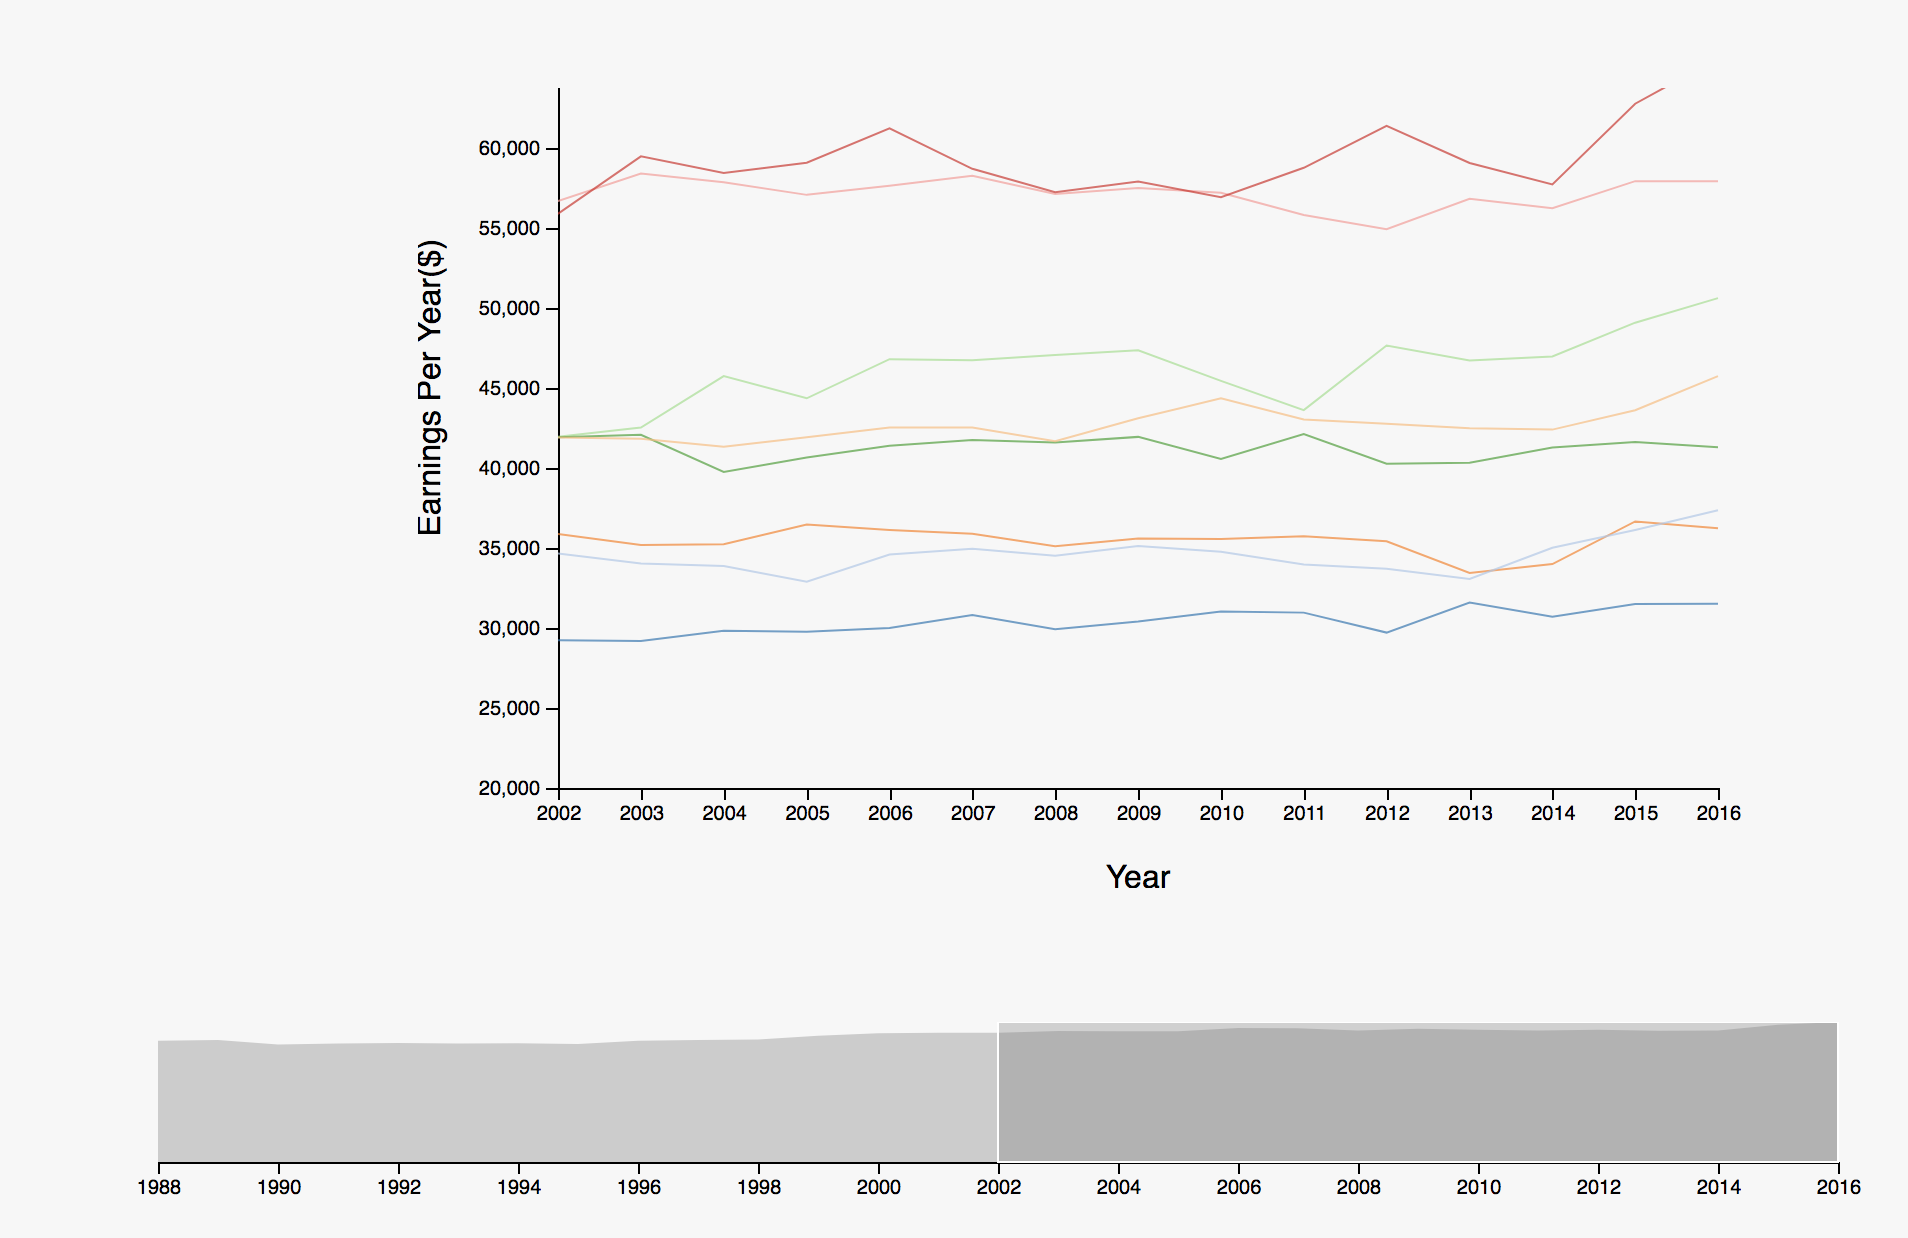
LINE PLOT VISUALIZATION
- Fix brushing so lines don't extend beyond y axis
- Make key verticle to plot rather than horizontal
- Unsure if dropdown is necessary and dropdown is far from the main plot, so it's hard to notice
- Need to fix how data is plotted because it's not displaying properly
- Make plot bigger because it's hard to see and read everything
CEO VISUALIZATION
- Add a tool tip to see details
- Fix force issue
- Unclear what compensation means --> change label instead to "Income"
OVERALL
- Improve cohesion through fixing navigation; make a nav bar rather than buttons (buttons are confusing and
not cohesive)
- Replace onload instructions with paragraphs on page because it's hard to remember the instructions
- Overall pretty intutive
Visualization Refinement
After conducting user testing and receiving user
feedback
we first prioritized what changes needed to be made and worked towards fixing all of the issues we had. For the
map, labels
were added to the key and instructions for how to interact with the visualization were added to the page. For the
CEO Visualization,
tool tips were added and the force issue was resolved. For the line plot, brushing and data were fixed, the key
was changed
to vertically line up with the visualization, and the drop down was changed to check boxes. For overall changes,
we switched the
navigation from buttons to a proper nav bar.
Visualization Insights
After developing our visualization,
we came across some interesting insights when interacting with the completed project.
Map Chart
Based on this visualization, it became
evident that overall men make about $10,000 more than women. In terms of racial groups, Asians on average made the
most
followed by White, Black/Native Americans, and Hispanics. Across most states, the racial breakdown of income
follows the same pattern
for both men and women; however, there appears to be a larger difference between how much men of different races
make compared to
how much women of different races make.
When analyzing women's education in the United
States,
the visualization shows that the Midwest has a lot of women who obtained only up to a high school level of
education. On the
other hand, the East and West coasts had a lot of women who obtained a college degree or higher. We hoped that
there would be
a connection between education and the wage gap; however, there was no relationship seen between the two.
Regardless of each state's
women's education, women still on average made $10,000 less than men.
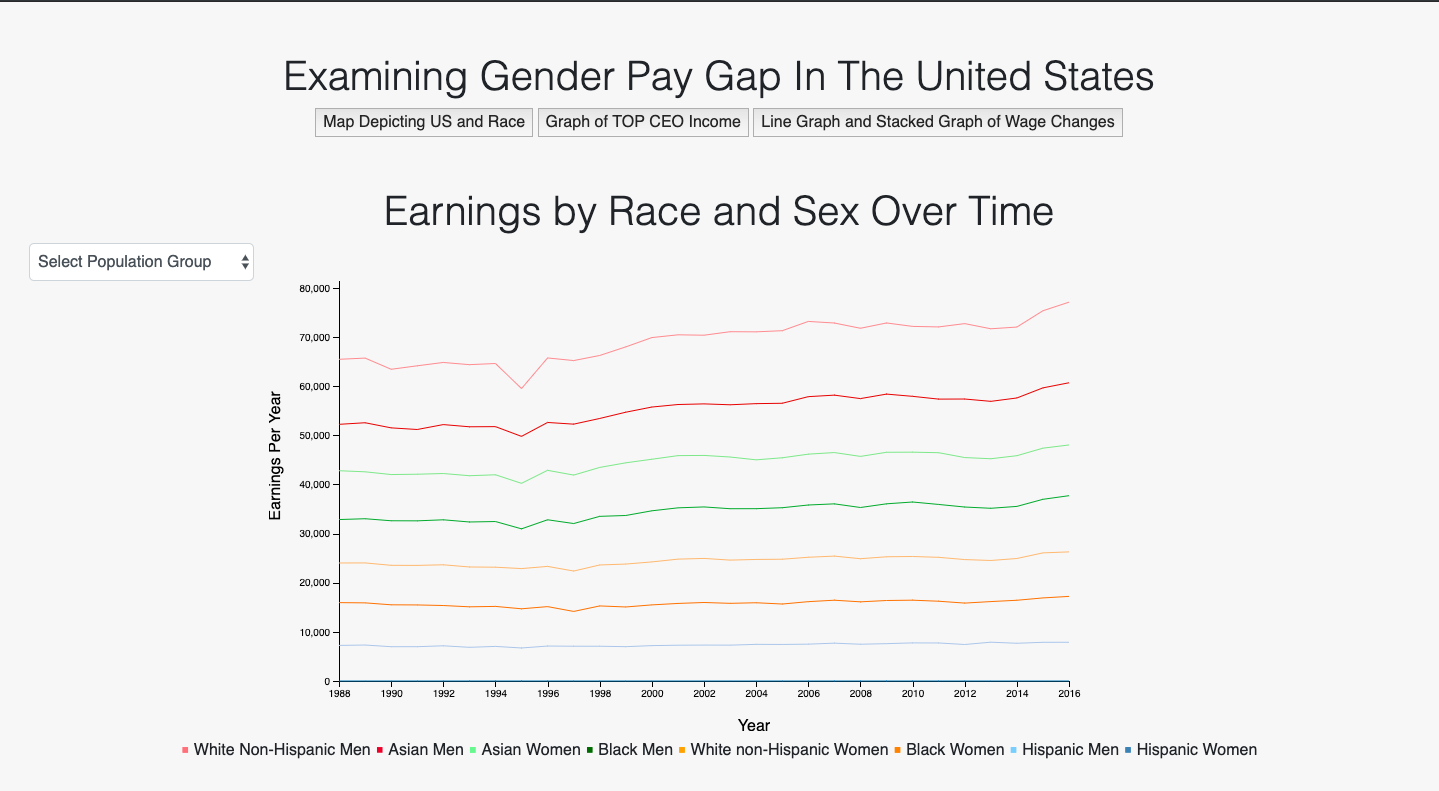
Line Chart
This visualization for wages over race/sex
compares the wages across population from different race
and sex. It gives clear insight on by how much certain US population earns more than the others. Through this
visualization, it was apparent that over the last 2 decades, white men and asian men were the highest earning
population in the United States, whereas, Black women and Hispanic population were the least earning group.
Wage difference between highest earning population and lowest earning population shows that Hispanic women
earn around 50% less than white men. Data from every year shows that female in that group earn way less than
their male counterpart.
CEO Chart
This visualization is significant in that it expandes our understanding of the wage gap to the highest earners
in the United States. It is important to view income levels of the average person (as this is most representative
of the general population), but it is
imperative to also understand what groups of people hold executive leadership positions in companies, and how much
they are paid compared to one another.
In this visualization, it is clear that white
people make up the vast majority of top paid CEOs in the US, and the vast majority of them are male.
Only 8% of top CEOs are women, compared to women being 50% of the general population, which indicates that there
is a long way to go before we reach a more equal system.
In addition, there are very few minorities represented in the highest paid CEOs, and when they are represented,
they earn comparatively less to White males. For example, there are only two black CEOs in 2016, and they make
some of the lowest levels of income. East and South Asians also do not make it into the top 1/3 of income earners
in this elite group. This also ties into our knowledge that in general Asian men
make the most per year by demonstrating that despite Asian men's average higher income, they still hold fewer
executive positions than White males.
How Can We Further Improve the Visualizations?
In general, we could have better cohesion and transitions between visualizations. Though the connection is pretty
obvious (women and wage gap), we could do more with connecting and uniting the story. On a visual level, however,
we are satisfied with how united they are.
MAP VISUALIZATION : Because the women's education coloring of the map did not generate any interesting insights
on the relationship between education and the wage gap, if there was more time we would like to explore
if there is a relationship between the education ratio between men and women and the gender wage gap and
a relationship between education levels obtained by different races and the race wage gap. It would also be
interesting to explore which industries peopel of different genders and races go into and how that impacts
their income.
LINE VISUALIZATION : With how the json was setup, it was difficult to use hover-over function to
display salaries over the years for all lines in the chart. This would have been a useful feature for the user
if they wanted to know the salary amount without having to look at the y-axis to figure out the salary by themselves.
Since we have data set for almost 20 years, we also could implement some kind of predictive model to predict how
the wage gap would look like after 5 years.
CEO VISUALIZATION: Many hours were spent trying and failing to create a toggle bar between year 2013 and 2016 for
the data, so the user could do a comparison by year on how the wage gap situation has changed with top executives.
With more time, we would have successfully implemented a toggle or checkbox system where users can interact with
multiple years' data. In addition, a more mathematical approach can be taken to calculating the brackets, but for
immediate visual effect, we chose to bracket them according to three equal lines. With more datasets, it would be
more efficient to have such a mathematical equation, and thus we would implement that in the future.