Our initial motivation for this project came from our teammate David Lie-Tjauw, who spent last summer living in
the
heart of NYC. During his time there, he experienced NYC's problems with sky-high rent, gentrified
neighborhoods, and bias towards the wealthy. This spurred him to bring his insights back to campus.
We believe that gentrification is an issue that can impact everybody, not just those who live in dense cities.
Not only can it lead to higher costs of living, but it also has the power to negatively impact those who come from
lower
incomes and marginalized communities. In this project, we are specifically focusing on NYC because of their vast
amount of open, high-quality data that they have collected over the years.
It’s no debate that gentrification is transforming New York City everyday. The question, however, is whether or
not
gentrification is hurting or improving the lives of the city’s 8 million inhabitants. This question has been the
source of endless debate as city officials try to decide on the best urban legislation for their constituents. To
add productive commentary to this debate, we aim to show the impact of gentrification based on different key data
points, such as income, demographics, poverty, and population. This project will serve to educate the common
public
about gentrification and hopefully inspire them to understand the impact of gentrification in their own
communities.
Related Work
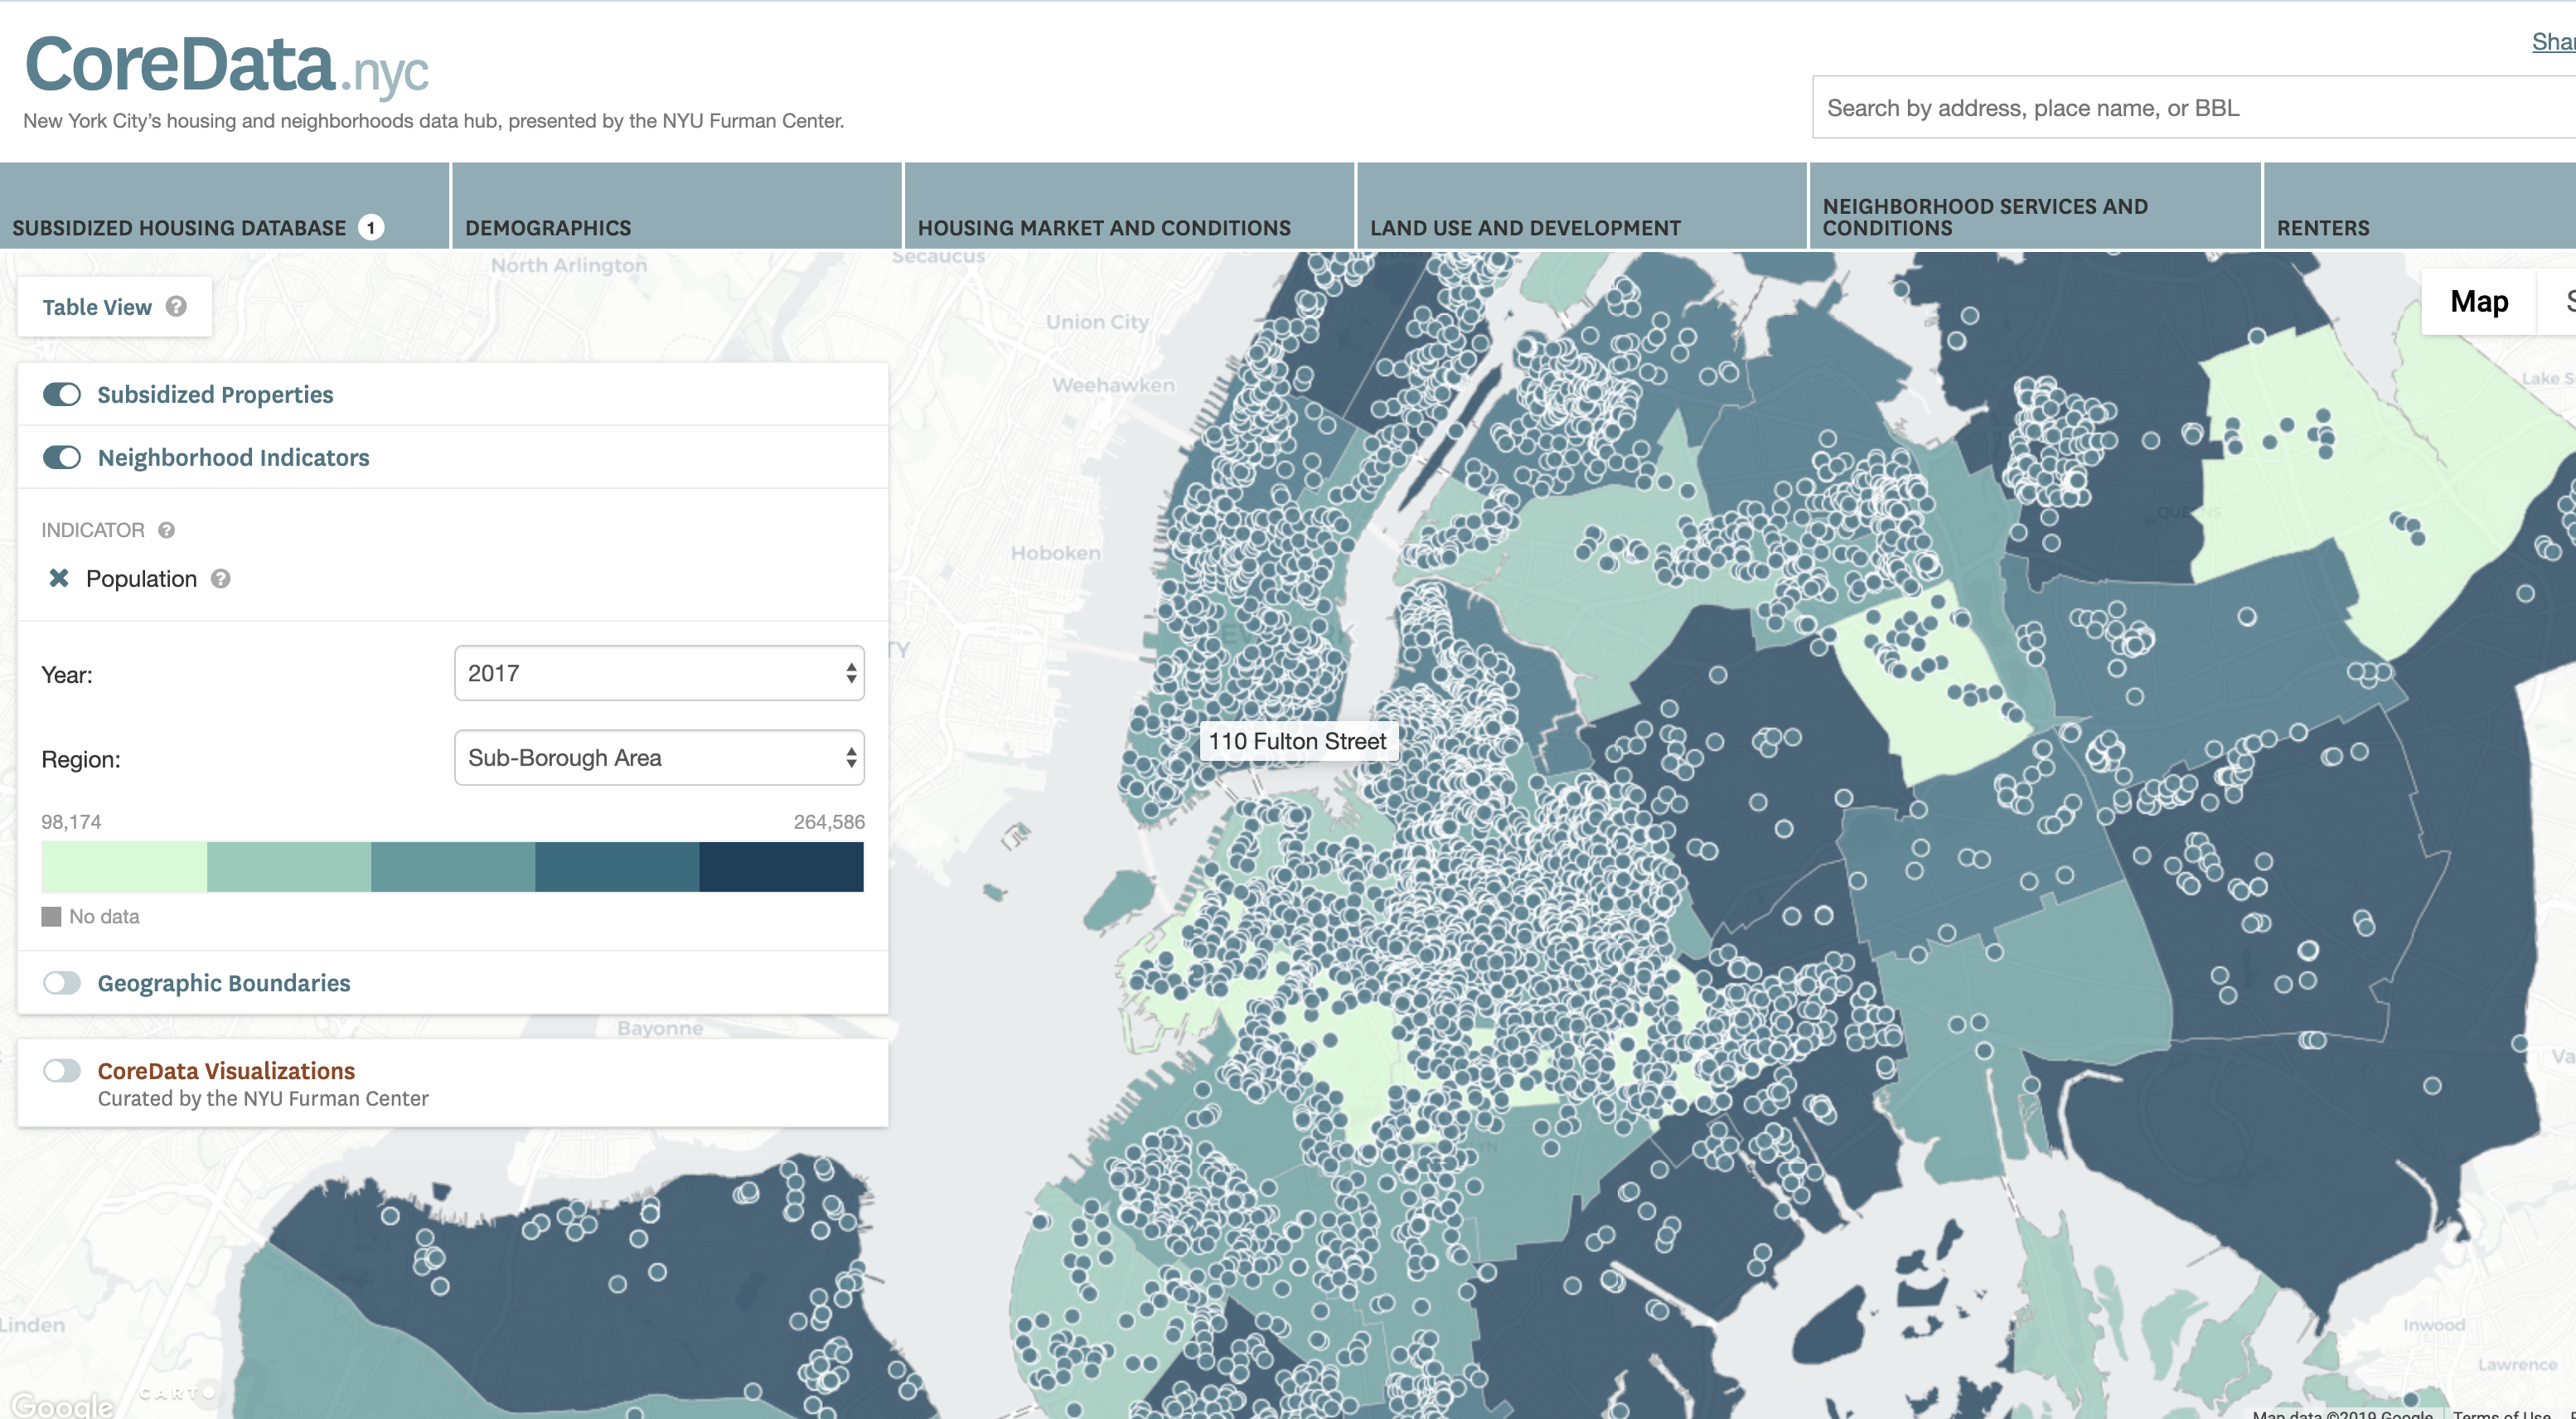
One project that inspired our visualization was the work from the NYU Furman Center, whose aim is to advance
research and
debate on housing, neighborhoods, and urban
policy. They created CoreData.NYC, which is a platform that makes housing and neighborhood data from
NYC availavble to the public. Particularly, the CoreData.nyc website allows
users
to
not only view and
download
datasets, but they also
provide a visual mapping of NYC that colors the different subboroughs different shades of colors depending on the
values of whatever attributes (ex. median income, population, etc.) a user is looking at. Drawing from this
visualization, we felt that the website might even provide TOO MUCH information to the common everyday visitor and
that this could be simplified more. This also motivated us to figure out how to use a map of NYC to illustrate
which subboroughs were experiencing more gentrification compared to others. We later came up with the idea to
calculate "gentrification scores" to show this.
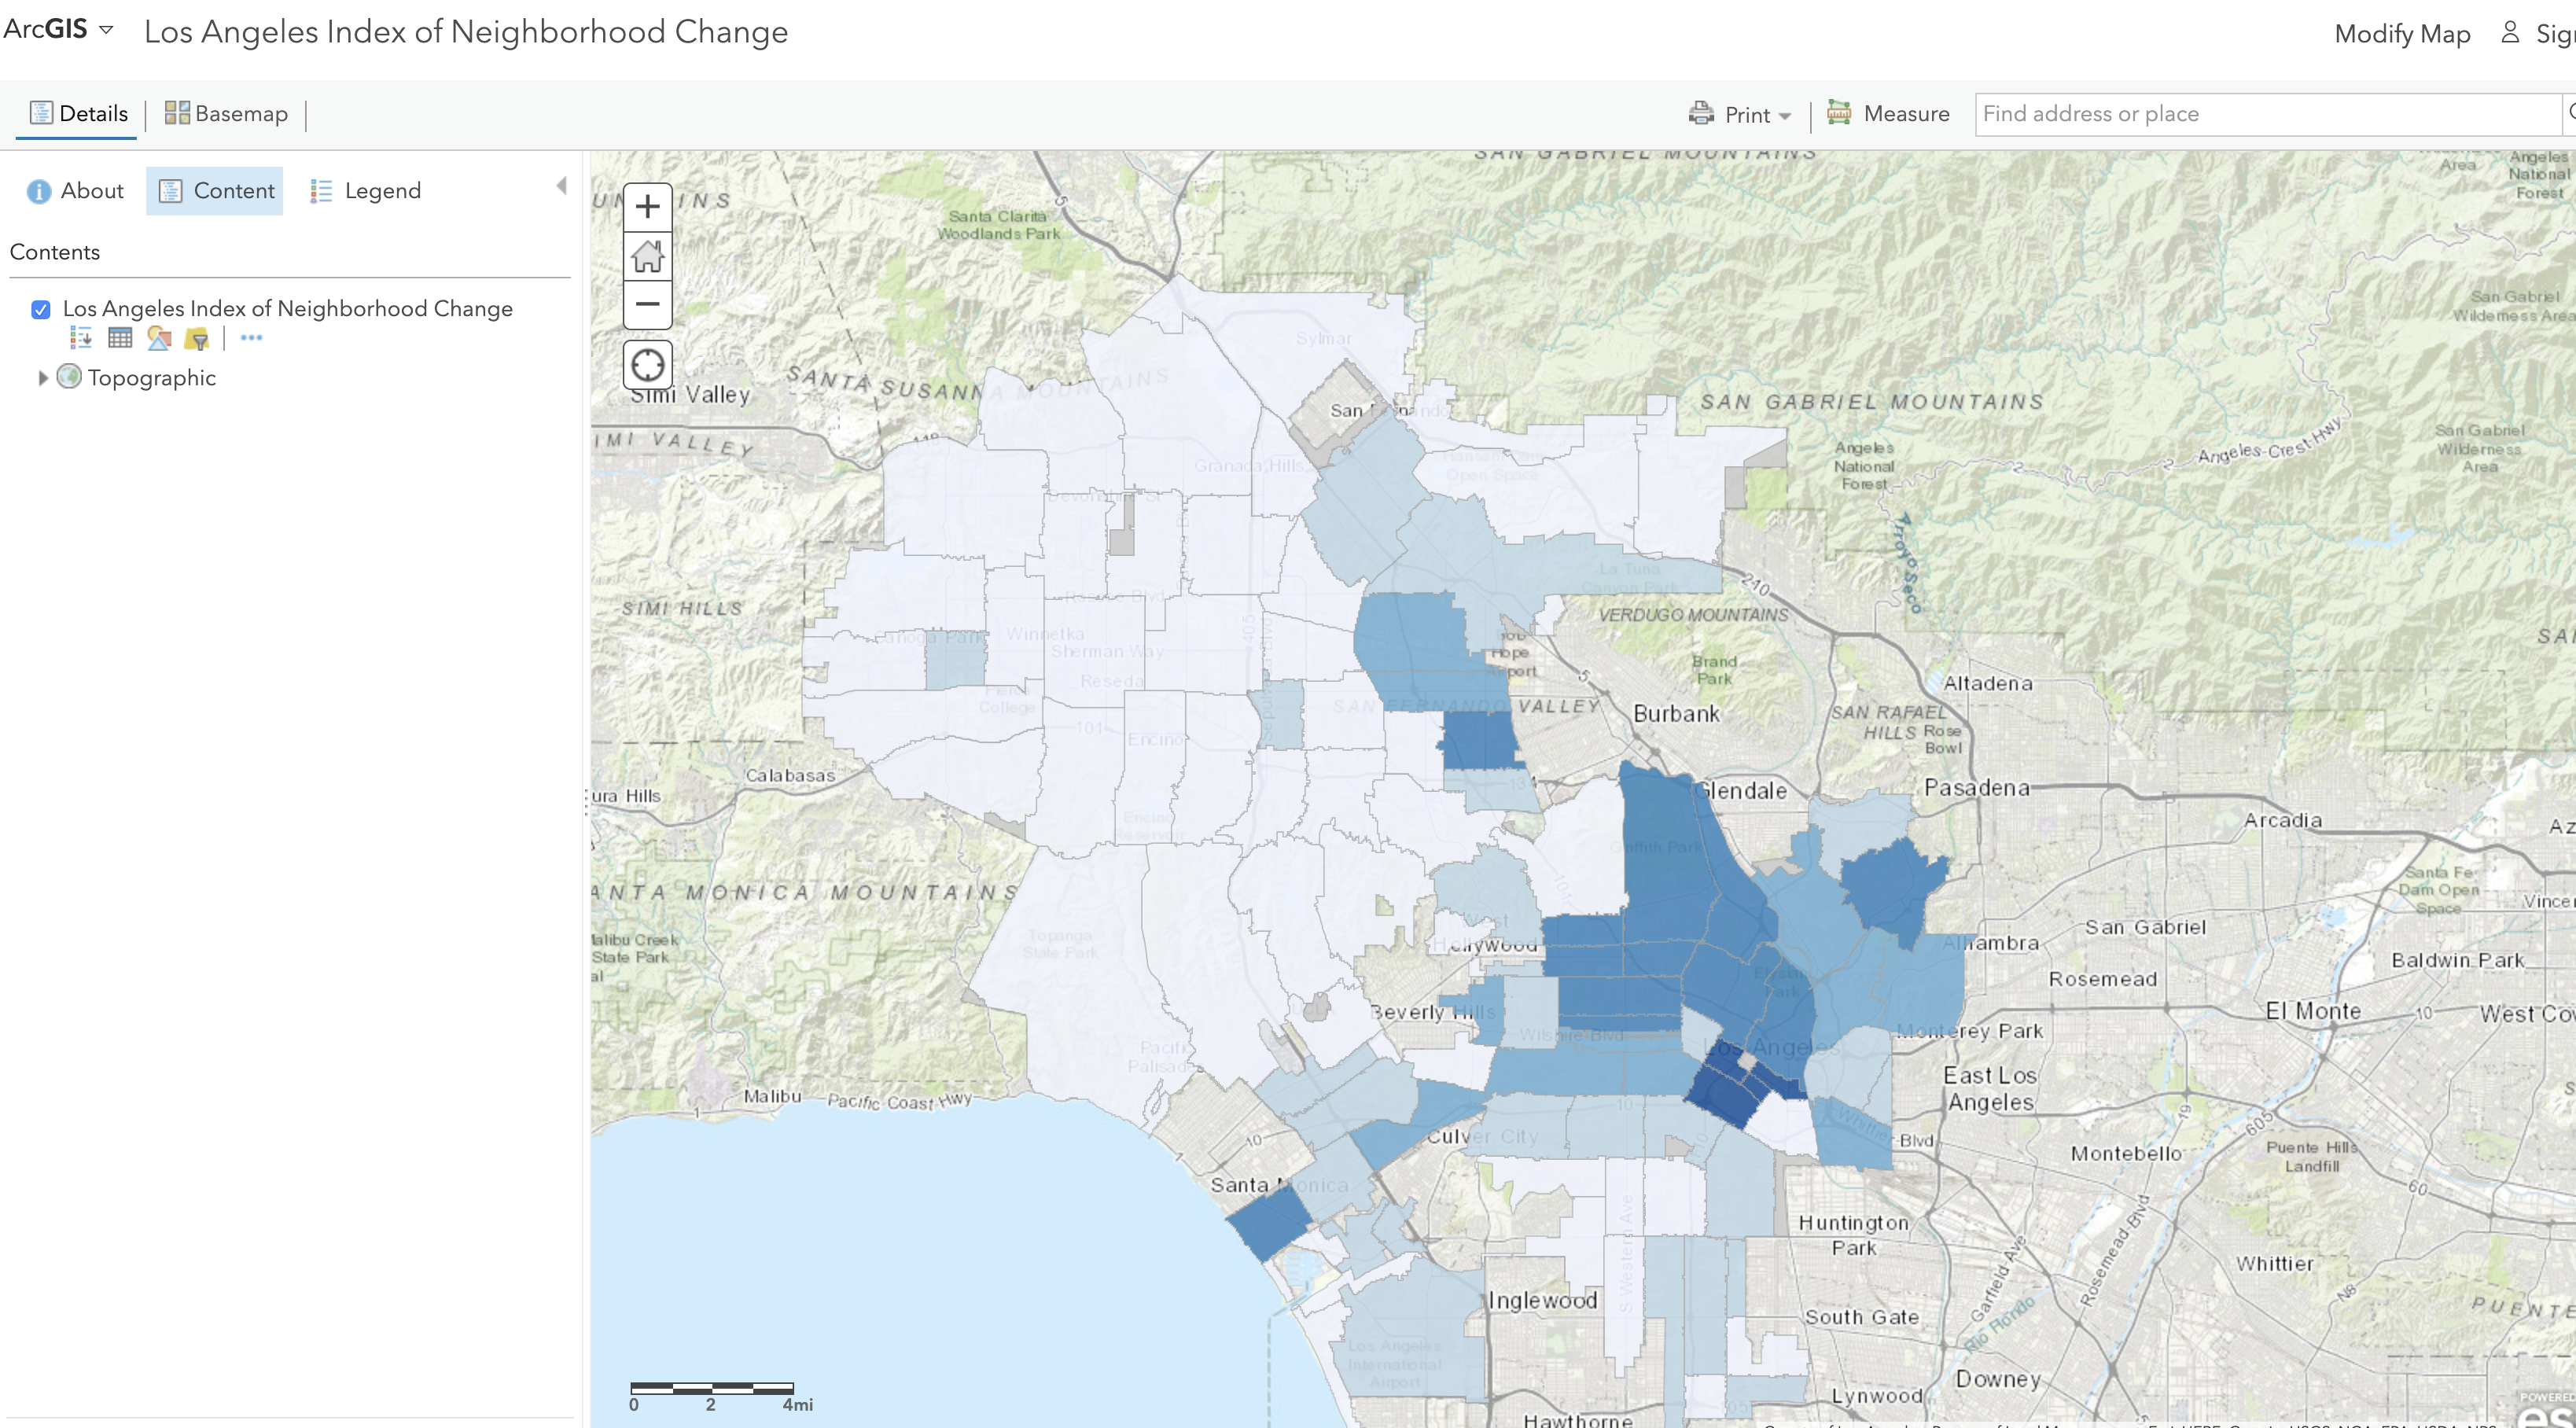
Another project we drew inspiration from was a visualization made by the City of Los Angeles called "Los
Angeles Index of Neighborhood Change". Using publicly collected city data, the project colors the
neighborhoods
of LA
different shades of color, depending on how much neighborhood change is occurring. Naturally, we wanted to learn
more, so we contacted Alex Pudlin of the City of LA who sent us the team's whitepaper that
describes how they aggregated gentrification data to color encode a map of LA. According to the whitepaper, the
"scores" are an aggregate of six demographic measures indicative of gentrification. We used this as inspiration
for calculating "gentrification scores" for our visualization.
The Questions Our Project Aims to Answer
Questions before our project
How has gentrification changed in NYC over time?
How can we visualize gentrification in NYC?
What are some metrics that might have been impacted by gentrification?
Does gentrification have a positive or negative impact on NYC over time?
What attributes might best reflect the presence of gentrification in a subborough?
New questions we considered throughout our project:
How did the 2008 recession affect NYC?
What we want to accomplish
Mainly, we seek to build a competent visualization that enables people to explore gentrification across
different neighborhoods over time in NYC. By doing this, we hope that our work will spark new insight into the
ongoing debate over the effects of gentrification on the people of NYC and beyond.
Benefits
The debate over gentrification has some people against gentrification while others are for it. Our
visualization
seeks to inspire additional commentary in this ongoing debate by showing people the different ways in which
gentrification may affect residents in gentrified areas
Data
Our data comes from the NYU Furman Center, which "advances research and
debate on housing, neighborhoods, and urban
policy". They created CoreData.nyc to make housing and neighborhood data
available to the public. Below, you will find the specific datasets we downloaded:
In reality, there are many contributing factors for gentrification, and there is not usually any one sole reason
for why a neighborhood has become gentrified. That being said, we spent time researching gentrification and its
effects in order to identify "indicators" of gentrification that are often associated with the rise of
gentrification. These are our main sources:
Even though most of our data comes from the same source, different pieces of data are found in separate files
from
each other throughout CoreData.nyc. Data processing will be implemented by individually parsing the separate files
and combining the
relevant data into one monolithic data source in order to make it easier for us to work with the data in D3. This
is done using python.
In our project, we encode the map of NYC with different shades of color, where darker colors are meant to indicate
more gentrification happening compared to lighter colored subboroughs. These colors are chosen based off the
"gentrification score" of whatever attribute(s) are selected. In order to calculate the gentrification score
for an attribute, we
first normalize the values of each attribute for each year so
that its values
would
fall within [0,1]. We normalized values according to this equation:
where X is the value for a specific year being normalized, X_min is the smallest attribute value
throughout all years
and subboroughs, X_max is the largest attribute value throughout all years and subboroughs, and X'
is the attribute's normalized value for a specific year.
To determine the gentrification score from a single attribute, we then sum up all the
attribute's normalized values throughout all available years. When two attributes are selected, we simply sum up
the gentrification scores of both attributes. This value is then applied to our color scale so that lower
gentrification scores for a subborough will cause its coloring to be lighter than another subborough with a higher
gentrification score.
To see our jupyter notebook used to parse and clean the data, click here
Exploratory Data Analysis
Initially, we used NYU Furman Center's CoreData.nyc website to look at the
available
data about NYC. Like we described earlier, the website shows a map of NYC and colors the different subboroughs
different shades of color depending on what data we are looking at. This largely motivated us to also incorporate
an
interactive map
of NYC in our visualization, as it provided the right functionality needed for users to analyze data from specific
subboroughs.
Visualization Design
Must-Have Features:
Interactive map of NYC that visualizes GeoJSON of boroughs, sub-boroughs, or other districts
The ability to select the gentrification attribute(s) that you are most interested in
Showing how certain attribute(s) have changed over time
Optional Features:
Ability to compare the education attributes of different sub-boroughs/boroughs
Include other types of data related to the indirect effects of gentrification
Visualize educational data alongside gentrification data
Certain features of our datasets are telltale signs of gentrification (e.g. housing prices and income of an
area), so it could be useful to show how much these features have changed overtime along with the education data
like test scores, graduation rates, etc.
Initial Designs
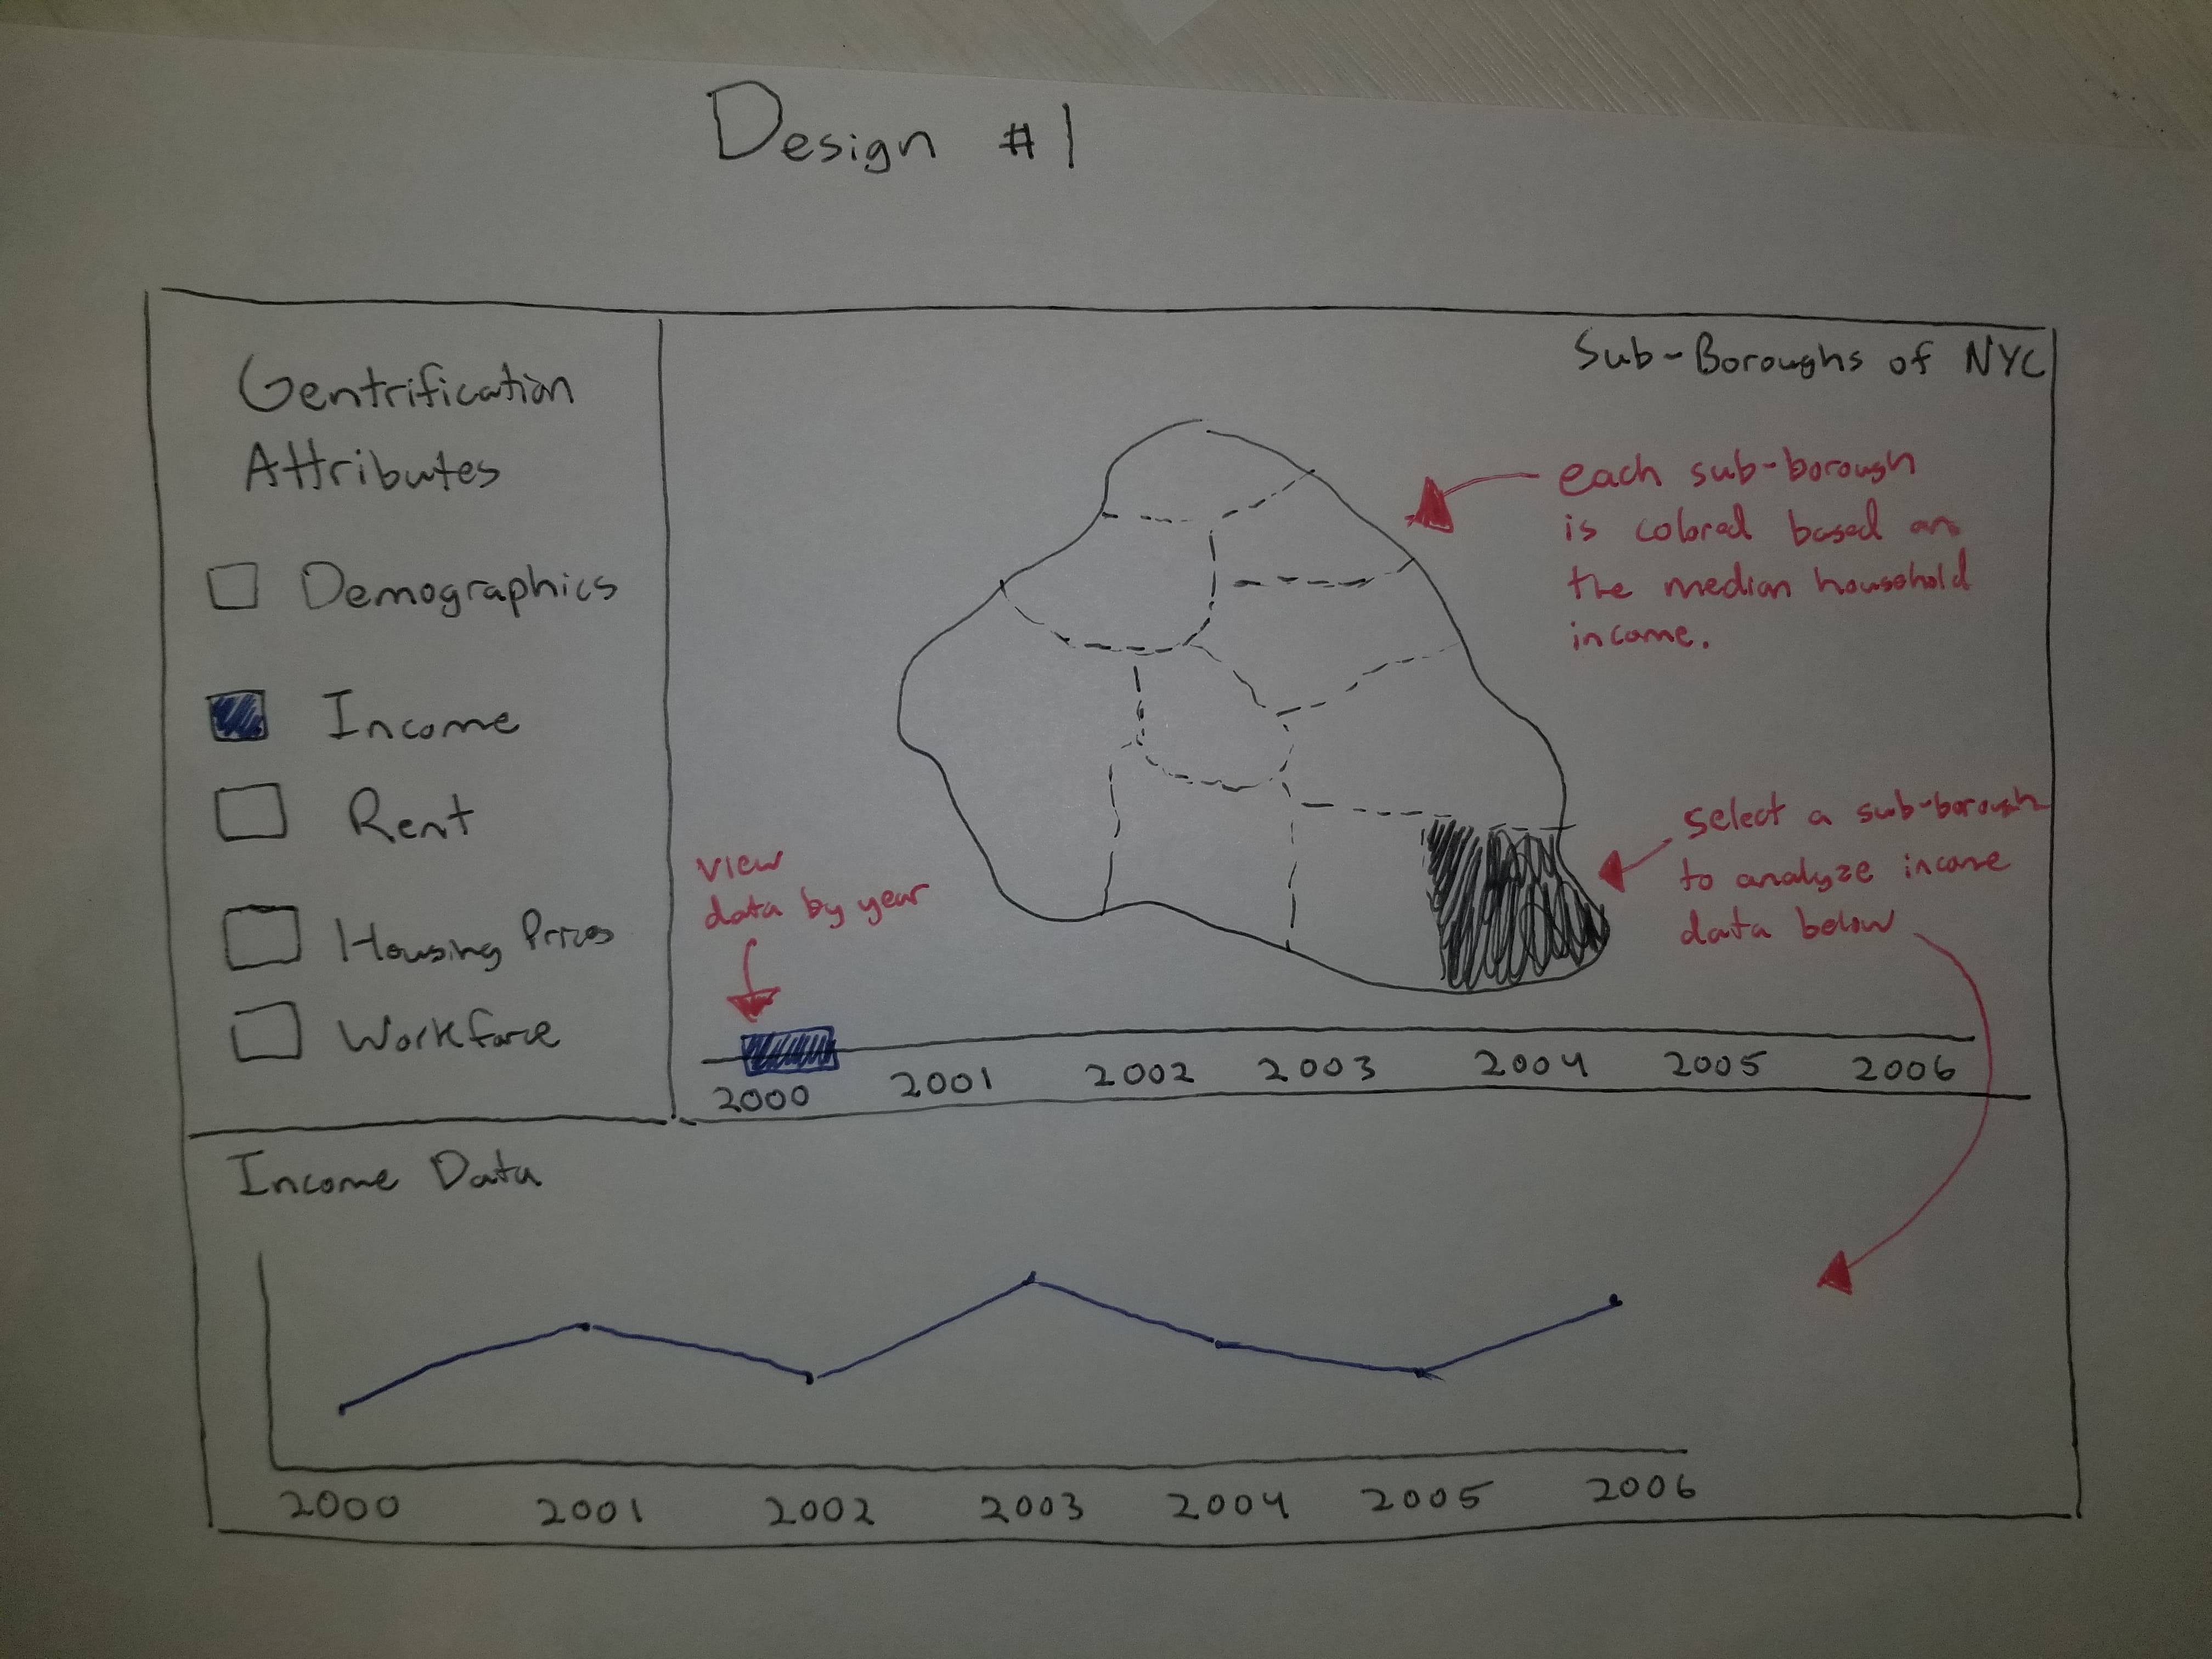
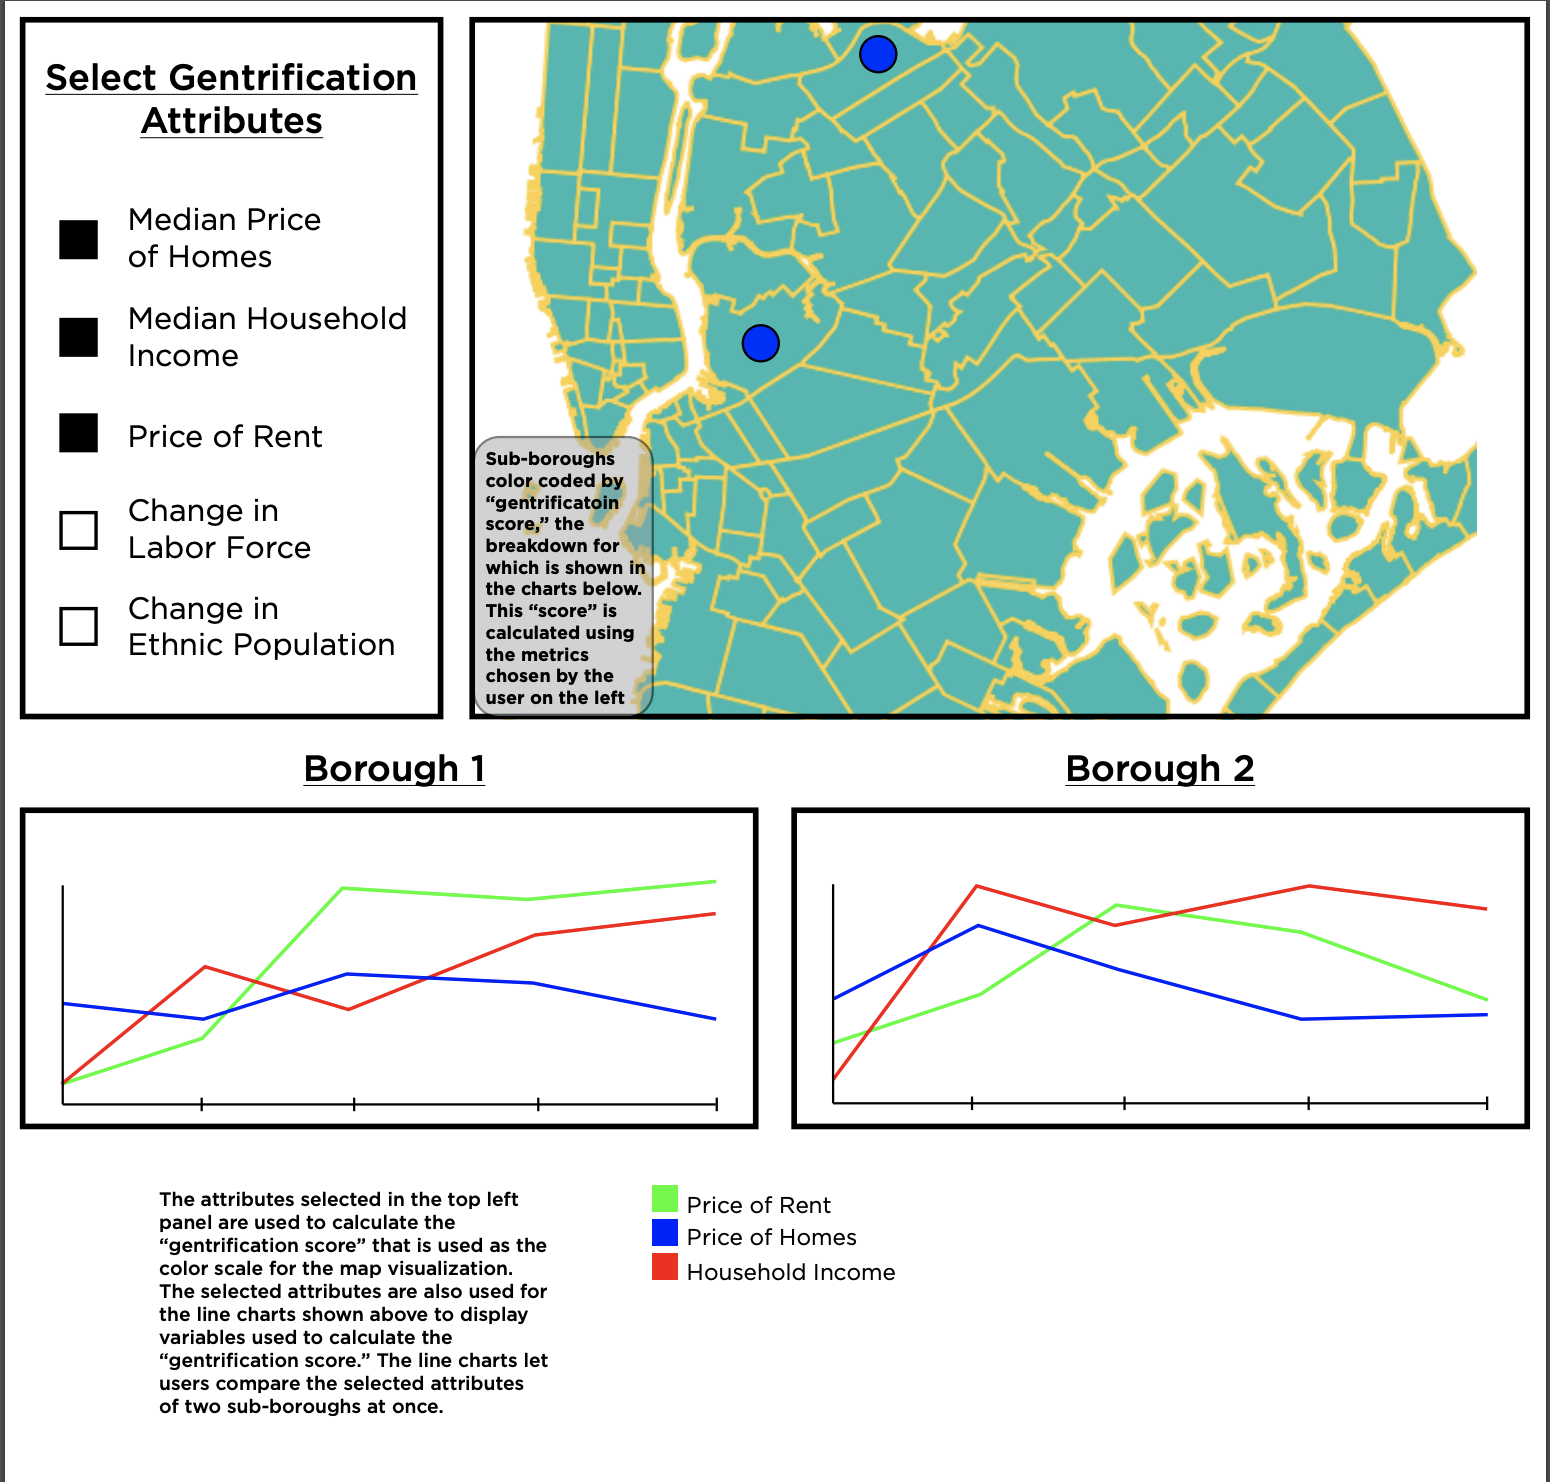
Design #1: Users can select multiple attributes from the left sidepanel that they want to analyze. Selecting
a specific subborough from the NYC map will then display the timeseries data of said selected attributes below
the map. Additionally, users can use the slider below the NYC map to view different data corresponding to
different years selected. Each subborough in the map will be colored depending on the value(s) of the
attribute(s) selected.
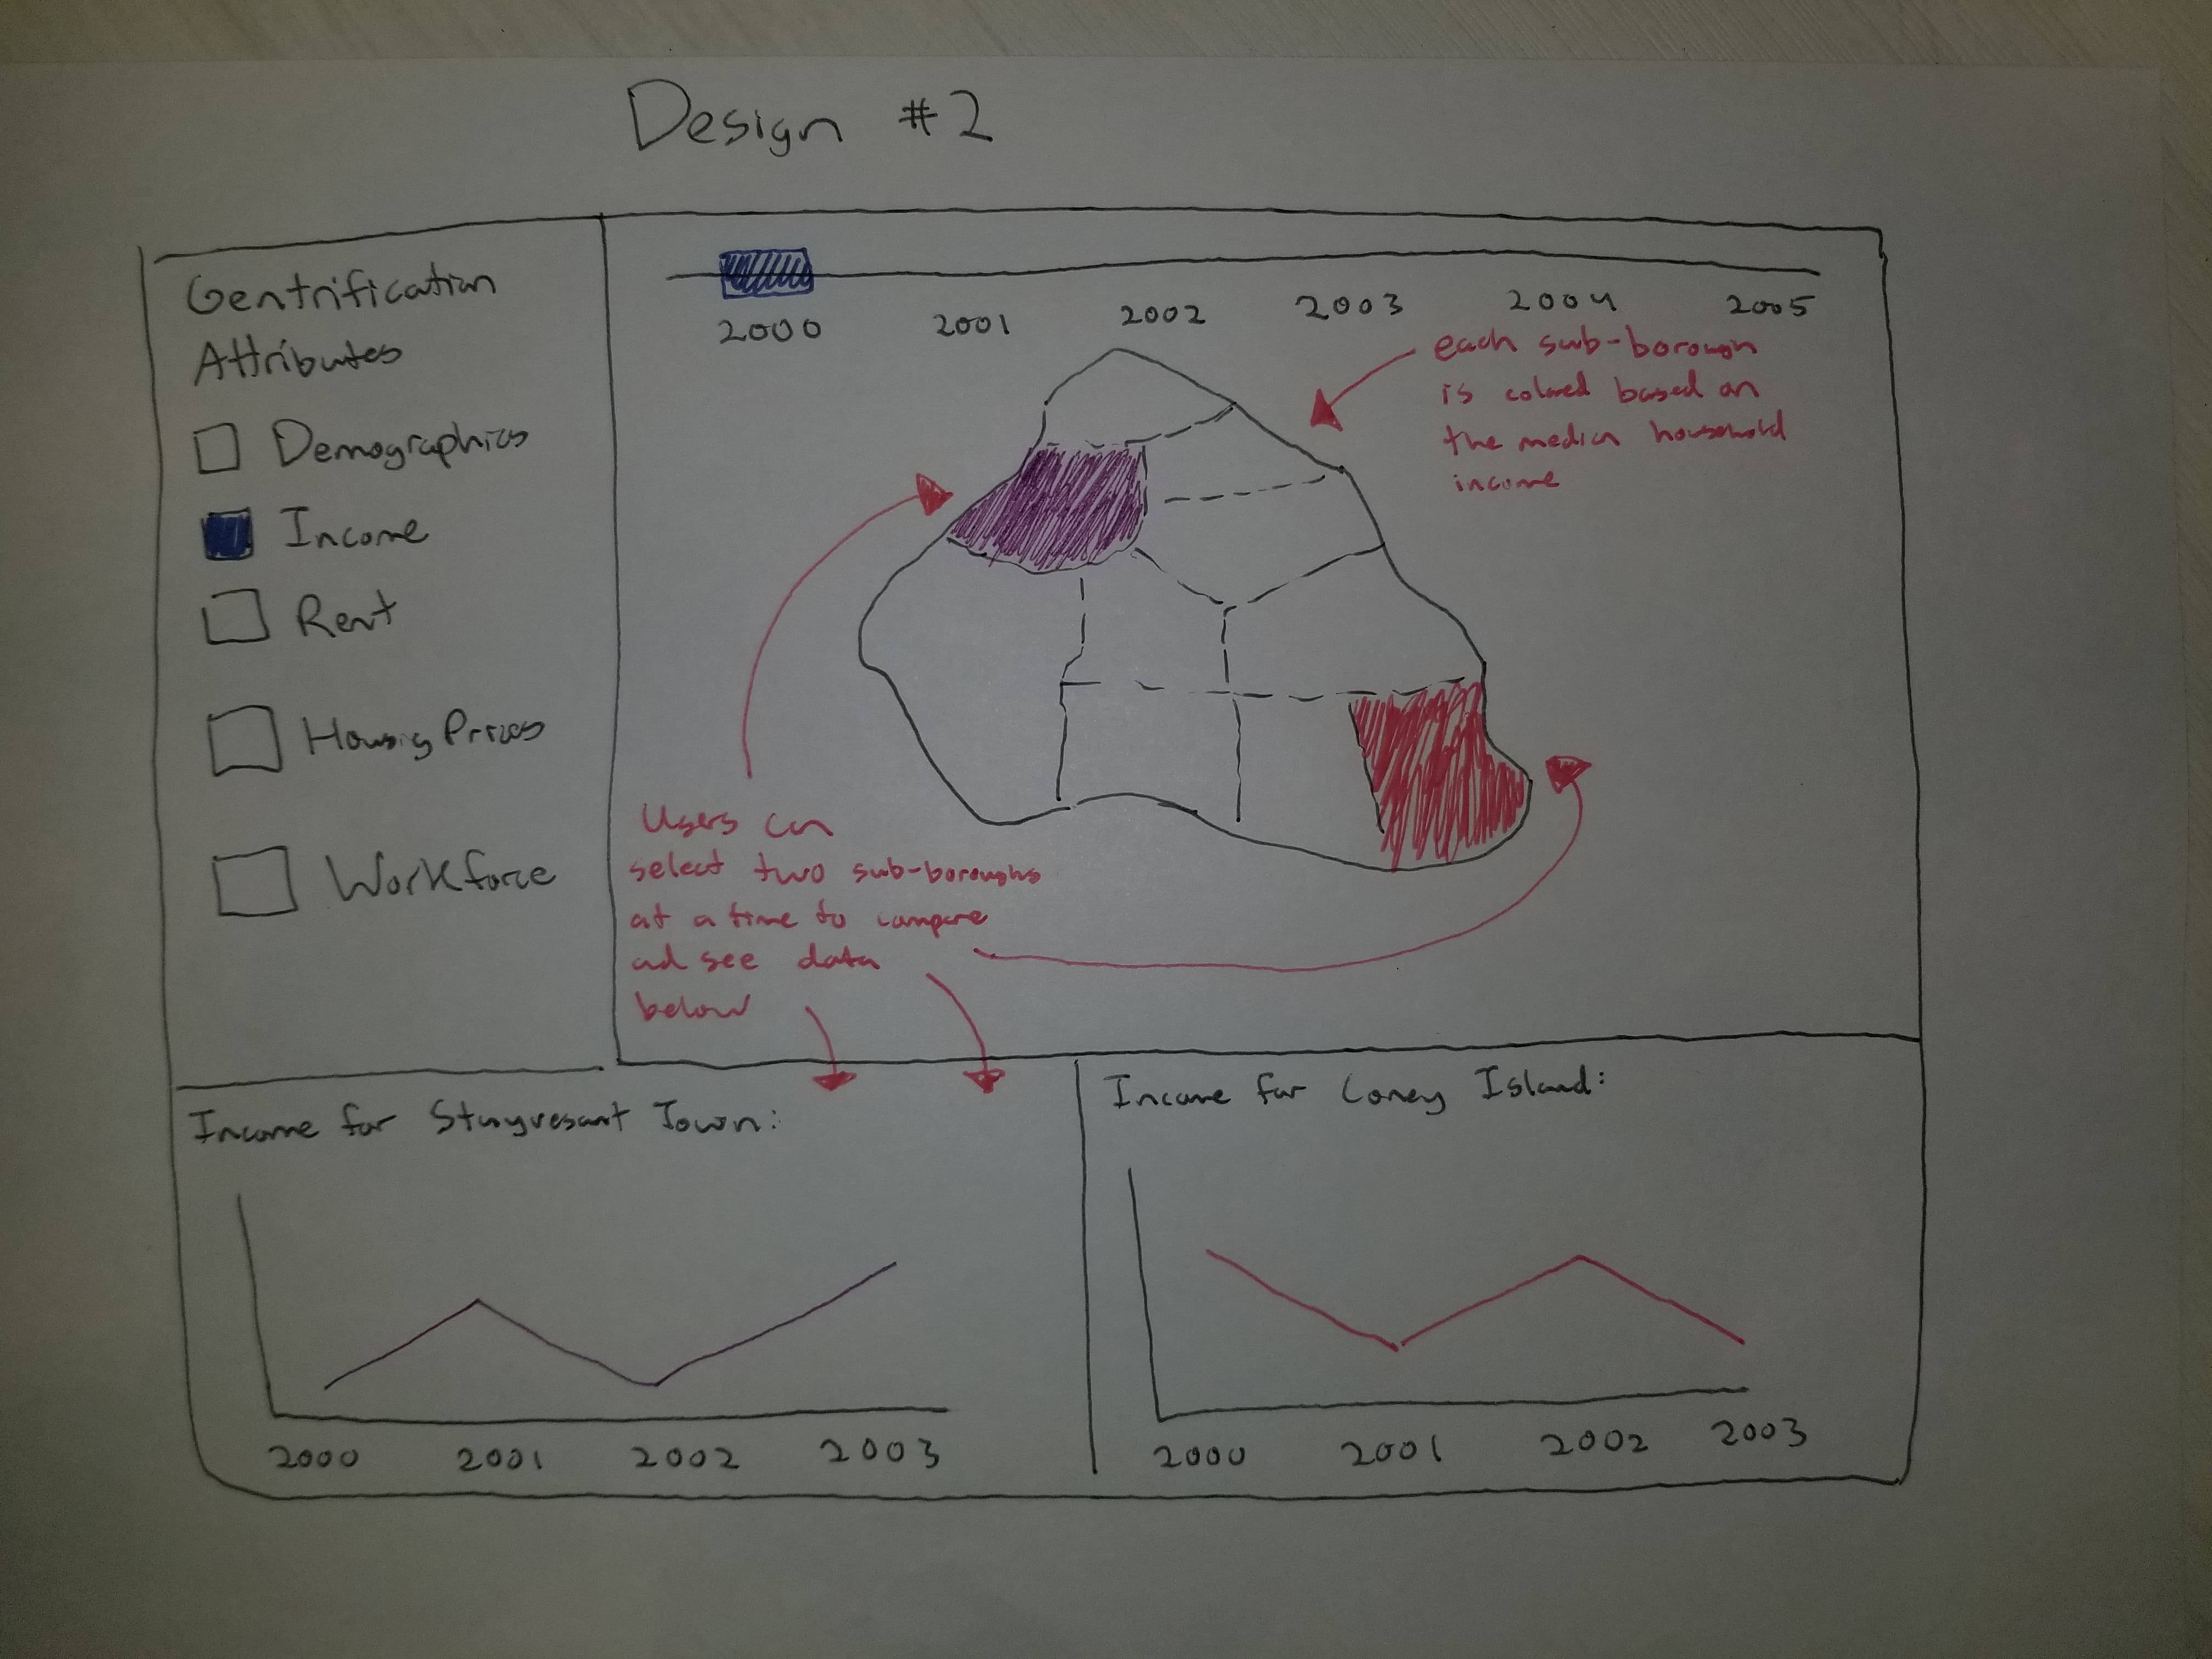
Design #2: Similar to Design #1, except users can now compare up to 2 subboroughs at a time.
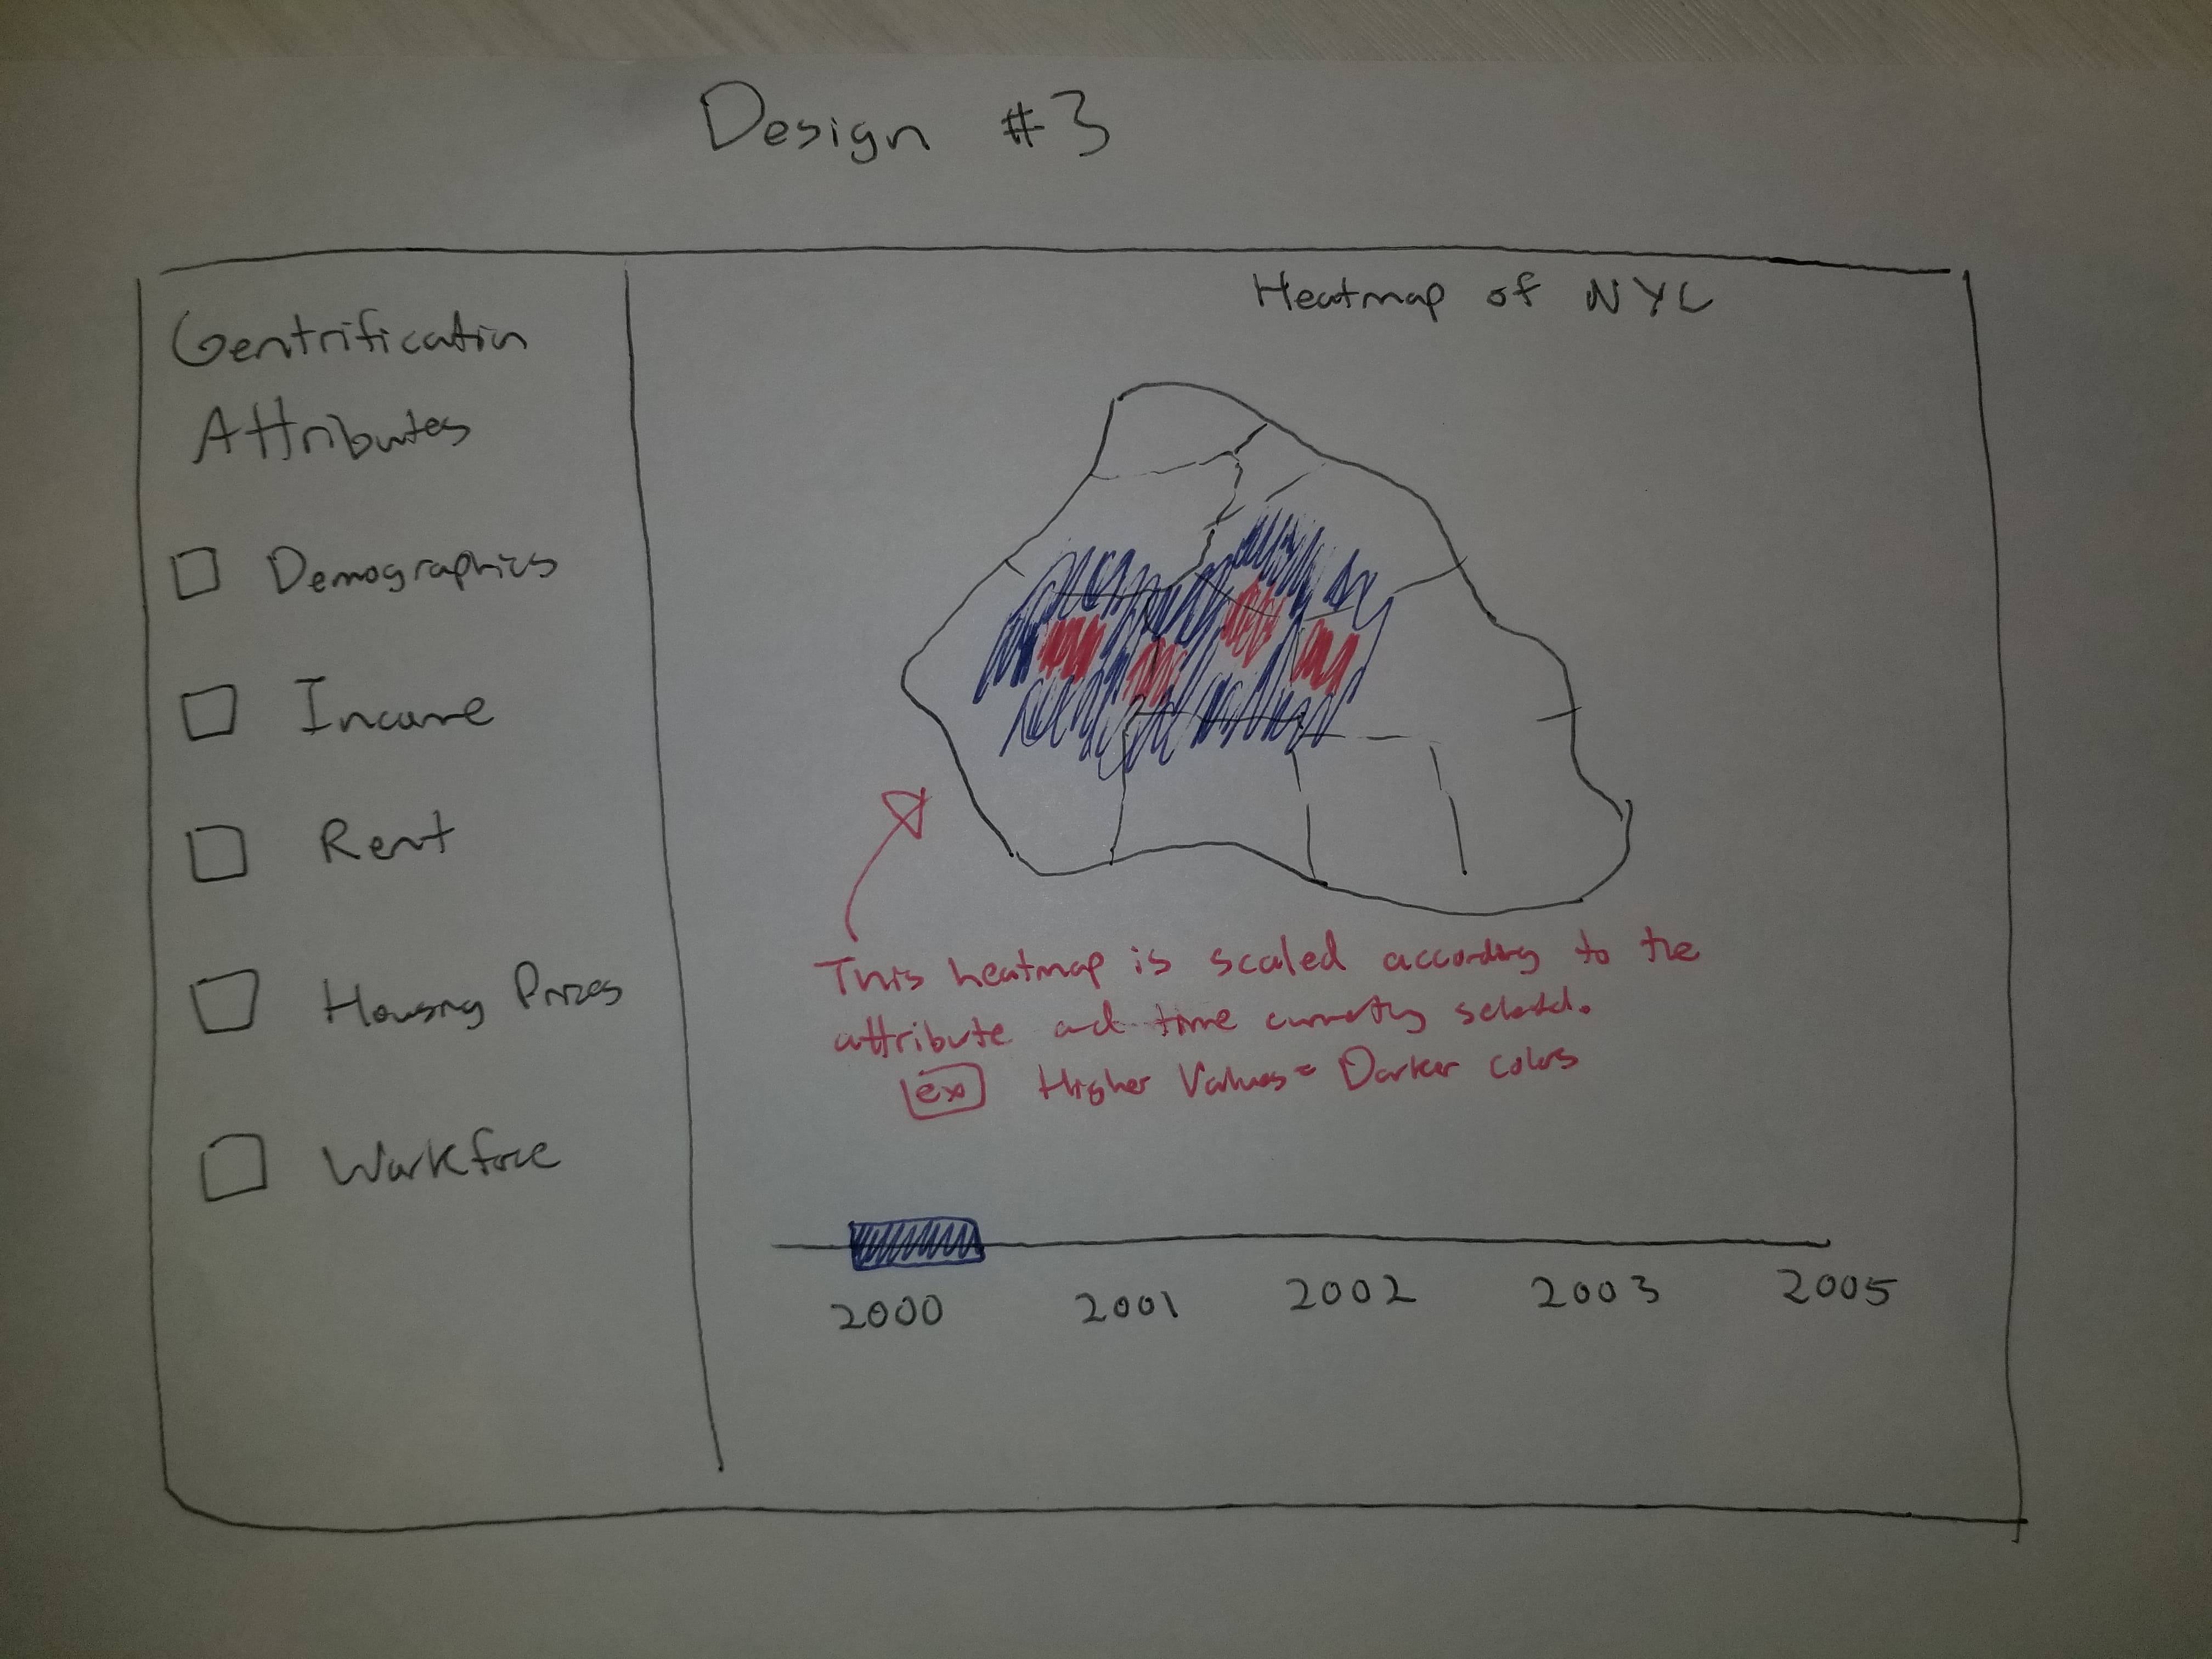
Design #3: The two main components of this visual is a panel of attributes user can choose from. Selecting
an attribute will generate a heatmap of NYC, where darker colored areas will correspond to higher values of
the attribute(s) selected.
Final Design: Our final design combines the functionality of all three designs in that users can (1) Select
certain attributes to analyze, (2) see a heatmap of NYC that represents a "gentrification score" calculated
from the selected attribute(s), (3) display timeseries data of selected attributes and (4) compare up to two
subboroughs at a time.
Project Schedule
March 11: Define target and find viable datasets
March 18: Finish project proposal and begin wrangling the data
March 30: Working prototype of one visualization on webpage
April 8: Finish prototyping all visualizations on webpage
April 15: Finish all interactionsand construct presentation
April 22: Get feedback and polish webpage
April 29: Project due!
Milestone One
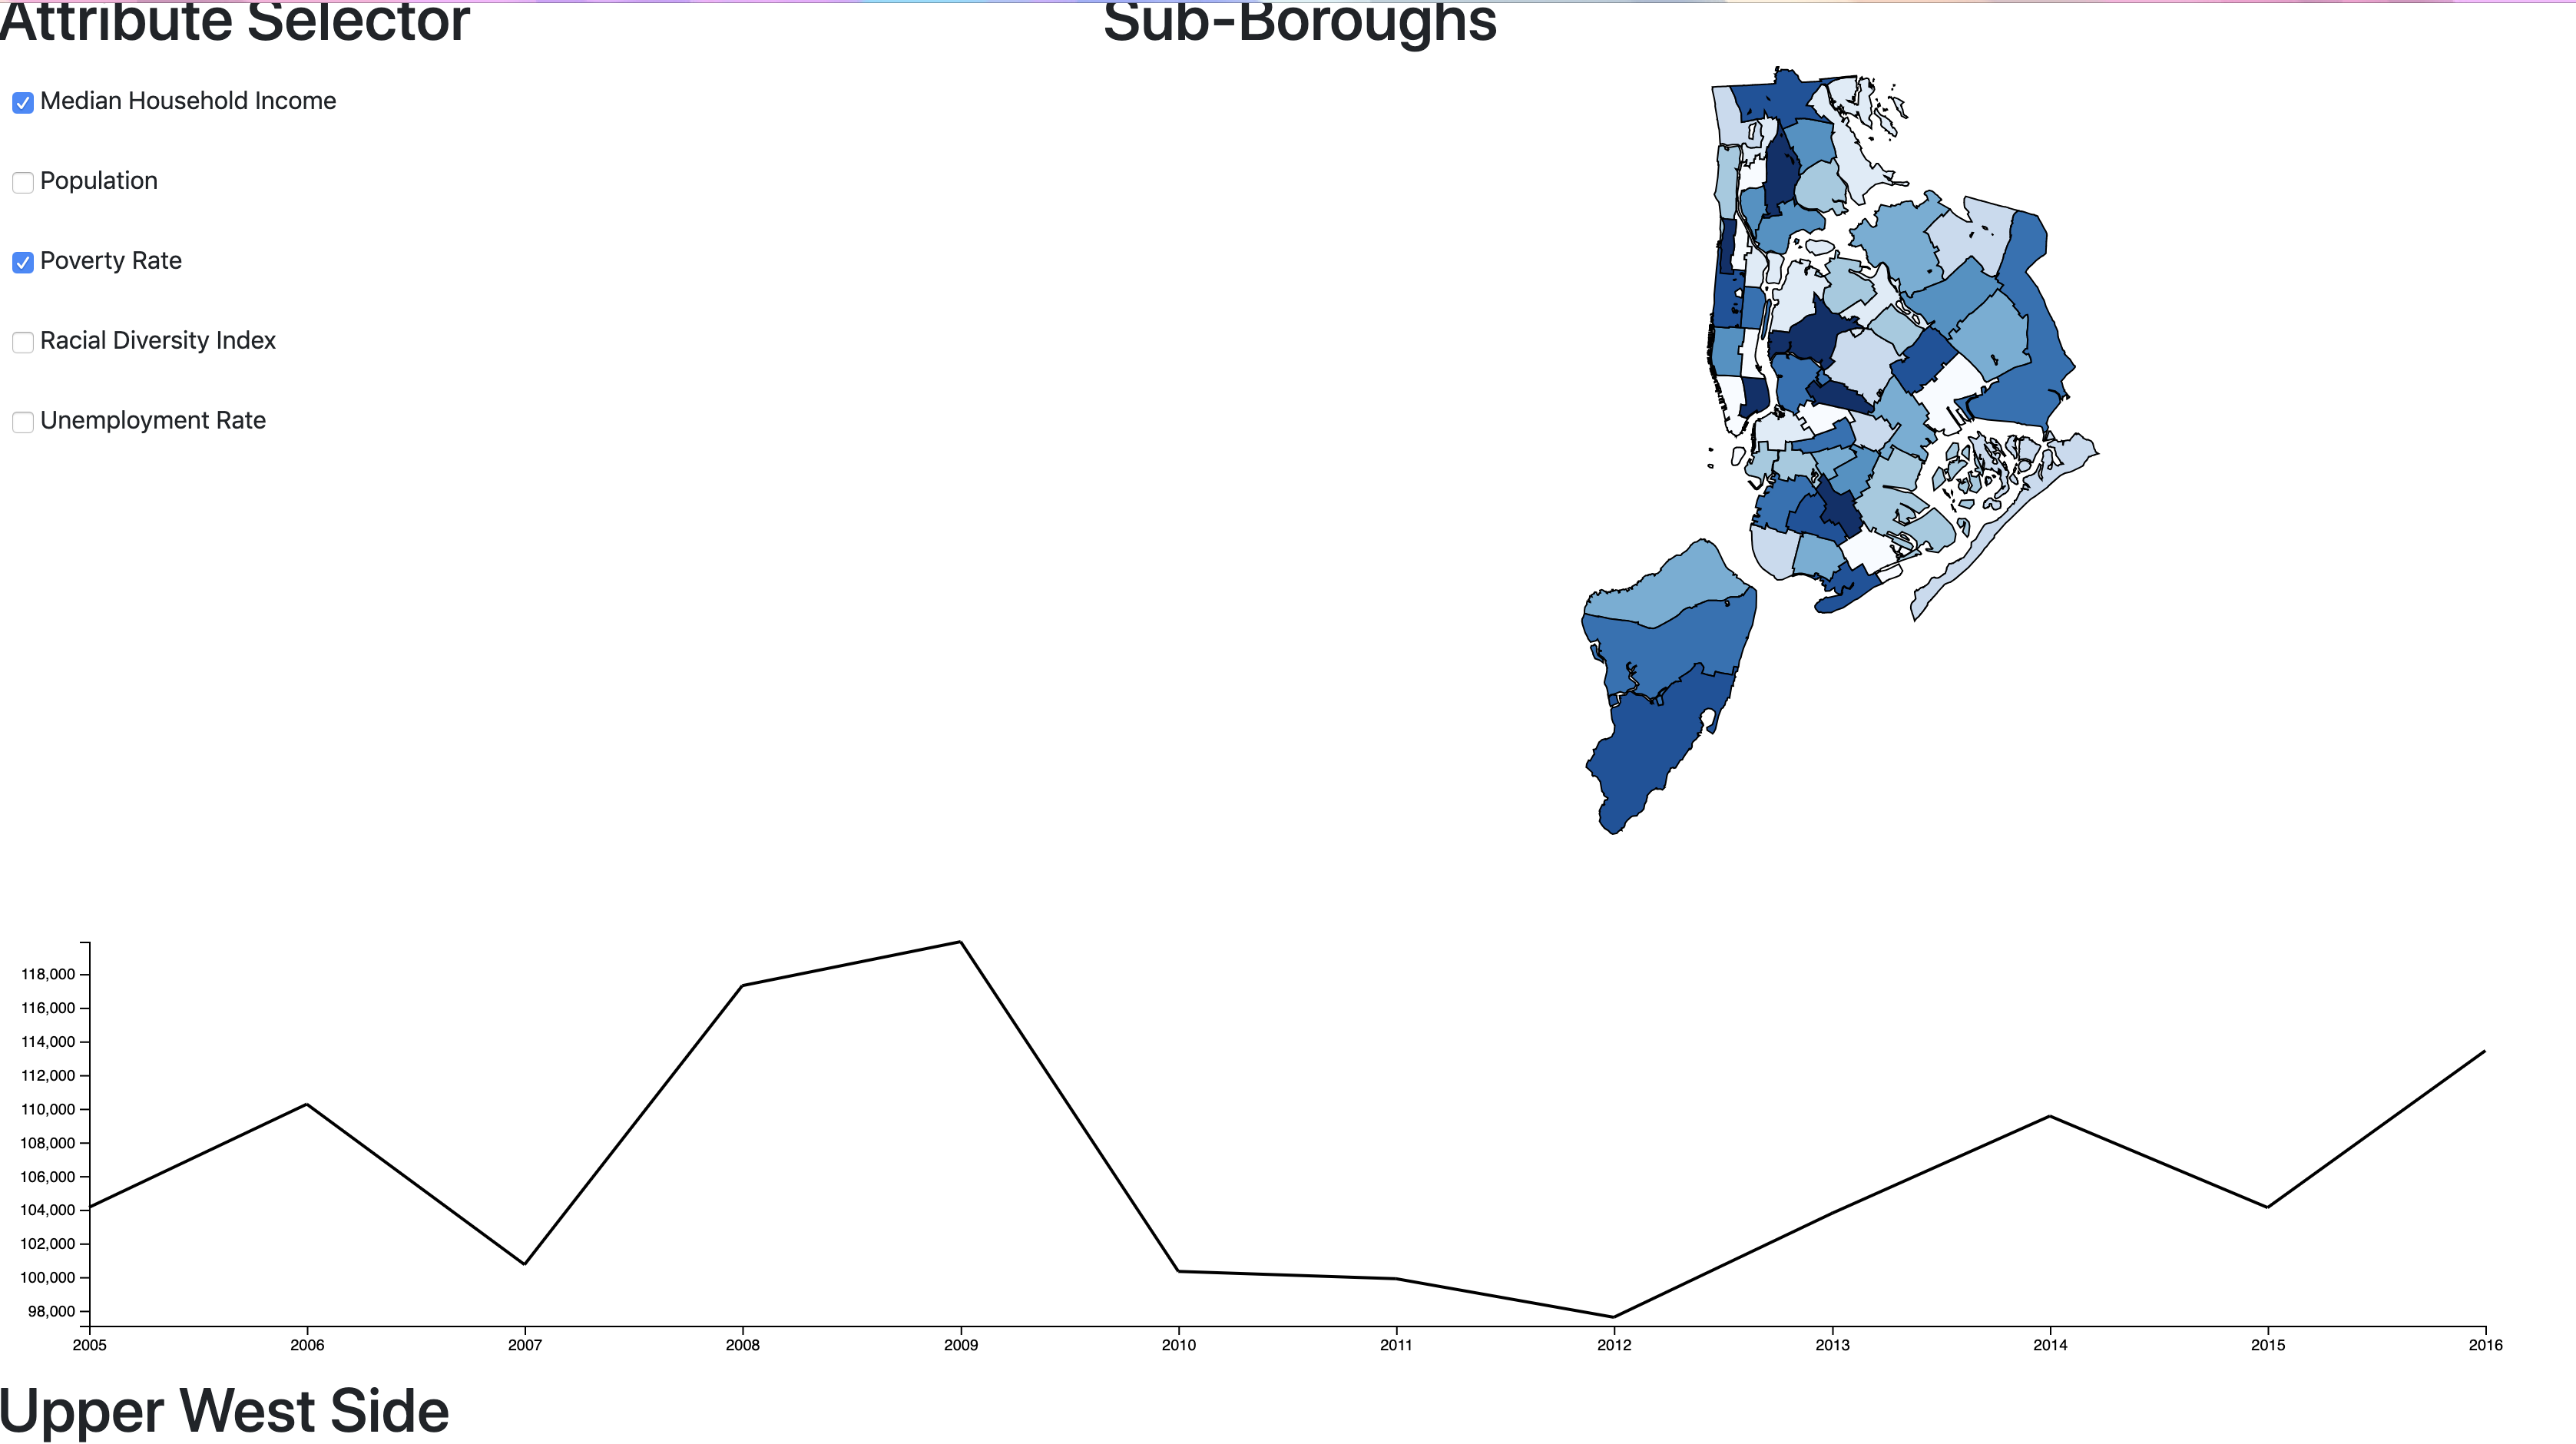
So far, we have been able to stick to our original 3-panel design. Users can select a gentrification attribute
from
the sidepanel and then select a specific NYC neighborhood in order to display a timeseries datachart of whatever
data is selected. Currently, our timeseries chart just shows the income data for each subborough, but we plan on
dynamically changing this data in the next milestone. One design idea we are currently experimenting with is to
generate a "gentrification score" from multiple selected attributes and apply this score to a color scale that can
illustrate which neighborhoods in NYC are exhibiting the highest amounts of gentrification. In the picture above,
for example, a gentrification score is generated for Median Household Income and Poverty Rate. We are still
researching ways in which we can make a reliable gentrification score that makes the most sense to users, so
currently we are just averaging the values of whatever metrics are selected. One feature that we weren't yet able
to
implement was the timeline feature that allows users to explore NYC data across multiple years. We hope to have
this
feature in the next iteration.
Milestone Two
By now, we have implemented all of our core goals we stated that we would achieve at the beginning of this
project.
Our visualization consists of four main features that work together to help users look at trends in
gentrification.
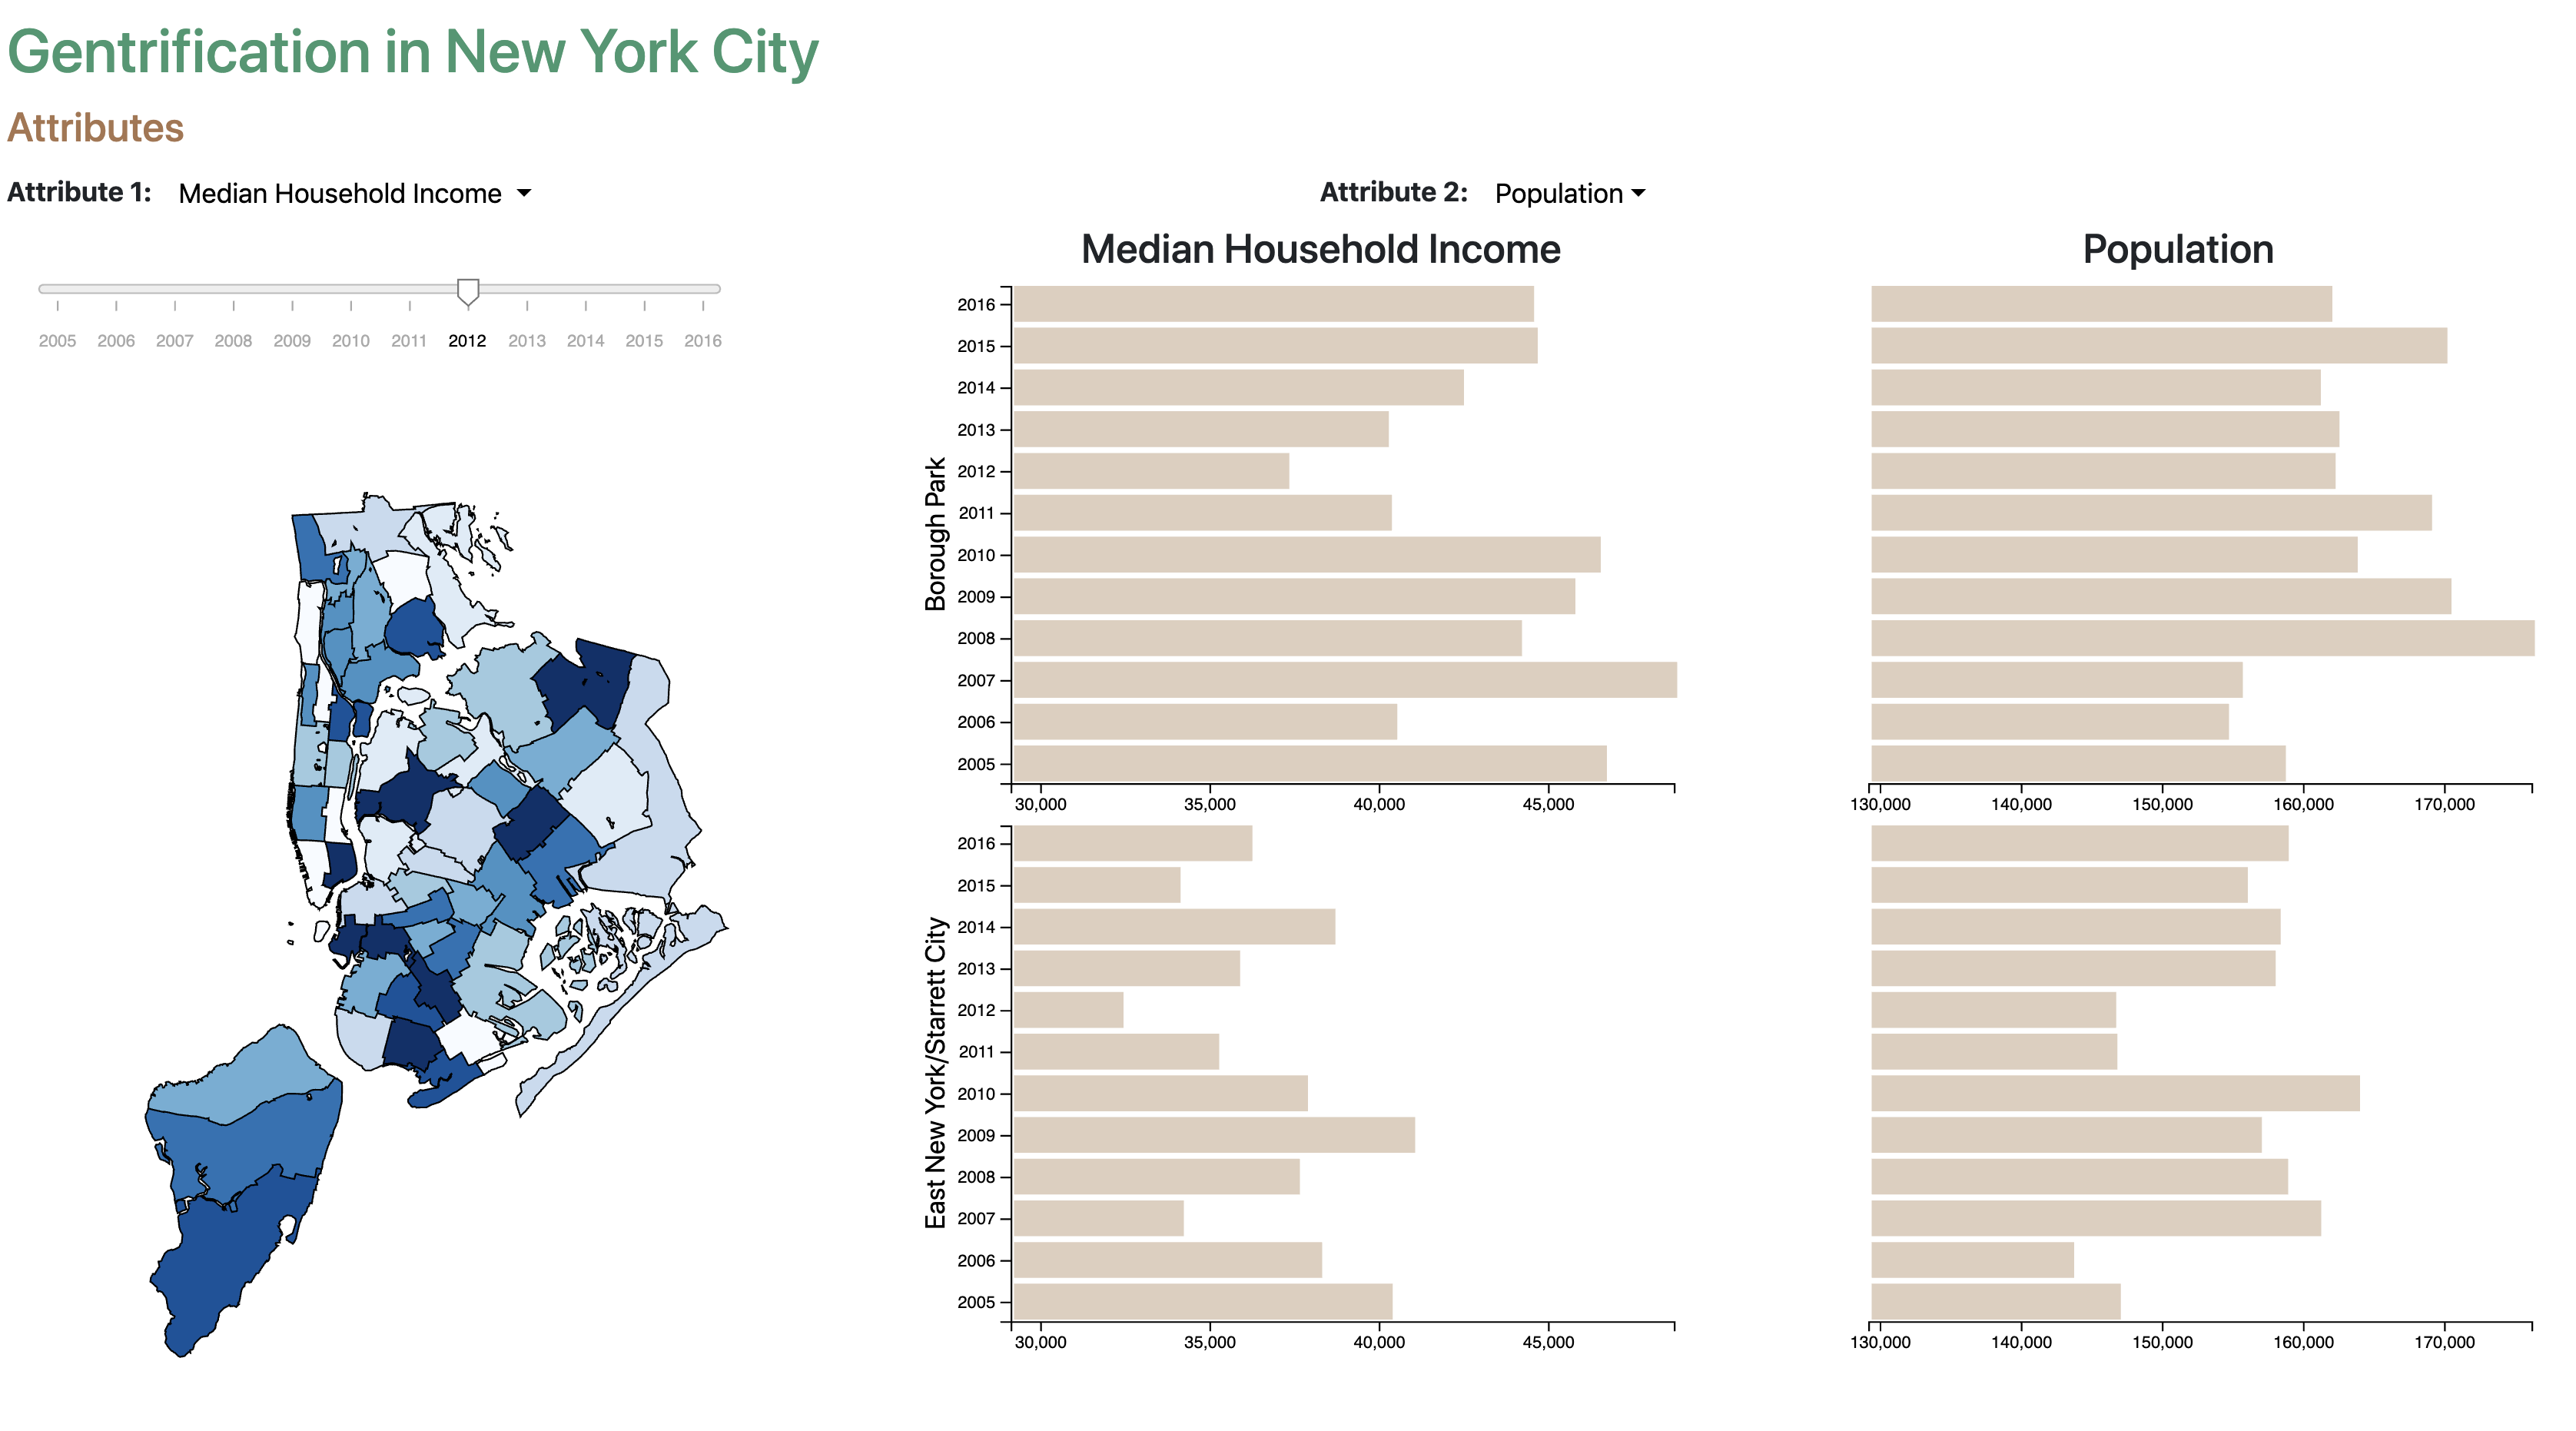
Users begin by selecting up to two gentrification attributes from the two dropdown menus at the top of our
visualization. After selecting up to two subboroughs from the GeoJSON map below, data from 2005-2016 will be
displayed in bar charts to the right of the map. Users can change the year for the data displayed using a slider
control. For the bar chart visualization, the top two quadrants will
represent the data for a specific subborough A, while the bottom two quadrants will represent the other selected
Subborough B.
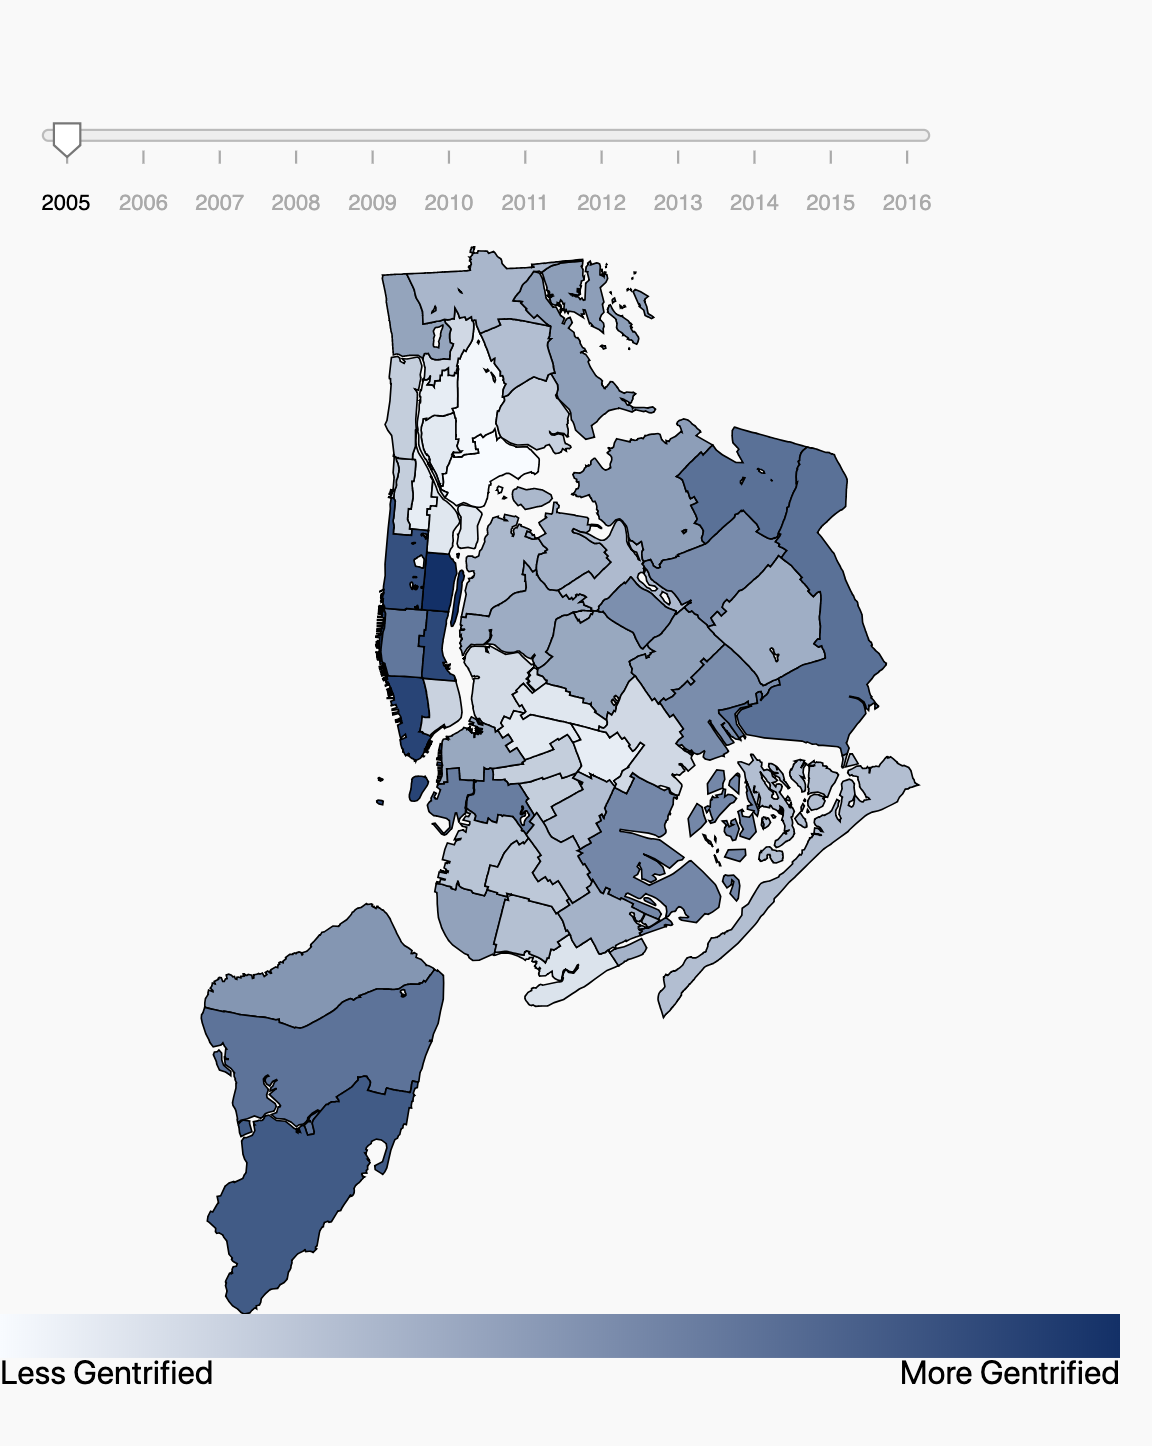
The purpose of the GeoJSON map is not just to allow users to select specififc subboroughs they want to
investigate,
but also to help users see how some subboroughs might be more gentrified than others. We do this by normalizing
the
dataset from NYU and then adding these normalized values together to generate a "gentrification score", where a
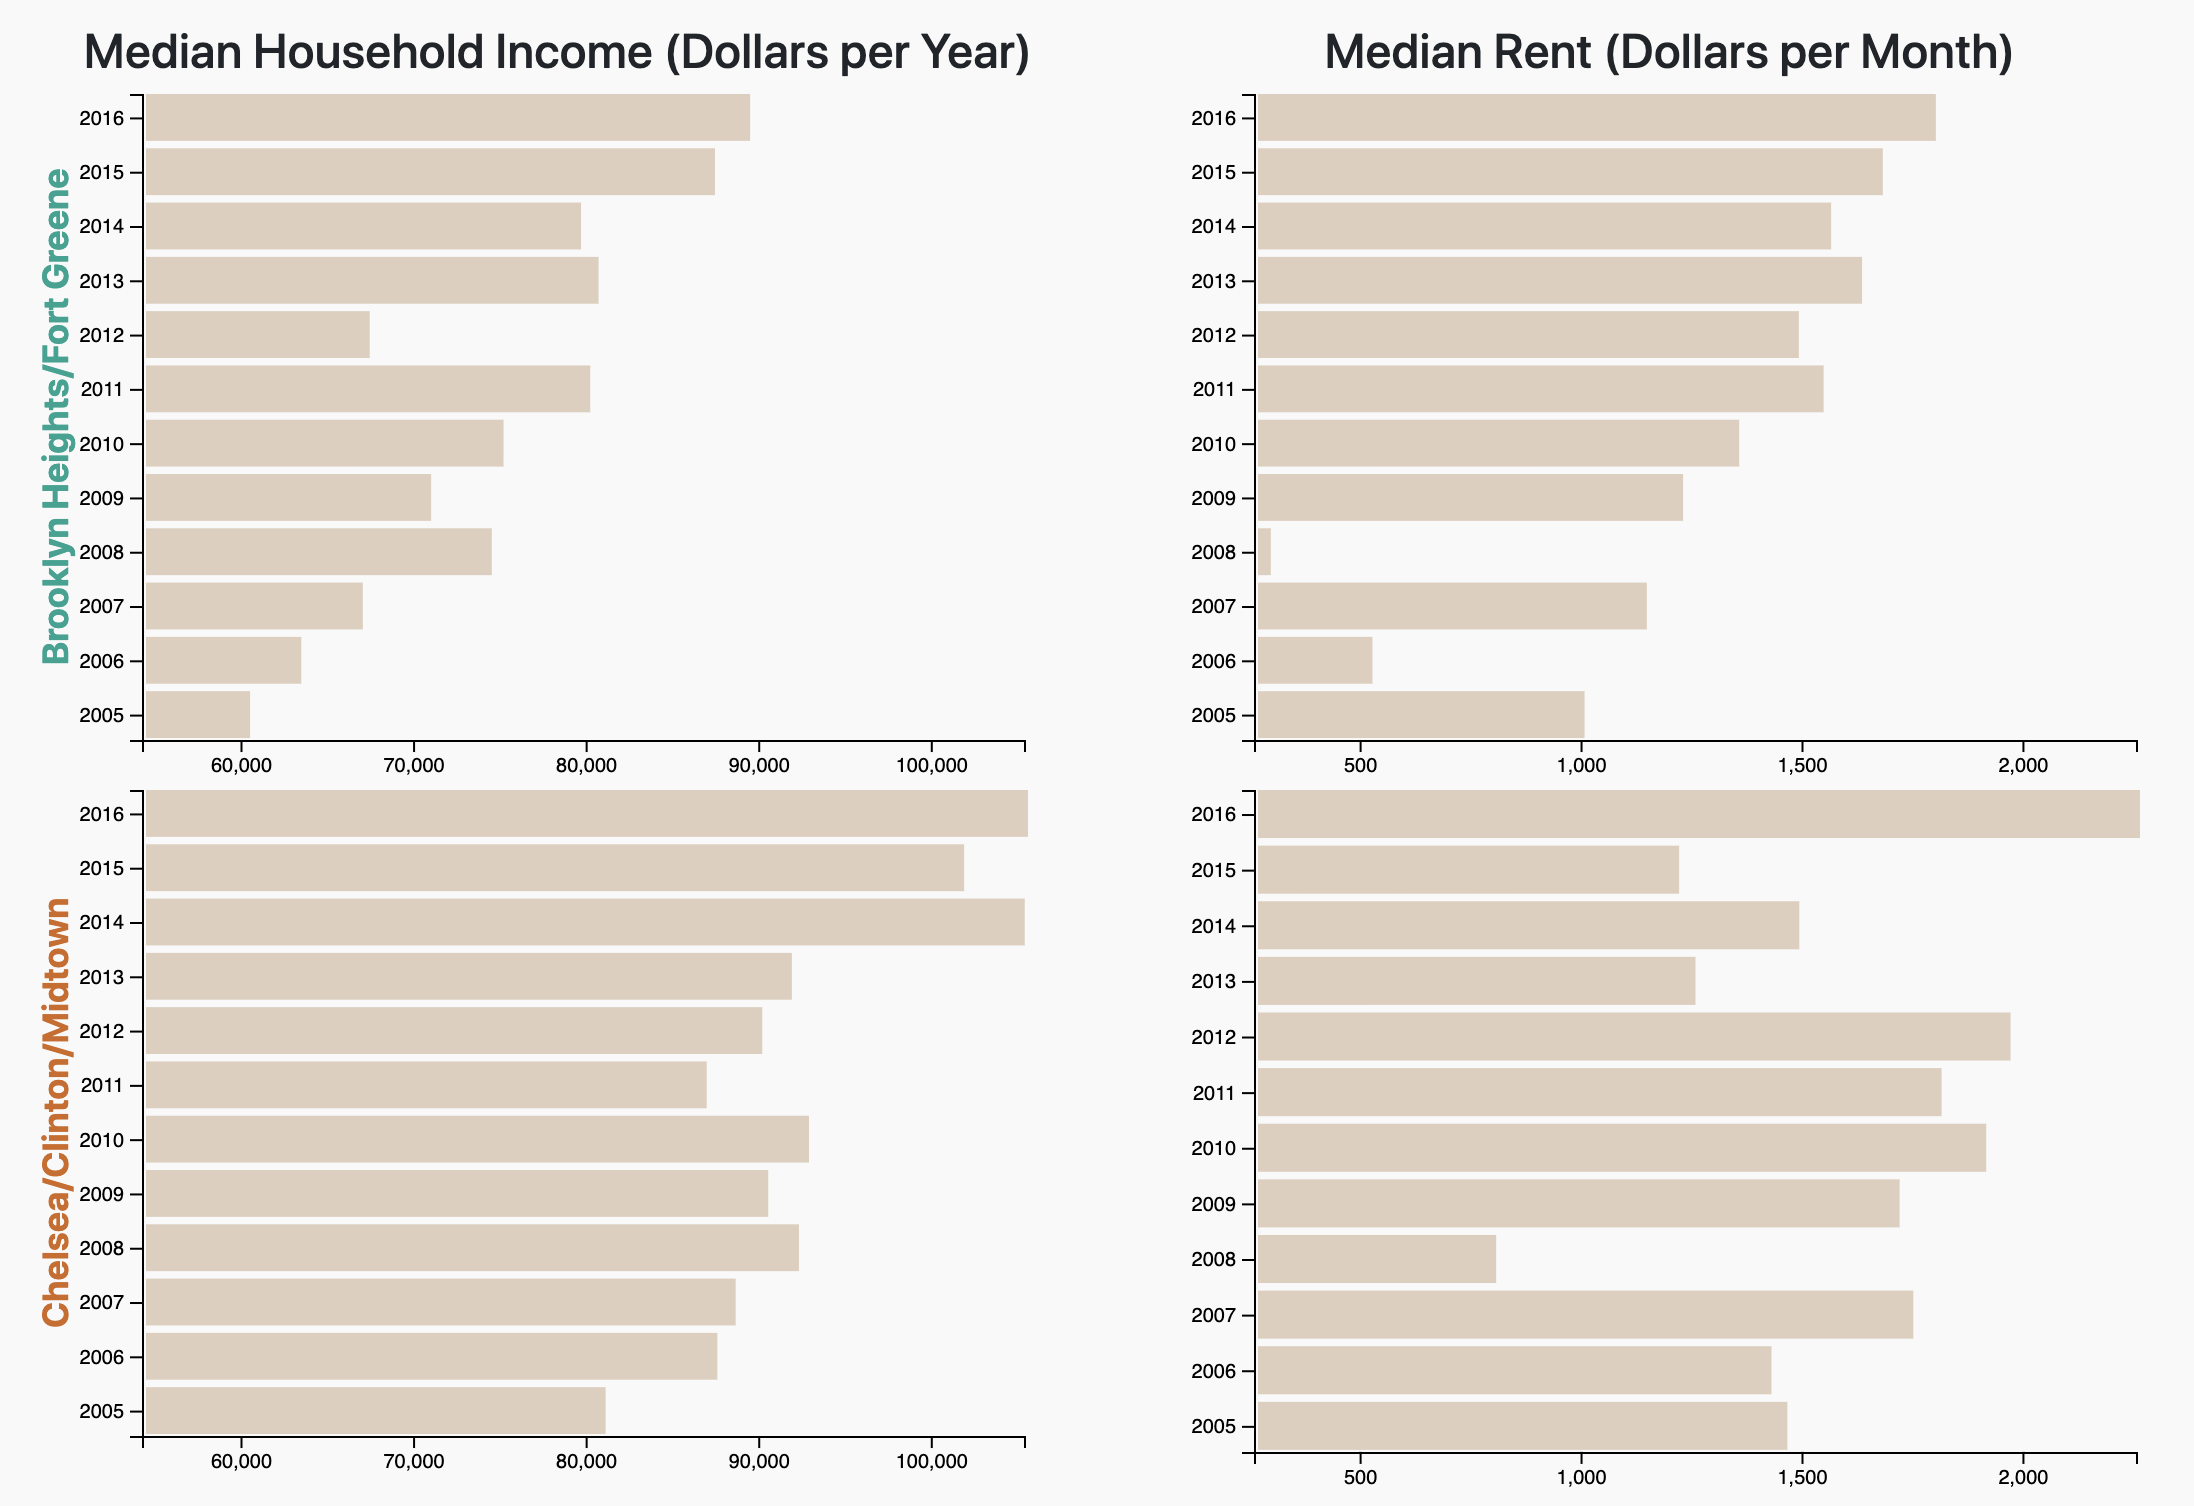
higher score means that there is more gentrification in an area. For example, if a user has selected the
attributes
"Median Household Income" and "Median Rent" for the year 2009, then our visual will get the appropriate normalized
values for each attribute and add them together. The resulting sum will then be applied to a color scale and used
to
color the each subborough on the map. Darker colors will mean higher sums and more gentrification happening. It is
worth clarifiying that not all attributes in our visualization are positively correlated to a rise in
gentrification. Consider Housing Units, for example, where a lower supply of housing in a given area can actually
cause increased gentrification because of rising rent in response. In cases like these, we simply take the
complement of the attribute's normalized value.
The idea for normalizing values for data to compute a "gentrification score" of sorts is largely attributed to a
visulalization project from the City of Los Angeles that also attempts to take different gentrification data and
use it to color encode a map of LA. The name of the visual is: Los Angeles Index of Neighborhood Change:
Naturally, we wanted to learn more, so we contacted Alex Pudlin of the Los Angeles
Innovation Team who sent us the team's whitepaper that describes how they aggregated
gentrification data
to color encode a map of LA. According to the whitepaper, the "scores" are an aggregate of six demographic
measures indicative of
gentrification, similar to how our visual's gentrification attributes. The measures are then standardized and
combined
using weights that reflect the proportion of each
measure that is statistically significant. In our case, we did not use weighting as we were constrained in time
and knowledge about how to accurately weight certain attributes.
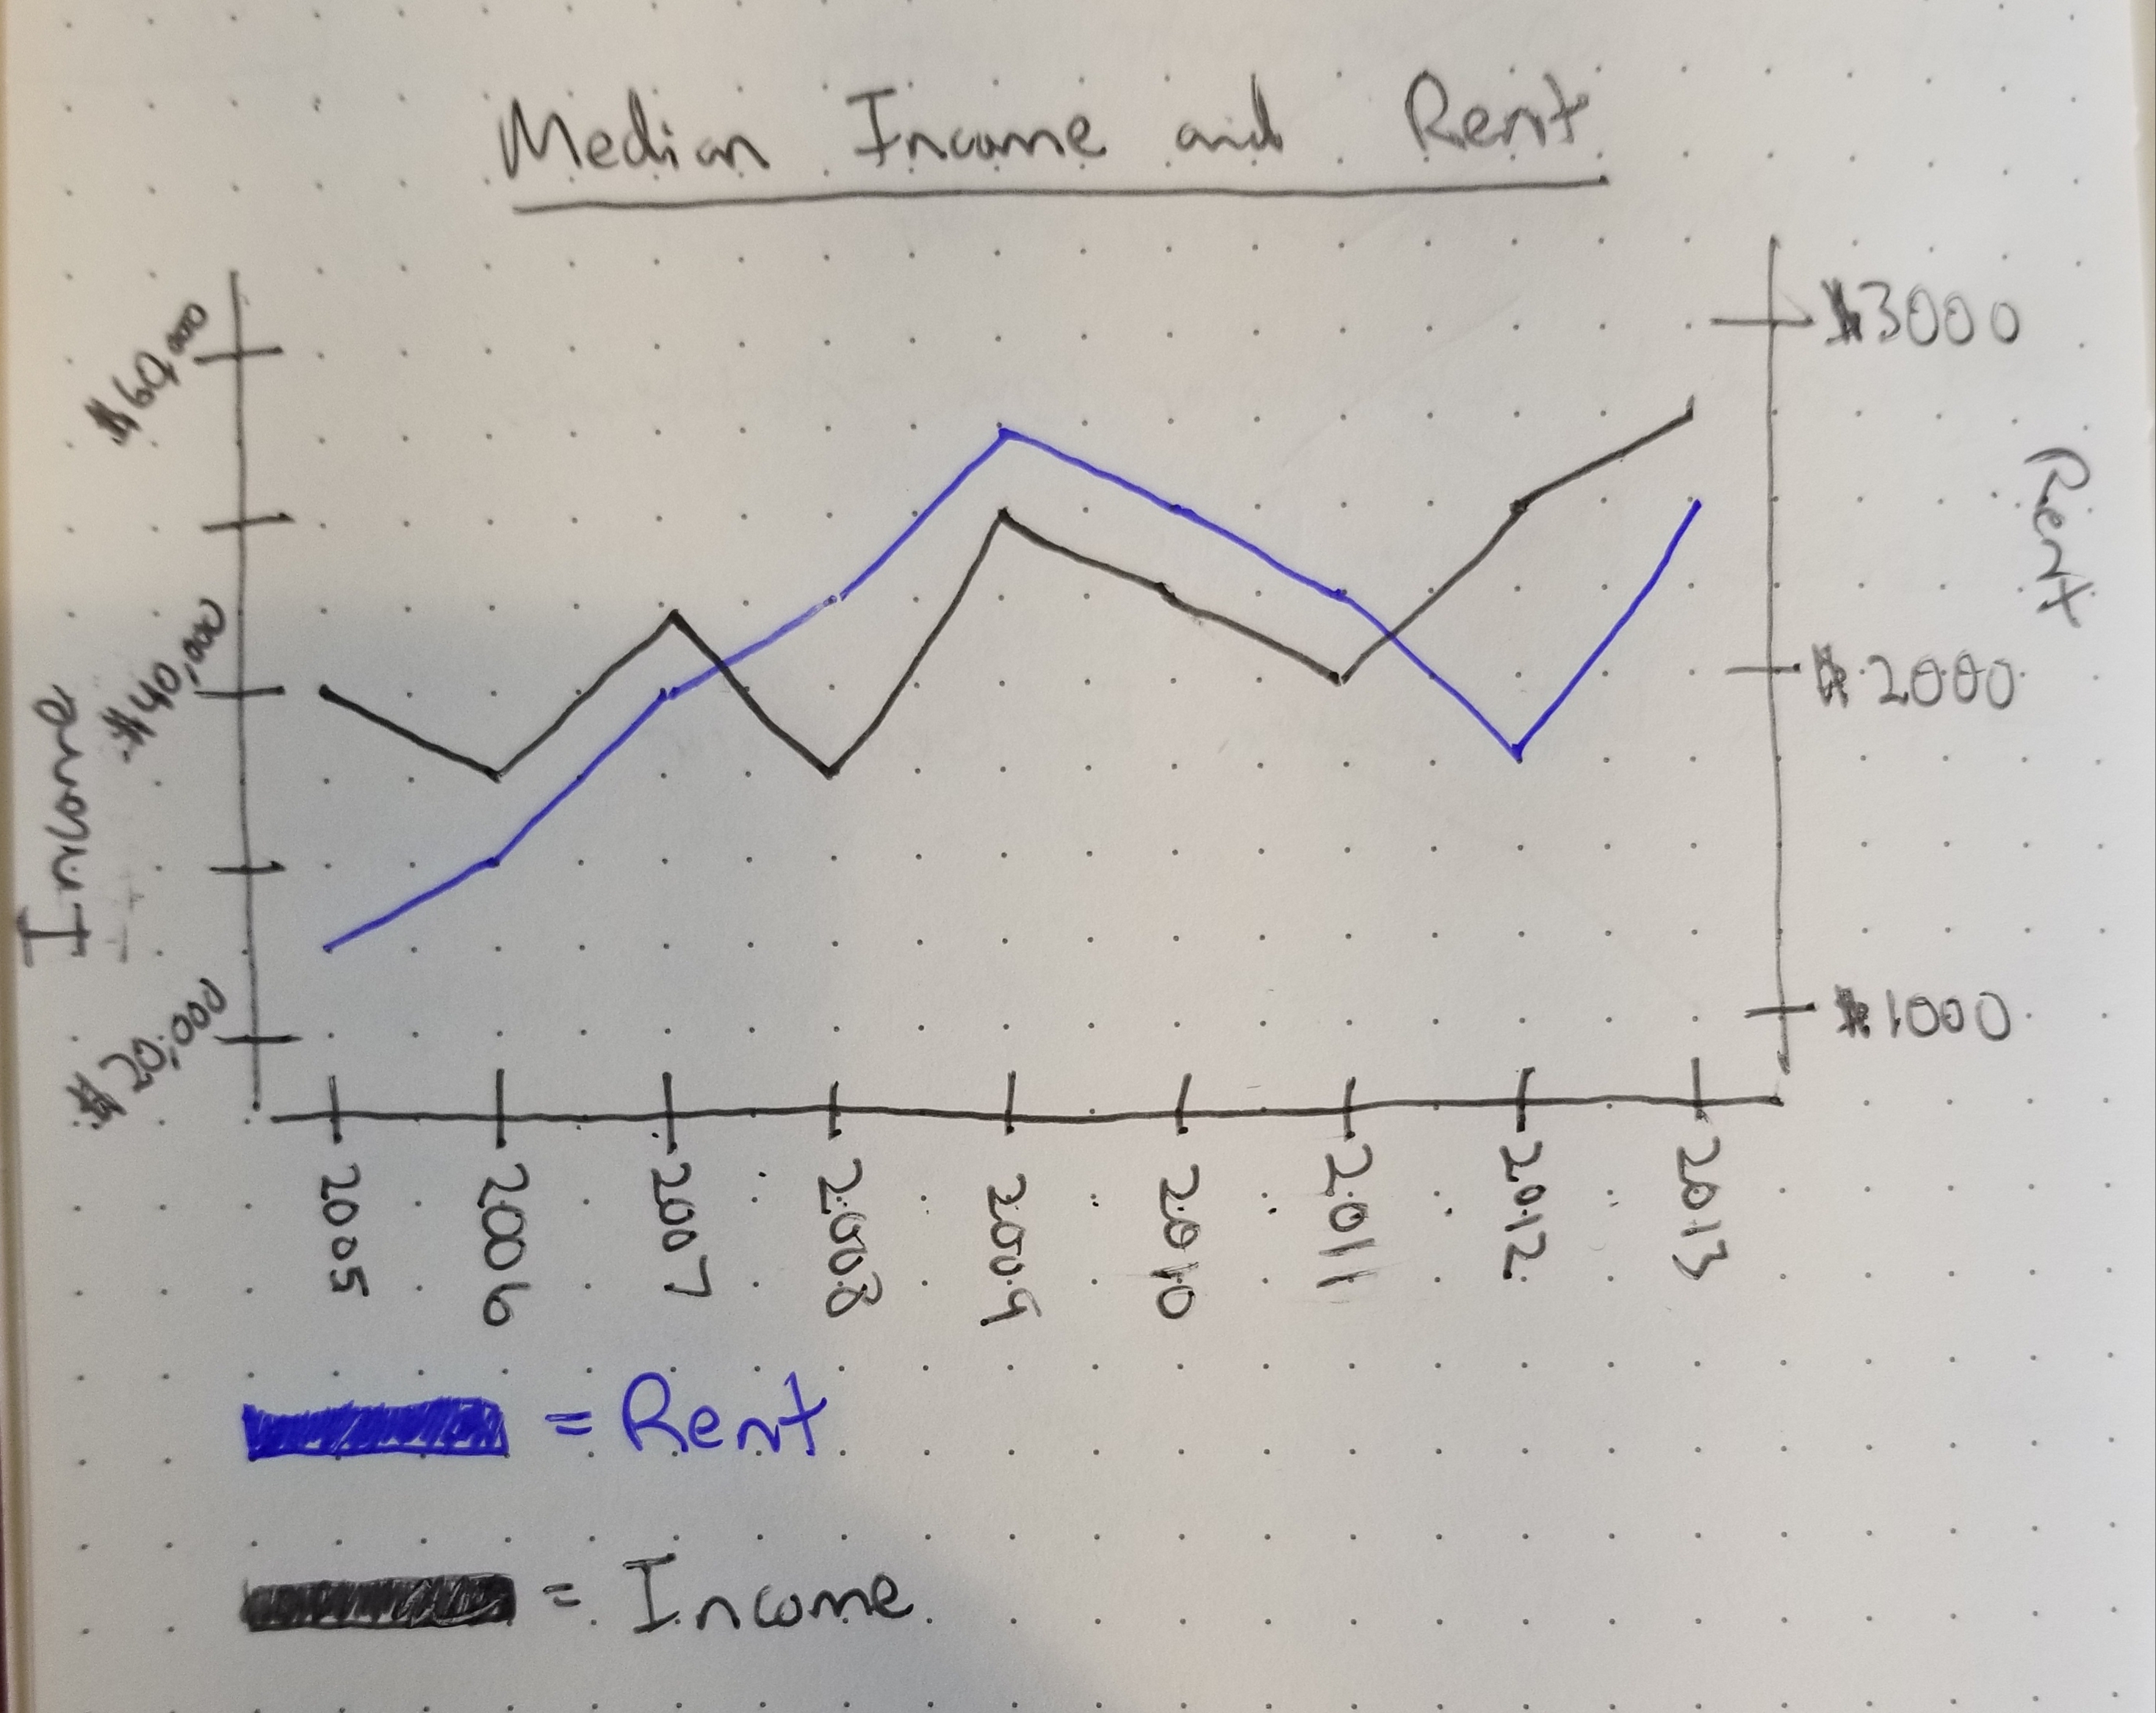
Originally, we had wanted to create a timeseries line chart that displays the data for multiple attributes. We
were
unable to follow through with this idea; however, as different attributes had different units of measure (ex.
dollars
vs housing units). This led to inconsistent y-axes being constructed. A potential solution we explored was a
timeseries chart
with two y-axes, each of different measure:
This idea did not work however because this could lead to users identifying faulty trends in data that never
existed in the first place. Our alternative solution, which ended up being
better, is the 4-quadrant bar chart you see now. Users are still able to compare multiple attributes across
different subboroughs, all while addressing the issue of different attributes having different units of measure.
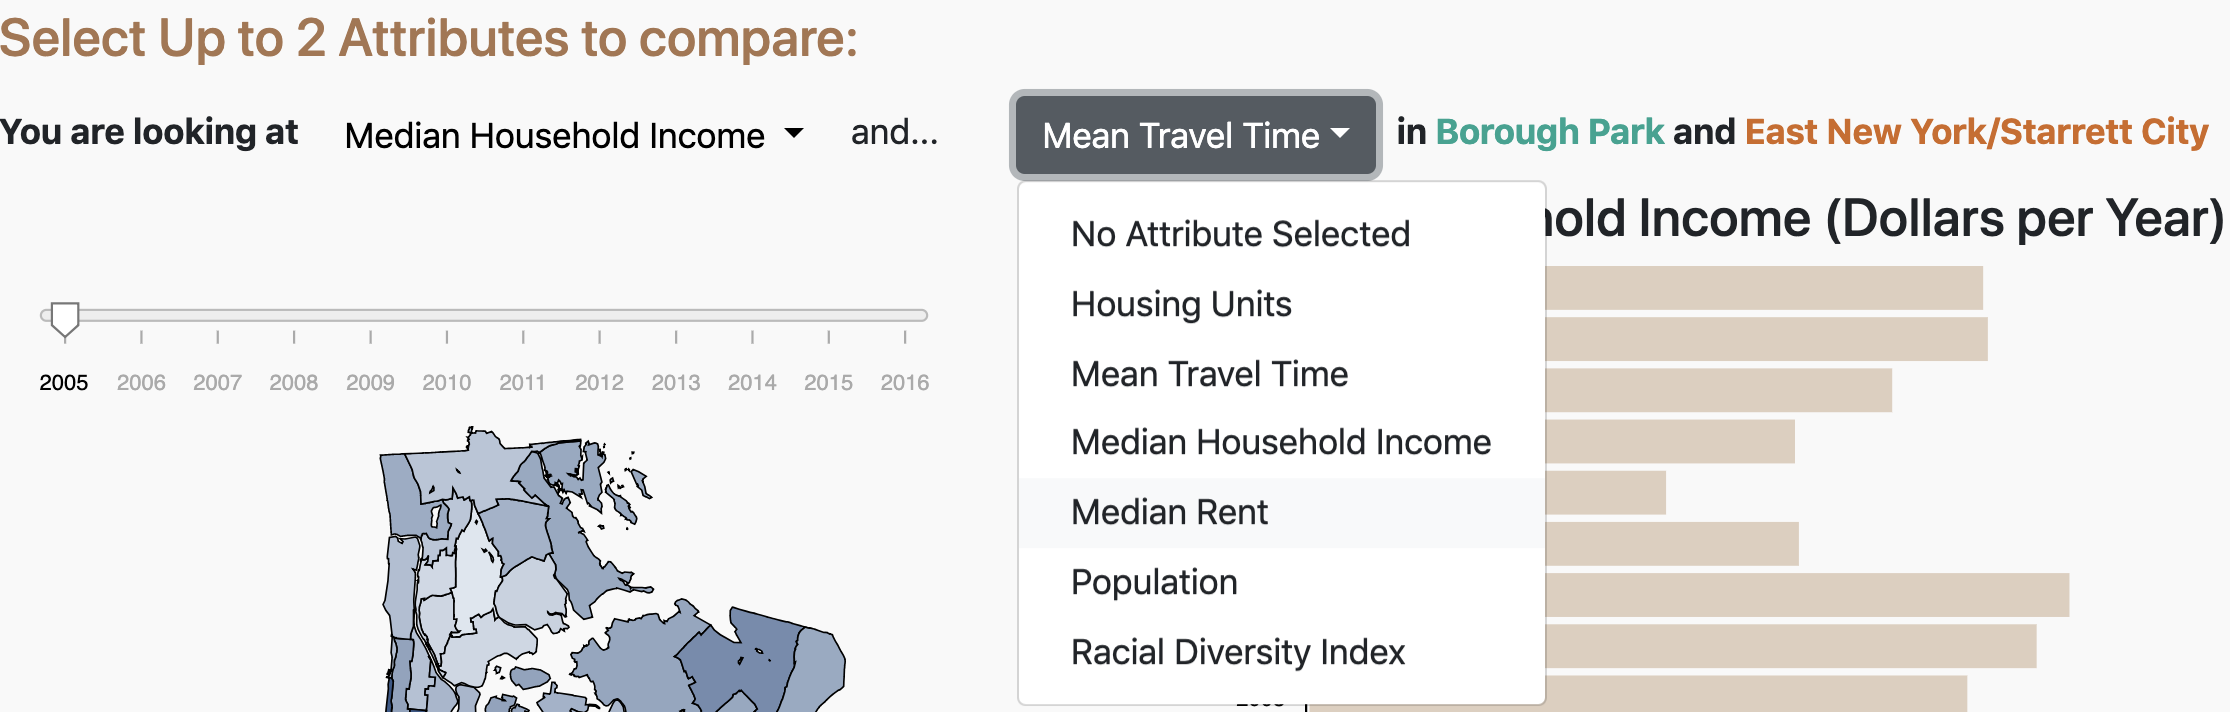
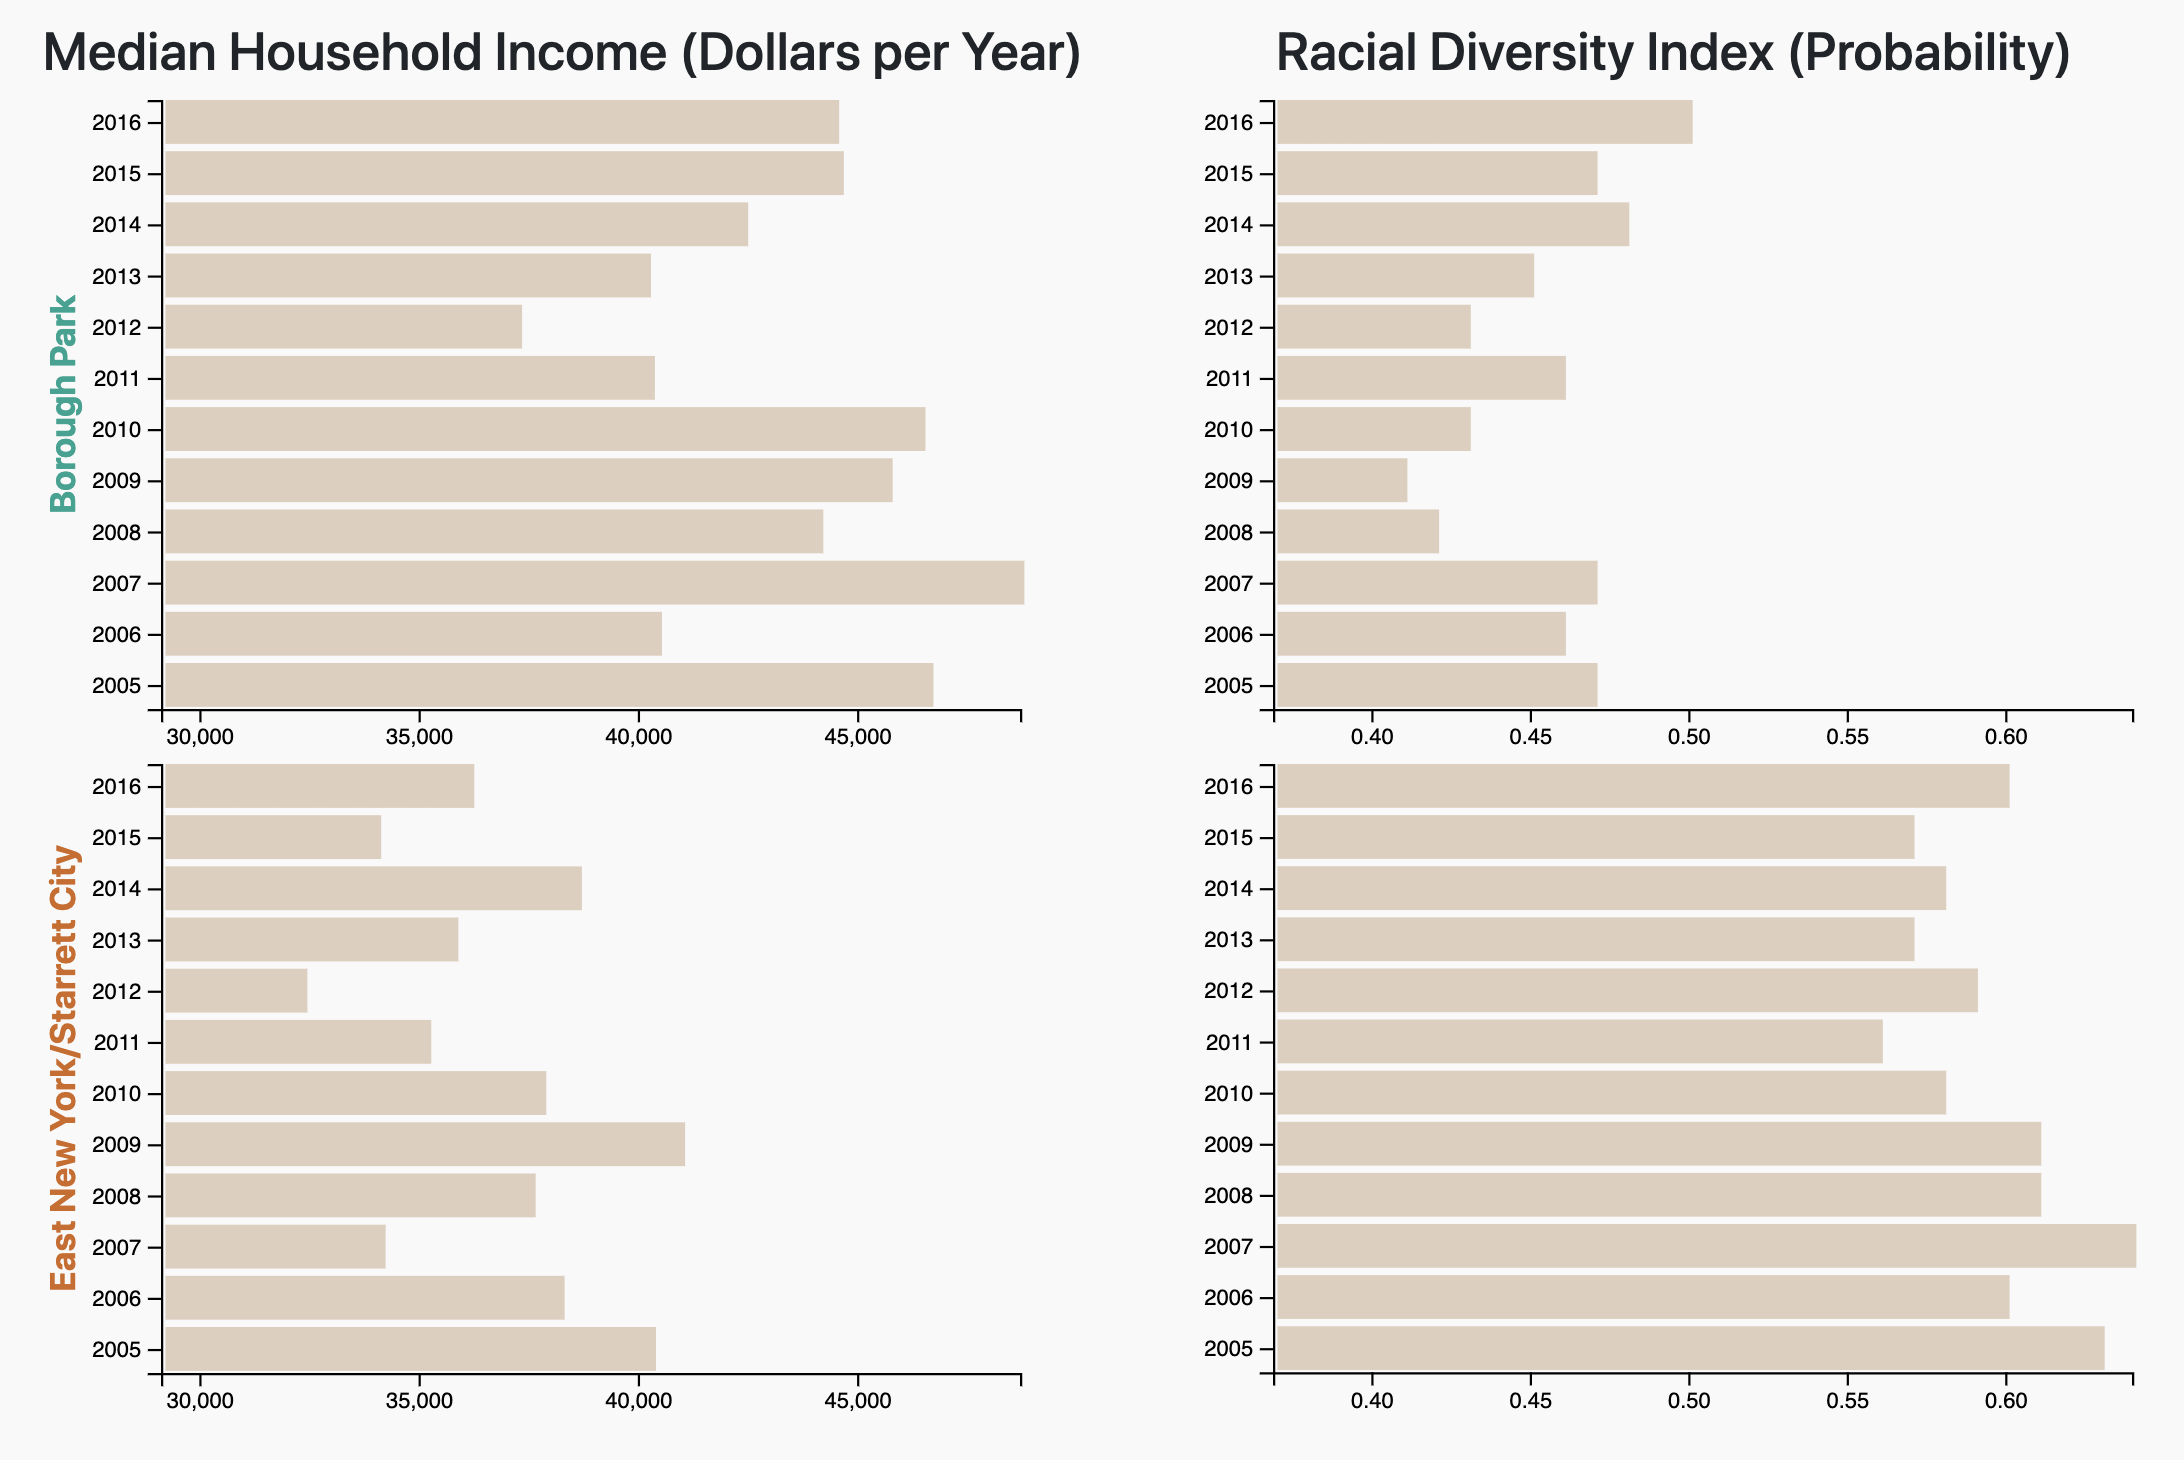
Based on the above screenshot, users can easily compare the Median Household Income of Starrett City and Borough
Park, while at the same time also being able to look at the data concerning the population of both subboroughs.
Because we keep the axes for each attribute seperate, users will not accidentially mis-identify trends in our
data,
compared to our previous line chart idea.
Implementation Breakdown
Select Gentrification Attributes
Originally, we wanted to have checkboxes that users could select multiple attributes from. However, this idea
presented many design issues. During milestone 2, we determined that using line charts wouldn't be feasible as it
could mislead users and could only support up to two different y-axes. With out new bar chart design, we still
could only support up to 2 attrbutes at a time while maintaining a simple design. This prompted us to implement
two drop down menus instead where users can select up to two attributes at a time. Users also have the option to
select "No attribute selected" if they only want to analyze on attribute at a time.
Map of NYC
There are three main functions for our Map of NYC feature. The first function can be accessed through the
year-slider, which makes the coloring of the map to display attribute data from different years. The second
function is the coloring of the map itself. By calculating gentrification scores, we are able to color encode the
map with different shades of coloring. This is meant to show which subboroughs are possibly more gentrified than
others. The last function is that users can select up to 2 subboroughs from this map which will then generate up
to 2 bar chart visuals that show the data of the selected attributes.
Bar Charts
Originally, we had wanted to create a timeseries linechart that overlayed different lines for different selected
attributes. But after consulting with Prof. Ottley, we determined that this would not work as different
attributes had different units. Additionally, we chose not to implement a line chart with two y-axes because this
could potentially be misleading to the user. This inspired our 2x2 bar chart visualization where the top half and
bottom
half represent data for different subboroughs. The left-column and right-column represent different attributes
selected. As users hover over certain bars, they will be shown the specific value associated with that bar. We
believe this bar chart visual accomplishes our goal of not only allowing users to compare subboruoughs and
analyze specific data from specific years, but it also does so in a clean and non-confusing manner.
User Studies
User Tasks
Our user studies were split into four sections:
Spend the first 5 minutes having the user explore the website without giving them any context of background
info whatsoever. During this time, do not give the user any hints even if they ask.
Ask the following questions:
Does subborough X become more or less gentrified over time base on attribute Y?
In Year X, does subborough A or subborough B have more attribute Y?
In Year X, based on attribute A and attribute B, is subborough A or subborough B more gentrified?
After the user has finished using the visualization, ask the following questions:
What do you like about this visualization?
What do you not like about this visualization? And how would you fix it?
What questions do you have about this visual?
Is it clear how the subboroughs are colored?
Record observations and offer solutions to any pain points participants may have
Feedback
Overall feedback was positive, but here were some criticisms our users had:
Participant did not know that you could click on subboroughs in map
The methodology for coloring the map of NYC was not clear. Ex. Why are some boroughs darker than others?
Did not know that two attributes can be selected instead of one
What are the units of the attributes?
Cannot see the exact value of certain attributes given a specific year
Excessive whitespace and elements not aligned with eachother
Explain the concept of gentrification...some people don't know what it means
Refining visualization based on feedback
In response to our feedback, we made the following improvements:
Fixed spacing related issues so that no scrolling is needed to experience entire visualization
Added popup modal on window load that forces users to read about the functionality of the visual so that they
know what to do when using it.
Added unit descriptions for selected attributes
Used orange and green coloring for the titles of subboroughs so that users know which datasets belong to which
subboroughs
Added color gradient below NYC map and descriptive text about how the map is colored.
Tooltips are displayed when hovering over a specific bar in the barchart.
Added a "What is Gentrification?" button that defines gentrification.
Evaluation
Answering Questions
How has gentrification changed in NYC over time?
This was one of our initial questions before starting our project. After what we've learned, we now know
that such a question is actually really complex as gentrification will vary from subborough to subborough.
Specficially, we noticed trends for certain attributes that differed depending on the subborough. For example,
Chelsea/Clinton/Midtown saw a consistent
increase in Median Household Income from 2005-2016, while Flatbush undwerwent a "valley" trend that saw its
Median Household Income peak in 2005, gradually decrease afterwards, and then increase back to near its peak
in 2016.
How can we visualize gentrification in NYC?
The answer to this question has been our entire visualization project for this class! You can read about how
we implemented our visualization in this Process Book
Does gentrification have a positive or negative impact on NYC over time?
Overall, we learned that a negative
impact of gentrification may be complimented by a positive impact as well. Take median household income, for
example. In some subboroughs, like Chelsea/Clinton/Midtown and Brooklyn Heights/Fort Greene, we saw Median
Household Income increase overall during 2005-2016. On one hand this can be seen as a "good" impact in that
residents in these neighborhoods will tend to be making more money now as opposed to before. However, in
these
same subboroughs we also saw evidence of rising rent across the same time interval, which indicates a higher
cost of living for citizens.
Though we would have liked to had a definitive answer to this question, it's now obvious that such an
answer doesn't exist. We've learned that the best we can do is to shine light on what's actually happening
so that the users of our visual learn that positive impacts of gentrification can also be accompanied by
negative ones as well and vice versa.
How did the 2008 recession affect NYC?
Interestingly, the effects of the 2008 recession are captured in our visualization. This was completely
unintentional, but it was very insightful as to how the economy as a whole affected gentrification
in New York City's subboroughs. The effect of the market crash is most apparent when looking at the Median
Rent
attribute alone. The shading of the map becomes significantly lighter, and the bar charts reflect a strong dip
in the price of rent during 2008. What we took away from this is that our visualiztion is by no means a
perfect
representation of how gentrification is affecting New York City. We did our best researching attributes
related
to gentrification, and chose the ones we thought would give people the most insight; however, the attributes
we
chose
are also affected by other factors in the real world.
What attributes might best reflect the presence of gentrification in a subborough?
This question was considered very similar to: What are some metrics that might have been impacted by
gentrification?
To understand how Gentrification is affecting New York City, we have selected 6 attributes that are
strong
indicators of Gentrification. Below, is our justification for each attribute:
Housing Units: A limited housing supply for a growing population often results in rising
rent. In turn
this affects low-income households who are the least likely to keep up with the rising costs of living
in the
city.
Mean Travel Time: Long commute times could be reasoning for people to move from the suburbs
to the city
in order to shorten the time they spend everyday going to and from work.
Median Household Income: Higher household income is a consequence of having more affluent
people moving
into a specific area. This causes consumer preferences for an area to shift upwards, inviting more
businesses
that
cater to the wealthy.
Median Rent: Higher rent is a leading cause for low-income families to move out of an area.
Population: Growing populations are an overall indicator of gentrification because there is
likely to
be
a reason for why large amounts of people would want to move into an already densely-packed area like
NYC.
Racial Diversity Index: The RDI is the probability that two randomly chosen people in a given
geographic
area will be of a different race. Decreasing levels of diversity in a neighborhood have historically
been
associated with a rise in gentrification.
Reflection on visualization
One of the biggest takeaways of this project has been learning about how complicated gentrification is. Given
this, we feel that our visualization excels in breaking this down through our simple UI that allows users to
instantly view and analyze data without any excessive clicking or scrolling.
We also provide visual stimuli by coloring the map to show trends in possible gentrification that can’t be gleaned
from rows of numerical data.
One thing that we could have improved
An area of concern is subborough selection. Users are able to click and choose up to two subboroughs using the
map. Unfortunately, because the users must use the map to select the subborough, they are unable to keep one
subborough fixed while changing another. This behavior is due to limitations of the map visualization. To keep our
project visually appealing, we decided to sacrifice a bit of usability to keep the display from getting cluttered
up by listing. Alternatives to using the map could've been a dropdown menu, or a list of buttons. However, listing
all of New York City's 55 subborough's on the visualization could overwhelm the user and worsen the UI more than
the map.
What did you learn about your data?
Our biggest lesson was that sometimes data isn't meant to offer definitive yes/no answers. Many times it's there
to help you understand the story behind it. This was evident when we realized that no amount of data could really
tell us a yes/no answer on whether gentrification was having a positive or negative effect on NYC. What we did end
up doing, however, was learn that each set of data we collected would somehow influence or influence another set
of data. This then spurred us to see our visualization as a way to systematically illustrate these relationships
between different attributes.