1. Background and Motivation
Being from Florida, amusement parks have always been in my backyard, and I grew up having season passes to Universal Studios and Busch Gardens. I noticed that even when I visited during the “off season,” it could still be shockingly busy. This motivated us to create a Walt Disney World Trip/Time Optimizer that uses historical data instead of anecdotal advice such as “visit in September” or “avoid holidays and weekends.”
Our goal is to build a tool that allows users to figure out when the best time for them to go to Disney is based on historic wait times, crowd levels, and their own availability. By turning years of historical data into an interactive planning tool, we hope to improve the trip-planning process and demonstrate the practical value of data visualization.
2. Project Objectives
Guiding Question: How can historical Walt Disney World wait-time data be used to determine the optimal time and strategy for visiting Walt Disney World while minimizing wait times and maximizing ride experiences?
Our visualization is intended to answer:
- When is the best time of year to visit each Disney park?
- Which months have the shortest average wait times?
- Which park is busiest during different seasons?
- How do crowd levels and wait times differ by day of the week, month, and season?
- Which attractions consistently have the highest average wait times within each park?
- How do special events and holidays impact crowd levels?
- How can visitors choose travel dates based on their priorities and constraints?
- What historical patterns can be used to recommend the best times to visit Walt Disney World?
3. Project Benefits
- Identify low-crowd travel periods.
- Compare congestion across the Walt Disney World parks.
- Explore historical crowd-level and wait-time trends.
- Receive personalized trip recommendations based on priorities, constraints, and historical ride wait-time trends.
- Better allocate vacation time by minimizing time spent waiting in lines and maximizing the number of attractions visited.
4. Data
Our data comes from the Walt Disney World Wait Times and Crowd Calendar dataset on Kaggle. It contains approximately 11 years of historical Walt Disney World data, including ride wait times, park crowd levels, park operating hours, date-based information, attraction information, and park identifiers for all four Walt Disney World parks.
The dataset documentation states that it was scraped from Queue-Times.com. The original CSV files used in this project are preserved in the repository’s archive/ folder. In other words, “raw files” refers to the unmodified source CSV files before our cleaning and metric-generation steps; it does not refer to a second data source.
5. Dataset Limitations
crowd_level_pctis not comparable across years.- Wait times are posted wait times rather than actual measured guest wait times.
- COVID-19 significantly altered park operations during 2020 and 2021.
- 2026 data represents only a partial year.
- Tracked attraction coverage changes over time.
- Special events are labeled only for some parks and years.
- Weather data is limited and does not provide a complete precipitation record.
6. Data Cleaning
- Removed observations from 2020–2021 due to COVID-19.
- Removed observations from 2026 because the data is partially incomplete.
- Converted date fields into a consistent format and checked required fields.
- Verified consistency among park identifiers, attraction names, and date fields.
- Removed duplicate park-day records.
- Added month number, season, and operating hours for visualization and analysis.
- Preserved the source files in
archive/and generated cleaned files indata/cleaned/.
The reproducible cleaning and metric-generation code is in scripts/clean_data.py.
7. Handling Dataset Limitations
- Because
crowd_level_pctis not comparable across years, we usecrowd_rel_to_yearfor cross-year crowd comparisons. - Because attraction coverage changes across years, ride summaries report the years observed and should be interpreted as tracked-attraction patterns.
- Because waits are posted rather than actual waits, recommendations focus on relative crowding and wait-time patterns.
- Event-based analyses primarily focus on years where special-event labels are available.
8. Derived Metrics
- Average Monthly Crowd Score: average relative crowd for each park by month.
- Day-of-Week Congestion Score: average relative crowd by weekday and park.
- Ride Demand Score: attraction wait time relative to other tracked rides in the same park.
- Park Congestion Ranking: comparison of parks using crowd levels and posted wait-time patterns.
- Crowd Stability Score: variability of crowd levels within a month.
- Attraction Importance Score: ranking attractions using average and maximum posted waits.
- Best Time to Visit Score: a prototype score combining lower crowd and crowd stability.
9. Exploratory Data Analysis
Before building the final visualizations, we looked at the cleaned data and derived summaries to find patterns in crowd levels. This helped us decide which comparisons and recommendations would be most useful to visitors.
- Monthly crowd levels: September had the lowest average relative crowd for all four parks. March had the highest average relative crowd for all four parks. This supported our decision to include a monthly crowd chart and ranked month recommendations.
- Day of the week: Wednesday was the lowest-crowd day for Animal Kingdom, EPCOT, and Hollywood Studios. Sunday was the lowest-crowd day for Magic Kingdom. The busiest day was different by park, so we kept the park selection important instead of treating all parks the same.
- Season: Fall had the lowest average relative crowd for Animal Kingdom, Hollywood Studios, and Magic Kingdom. Summer had the lowest average for EPCOT. This showed that the best season can depend on the park.
- Holidays and special events: Holidays were busier than ordinary days at all four parks. Special-event days were not always busier. For example, Magic Kingdom had lower average relative crowd on the special-event days included in the data. Because event labels are not available for every day, these results should be treated as patterns rather than predictions.
These findings come from derived_monthly_park_summary.csv, derived_weekday_park_summary.csv, derived_season_park_summary.csv, and derived_event_impact.csv. We use relative crowd values because they make comparisons across years more meaningful. The results also helped us focus the prototype on park selection, monthly patterns, and lower-crowd recommendations. The weekday, season, and event comparisons are areas we can expand in a later version of the tool.
10. Visualization Design
The original proposal identified the following visualization ideas and features:
Original designs from the project proposal
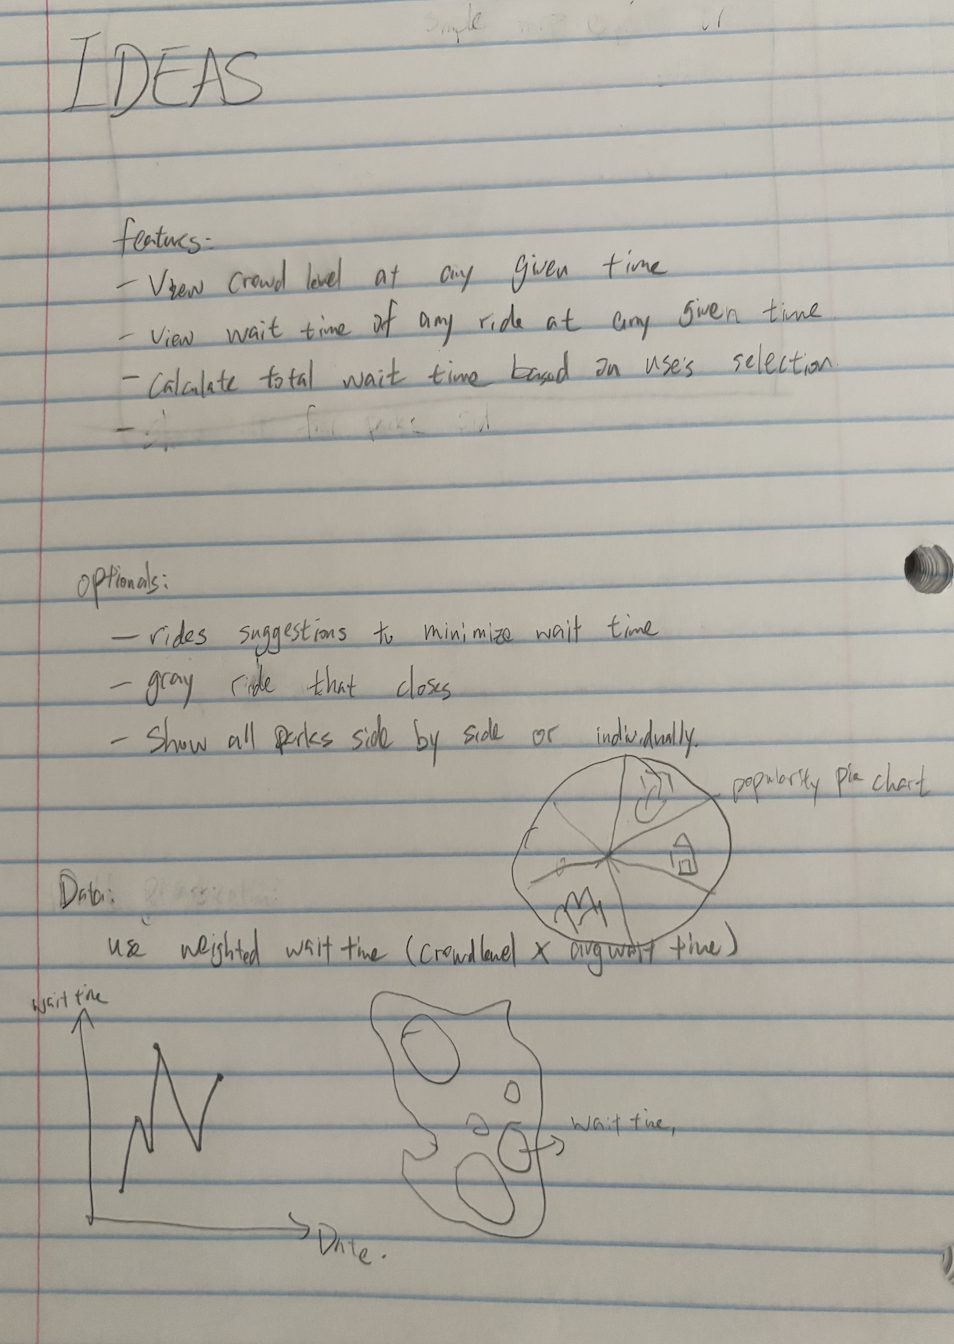
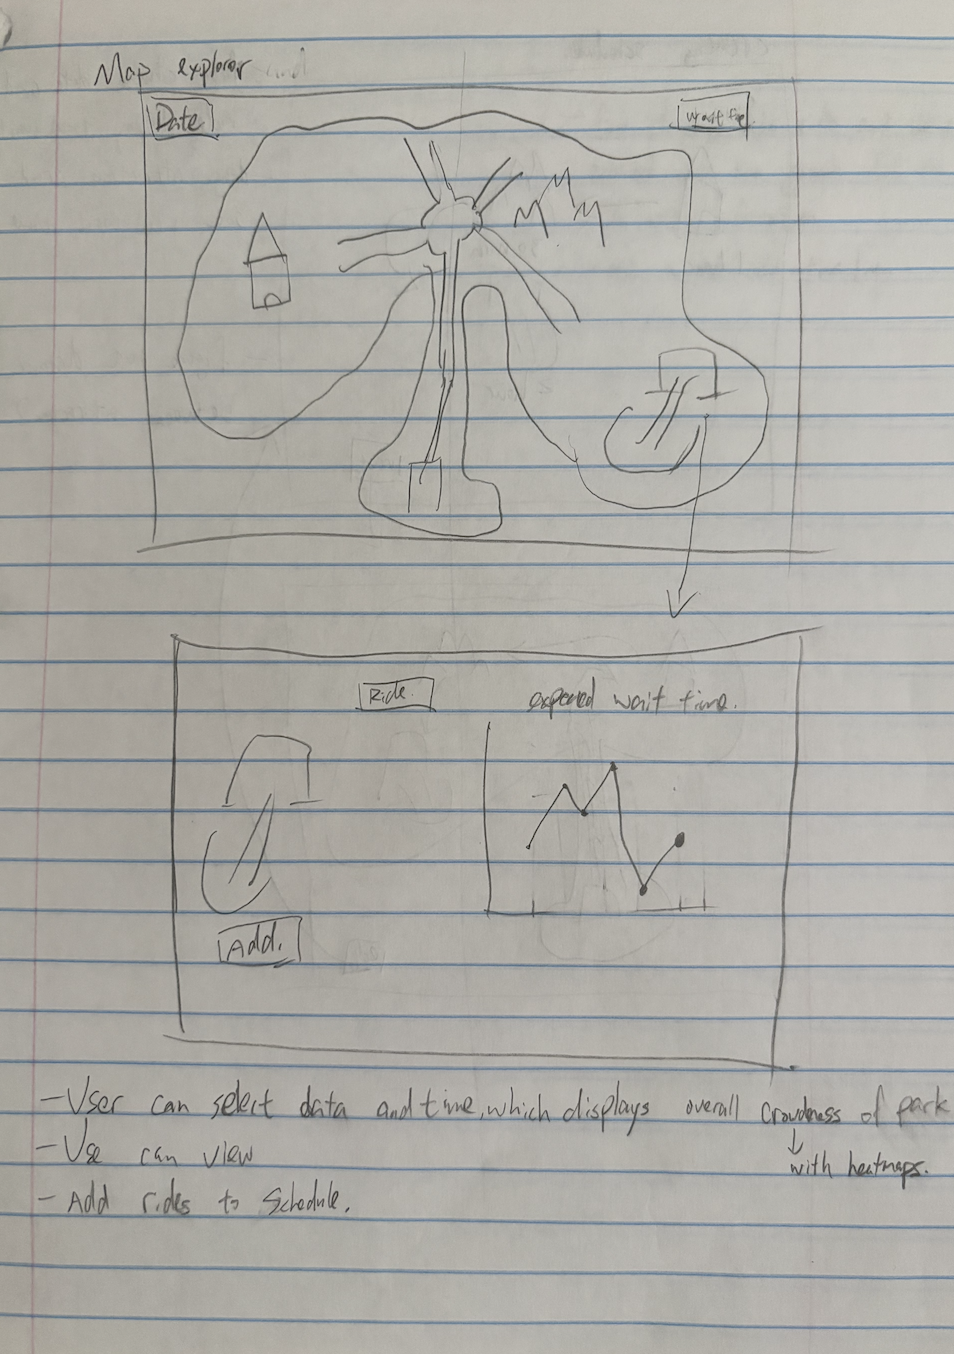
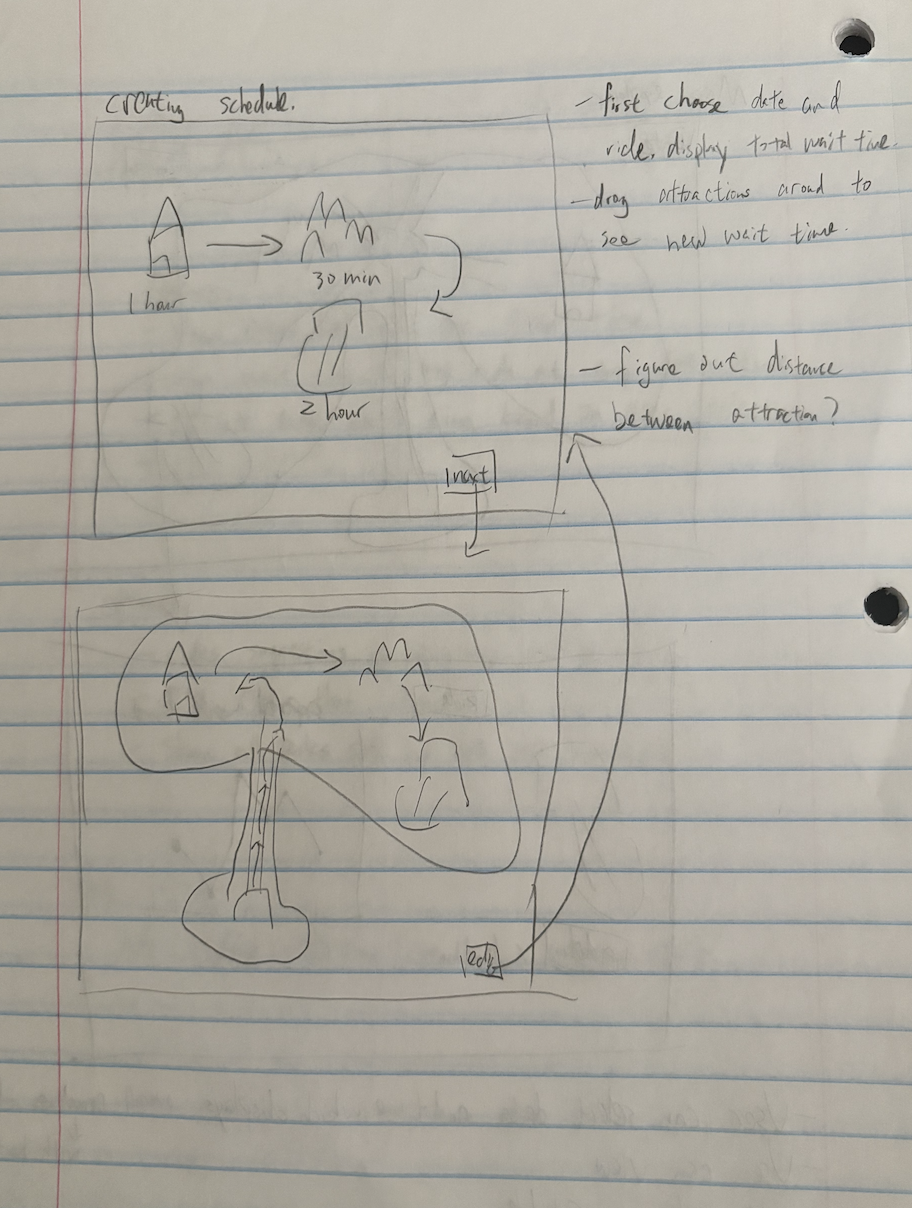
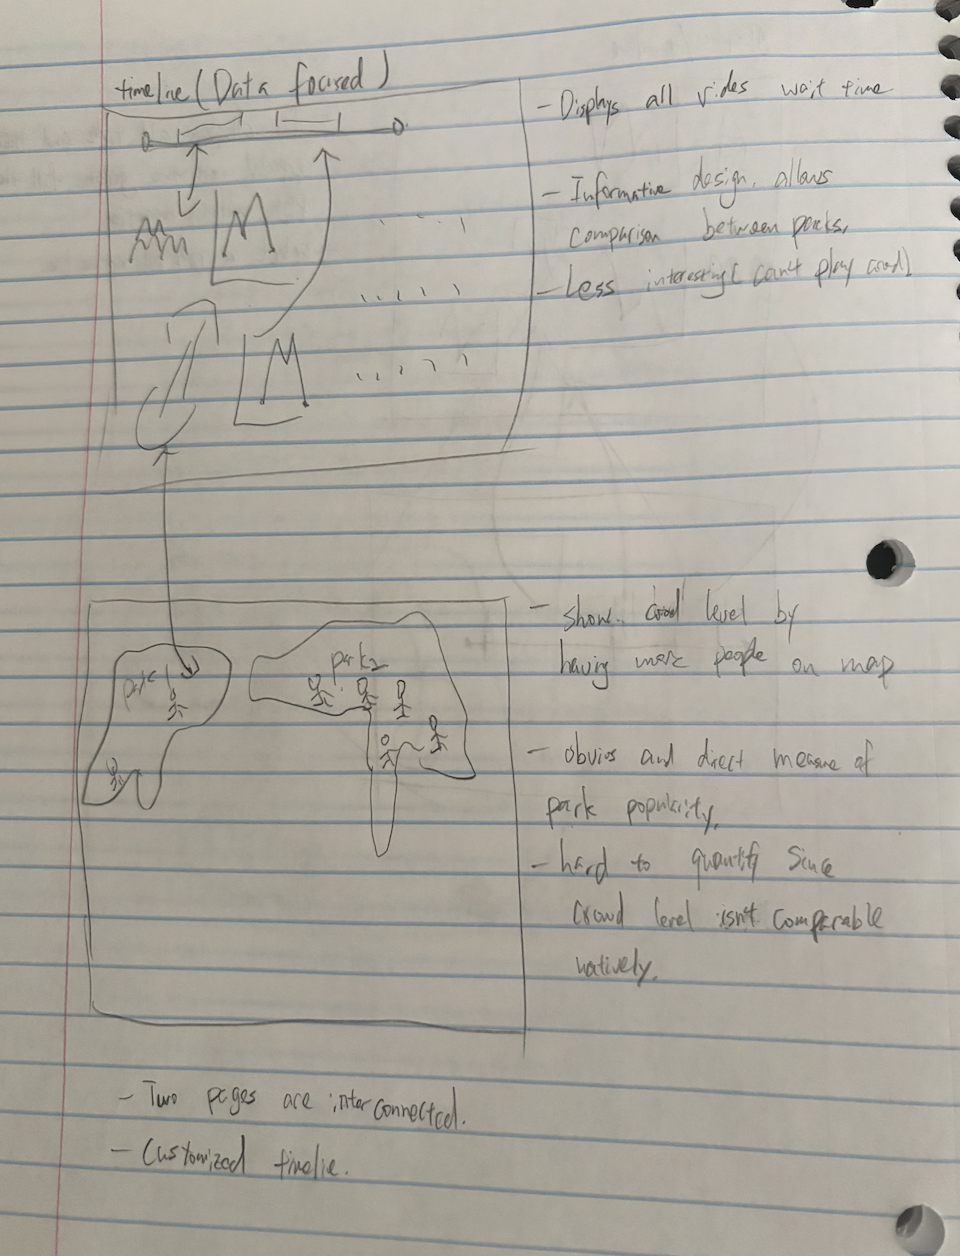
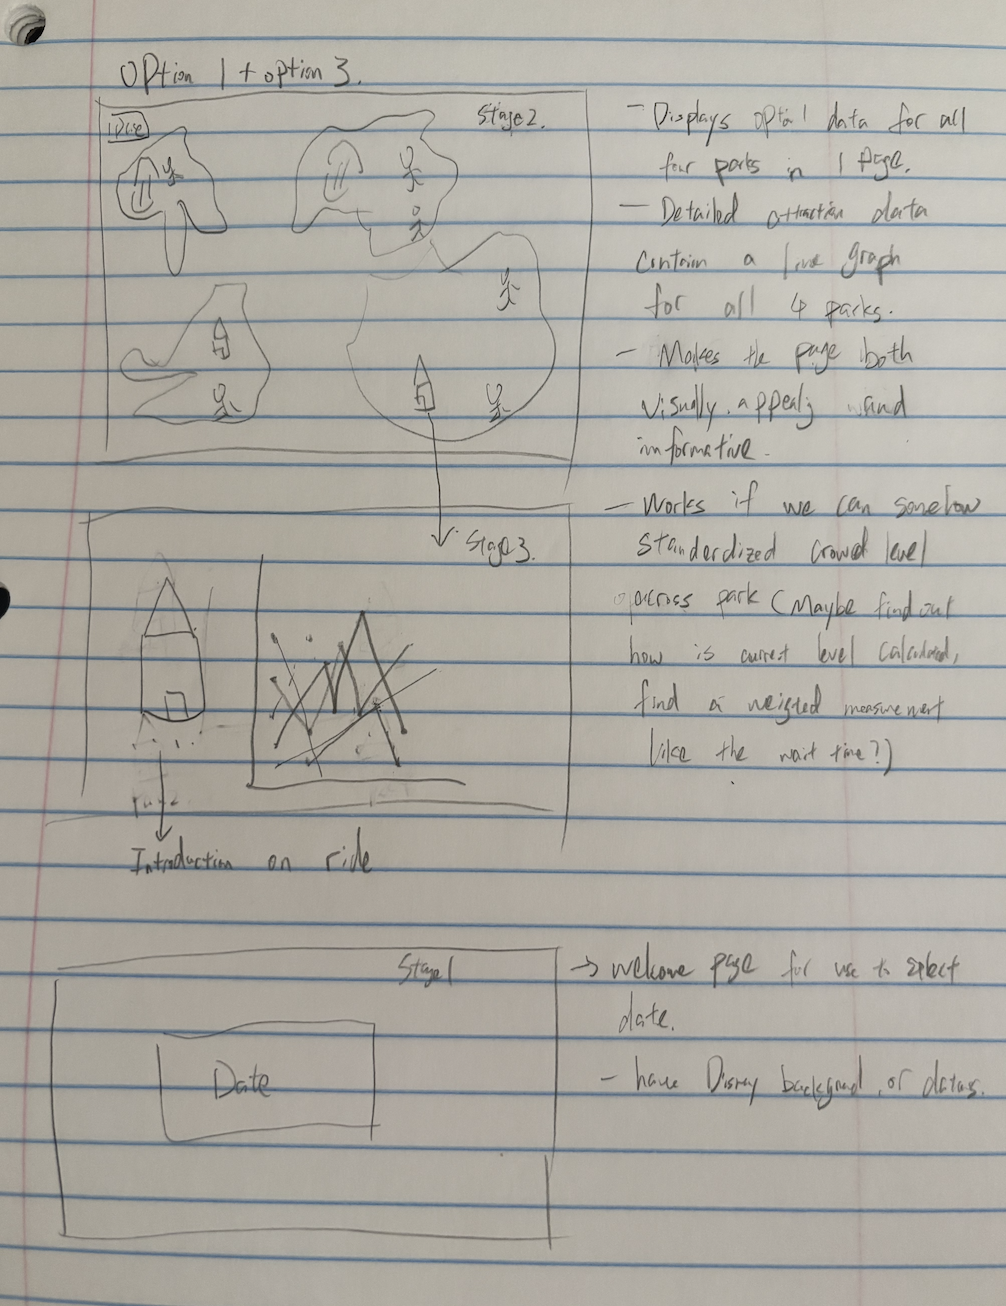
The original sketches were created by Thomas and are above.
11. Implementation and Interaction
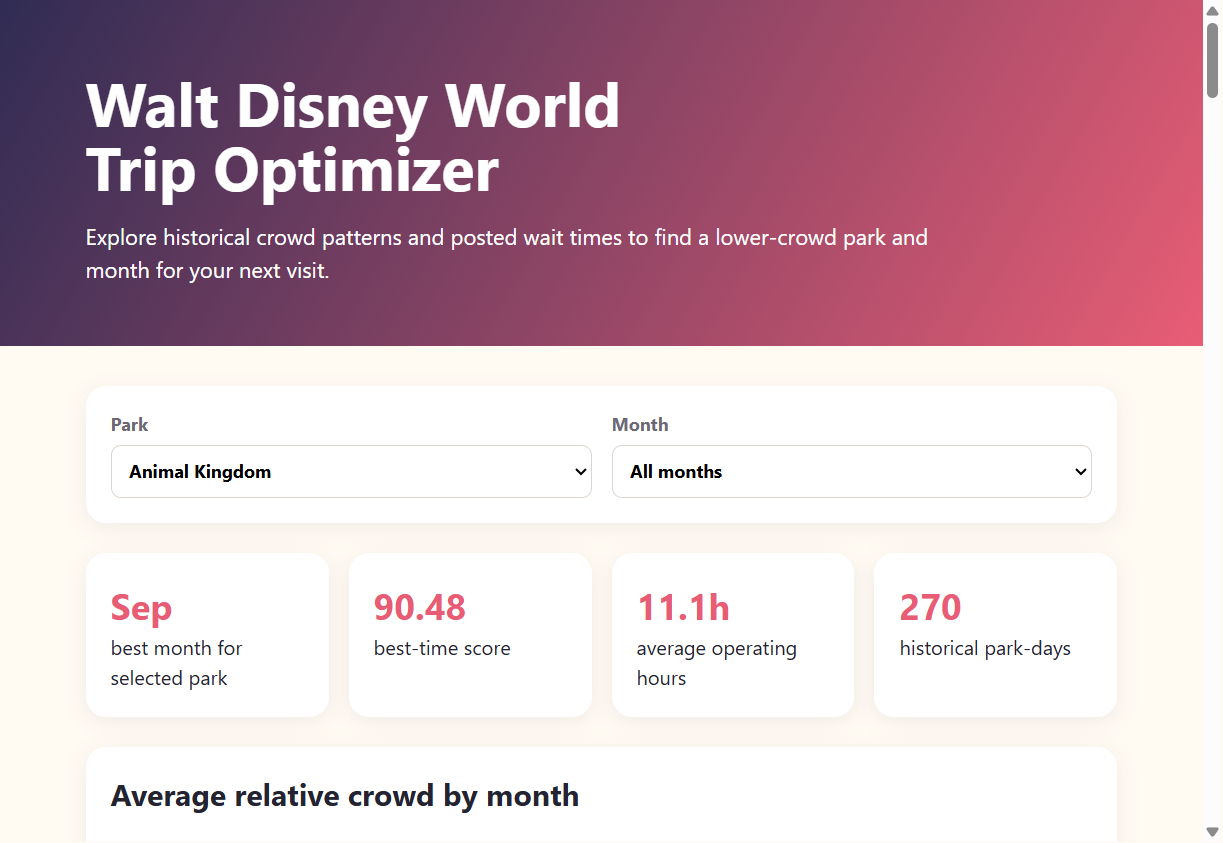
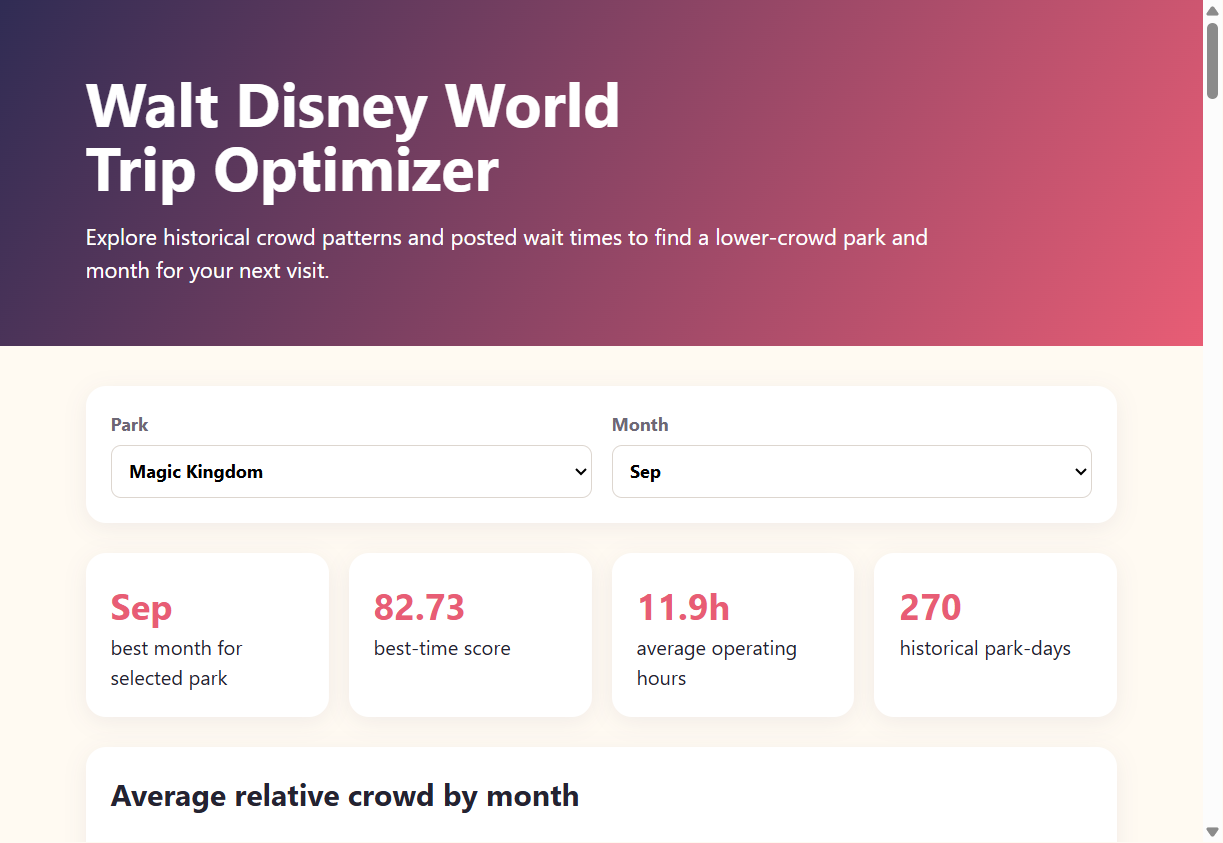
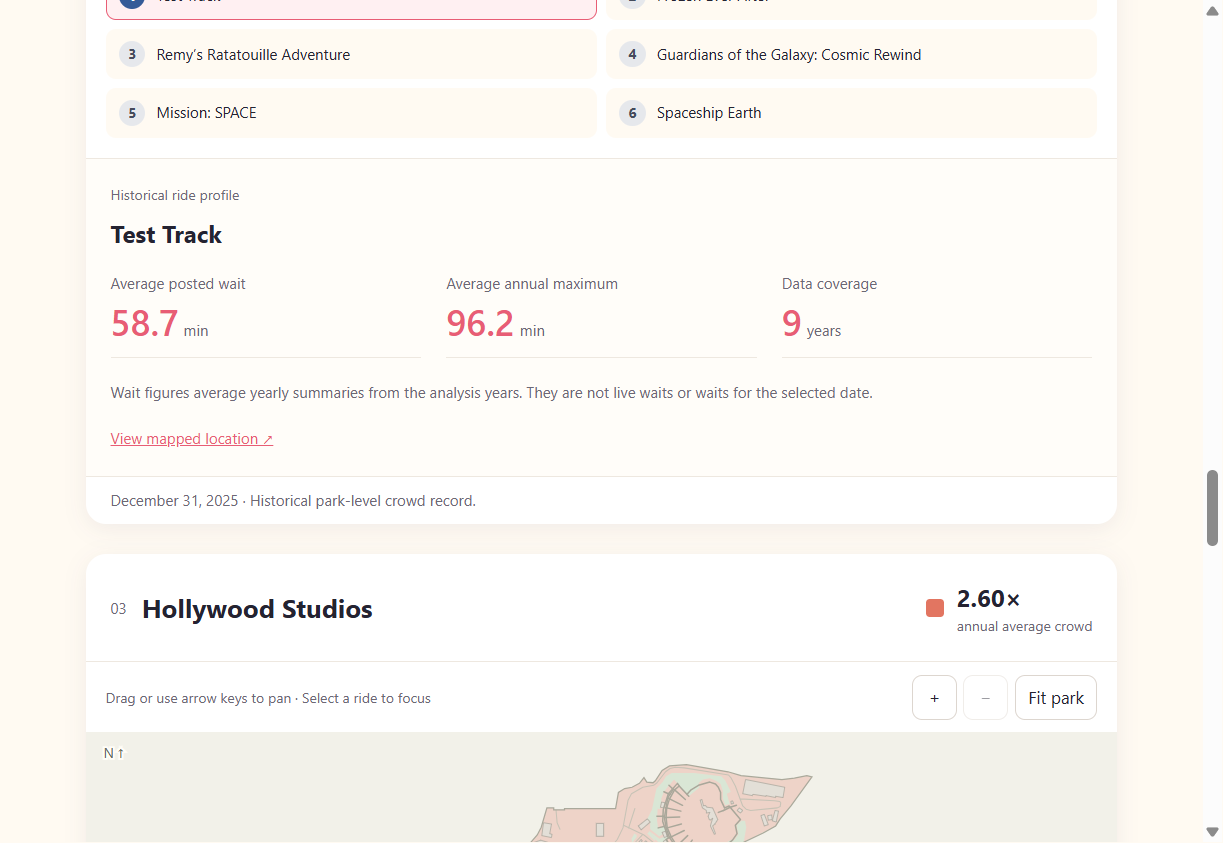
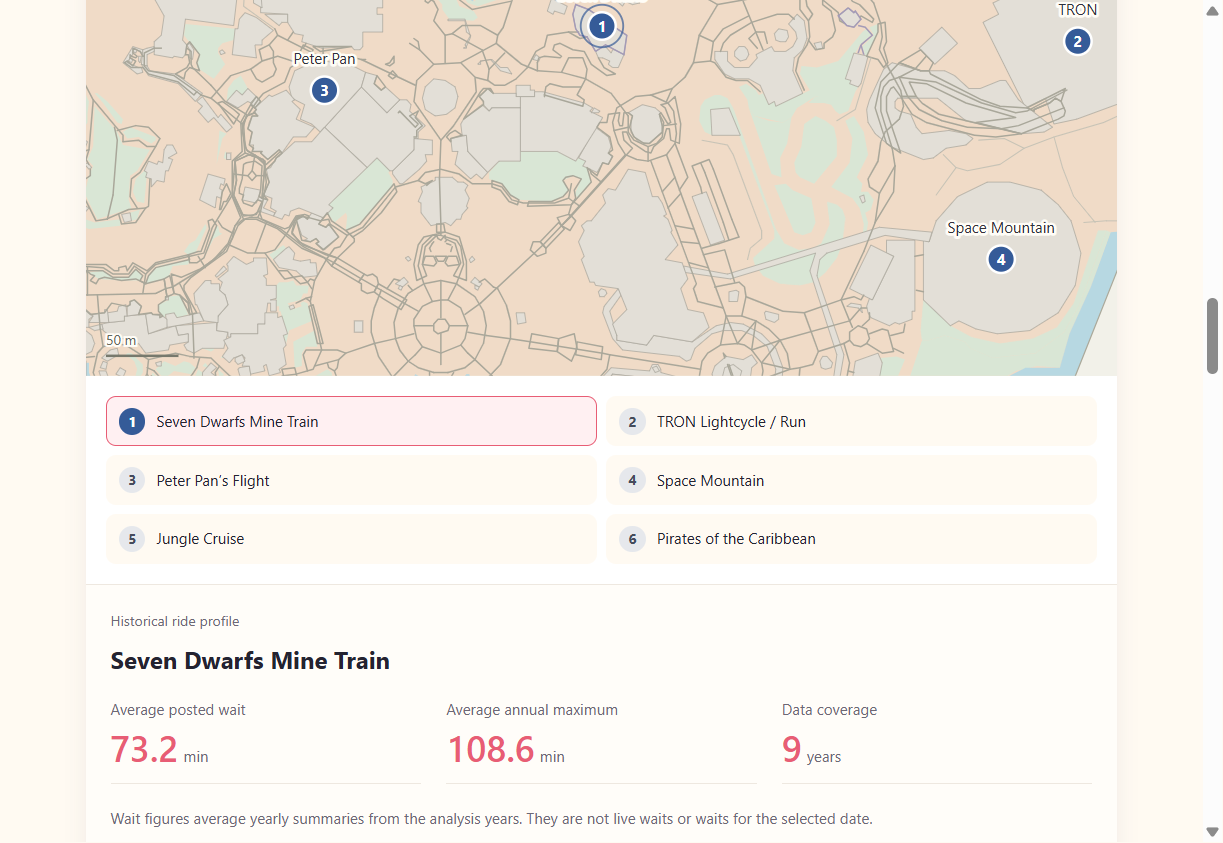
The prototype uses park and month selections to update the crowd summary, monthly chart, attraction rankings, and recommendation table. The map section uses a shared date picker to show historical crowd levels for all four parks. Users can also select a ride marker or ride button to view its historical posted-wait profile.
12. Project 1 Update
For Project 1, our data acquisition and data structures are complete, and we have a working visualization prototype. The current prototype includes park and month filters, a monthly crowd chart, top attraction posted-wait rankings, and ranked recommendation options.
The prototype also includes four maps for Magic Kingdom, EPCOT, Hollywood Studios, and Animal Kingdom. A shared historical date picker updates the park-wide relative crowd colors across all four maps. Selecting any of the 24 ride markers or ride buttons focuses its location and displays a profile with historical average posted wait, average annual maximum posted wait, and years observed.
The cleaned dataset contains 12,651 park-day records across all four parks, covering 2015–2019 and 2022–2025. The map colors represent historical daily crowd levels relative to each park’s annual average. Ride profiles summarize multiple years of data and do not show live waits or waits for the selected date. The next iteration will add the full crowd-calendar heatmap and more personalized weighting for a visitor’s priorities.
13. Must-Have and Optional Features
Must-Have Features
- Interactive crowd calendar heatmap
- Park comparison dashboard
- Ride demand explorer
- Filtering by park, season, and date range
- Best time to visit recommendation tool
- Interactive tooltips and detailed hover information
- User-friendly and responsive interface
Optional Features
- Crowd forecasting
- Predicted total wait-time estimate
- Attraction popularity rankings
- Holiday-impact analysis
- Weather-impact analysis
- Simplified itinerary recommendations
- Mobile-optimized version
14. Evaluation and Findings
Our analysis shows that lower-crowd visits are not the same for every park. September had the lowest average relative crowd for all four parks in our data, while March had the highest. Fall was the lowest-crowd season for Animal Kingdom, Hollywood Studios, and Magic Kingdom, while summer was lowest for EPCOT. These results support using park and month selections instead of giving visitors one recommendation for all four parks.
The prototype helps users compare monthly crowd patterns, review ranked recommendations, see top attractions by posted wait, and explore historical crowd levels on the park maps. The relative crowd scale also makes the results easier to compare across years than the original crowd percentage. Together, these views answer our main question about when visitors may find lower-crowd conditions.
There are still limits to what the tool can predict. The data contains posted waits rather than actual waits, attraction coverage changes over time, and 2020–2021 and partial 2026 data were excluded. Event labels are also incomplete, so event comparisons should be treated as patterns rather than predictions. The current recommendations use historical crowd and stability scores, not a guarantee of future conditions.
In a future version, we would add the full crowd-calendar heatmap, weekday and season filters, more direct park comparisons, and personalized recommendations based on a visitor's priorities. These additions would make the tool more useful for planning a specific trip while keeping the current historical results as its foundation.