Disasters and Vulnerability
Basic Info
Title: Disasters and Vulnerability
Names: Barrett Lin, Hengchang Lu
Email: b.a.lin@wustl.edu, hengchang@wustl.edu
ID: 508753, 508777
Background and Motivation
Barrett: Natural disasters have always been an interesting concept to me
as they simply happen with or without human interaction. While I haven't done much
actual research into the effects they have on place, I can always remember seeing
horrific details on the news both on the cost of human life as well as disaster relief
efforts. I remember when I was in high school a snowstorm hit where I lived in Texas,
and, without the proper infrastructure to handle such cold, people were without clean
water and electricity for weeks. The key motivation for this project comes from looking
at how natural disasters have an unequal impact on locations based on their preparedness
for such disasters, seen through general variables like GDP and population density, as
well as more specific variables like relevant infrastructure. The hope for this project
is that it reveals important insights that can be acted on in order to mitigate the costs
of natural disasters in places affected the most.
Project Objectives
The primary questions we are attempting to answer with our visualization are:
-
How do natural disasters affect countries of different population density, GDP, and
infrastructure strength?
- Are natural disasters a key reason that places might struggle and remain in poverty?
-
How fast are countries able to bounce back from natural disasters and is this dependent on
existing infrastructure?
Through answering these questions, we want to learn the relationship between natural disasters
and the aforementioned variables. We want to learn these aspects so that recovery efforts can
be more targeted, and the places that desperately need help receive it and can develop the
tools to prevent future disaster. Some benefits that could come from this:
-
Extra government assistance to places heavily affected by natural disasters, either through
quicker support after the fact or building up infrastructure and wealth prior
-
Understand places of high risk, both in likelihood of natural disasters occurring and
inability/lack of speed in recovery, encouraging re-location of inhabitants or more safety
procedures depending
-
Understand how natural disasters can affect financial health of specific locations,
potentially giving companies insight on building costs/insurance plans
Data
We have found a lot of geospatial dataset on kaggle that are useful for our project. The core
dataset is the global earthquake - tsunami risk assessment dataset
(https://www.kaggle.com/datasets/ahmeduzaki/global-earthquake-tsunami-risk-assessment-dataset) containing geospatial data for over 100 historical earthquake events from 1900 to 2020 with
a focus on tsunami generation potential. It includes key features like earthquake magnitude,
focal depth, and epicenter coordinates. Data quality is especially robust for post-1960 events
due to improved monitoring.
The world GDP dataset
(https://www.kaggle.com/datasets/zgrcemta/world-gdpgdp-gdp-per-capita-and-annual-growths), based on World Bank data, is included as a core dataset to assess the socioeconomic
vulnerability of countries to natural disasters like earthquakes and tsunamis. It provides
annual metrics from 1960 onward. This dataset is crucial because GDP significantly influences
a country's ability to prepare for, withstand, and recover from severe natural disasters.
Lower GDP often correlates with weaker infrastructure, limited emergency resources, and high
casualty rates. We can use this to analyze how economic status shapes disaster impact and
recovery speed.
The EMDAT (Emergency Events Database) dataset
(https://www.emdat.be/), maintained by the Centre for Research on the Epidemiology of Disasters (CRED) provides comprehensive data on natural disasters worldwide.
This dataset includes information on fatalities, economic damage in USD, and disaster types
by country and year. We use this data to create bar charts showing countries with the highest
GDP loss (total and percentage), as well as the most afflicted countries by disaster count.
To enhance our analysis of how earthquakes and tsunamis impact a region's key infrastructure,
we incorporate more geospatial datasets on critical assets near epicenters or coastlines. This
allows us to model risks based on proximity. The dataset are:
Data Processing
We will first organize key information for our raw data. The global earthquake tsunami dataset
includes earth magnitude, focal depth, epicenter coordinates, and tsunami generation
potential. World gdp dataset contains annual metrics like total national/regional GDP, GDP per
capita, and growth rates. Infrastructure datasets comprise global aviation hubs, world ports,
powerplants, and nuclear power plants
We need to convert all datasets to compatible base formats like GeoJSON. We need to also unify
the coordinate system.
Handle missing values. We need to label missing records in the earthquake-tsunami data before
1960. For GDP data, we need to address annual missing values in small countries and regions.
For missing key infrastructure attributes, we can supplement information via official
databases.
We also need to remove some unreasonable records in the earthquake data. For example,
micro-earthquakes with magnitude < 2.0 can barely be felt and are excluded from analysis.
Also we should remove extreme outliers in the GDP data. Should there be sharp annual declines
or increases caused by wars or pandemics, we want to store them separately.
Then we link scattered datasets by the dimensions of geography and time to form a
comprehensive dataset usable for visualization. The core correlation logics are: 1. Spatial
correlation. Based on latitude and longitude, we need to calculate straight line distance
between airports, ports, powerplants and epicenters to determine if they fall within disaster
impact zones. We need to also add a temporal correlation link that binds the time at which a
disaster takes place and the socioeconomic situation of this region at the same time.
Eventually, we need two fused datasets. One is the disaster-economy table where each row
includes year, country, earthquake magnitude, tsunami potential, total GDP, and GDP per
capita. The other one is the disaster-infrastructure table where each row includes year,
country, disaster type, affected infrastructure type, number of facilities.
Visualization Design
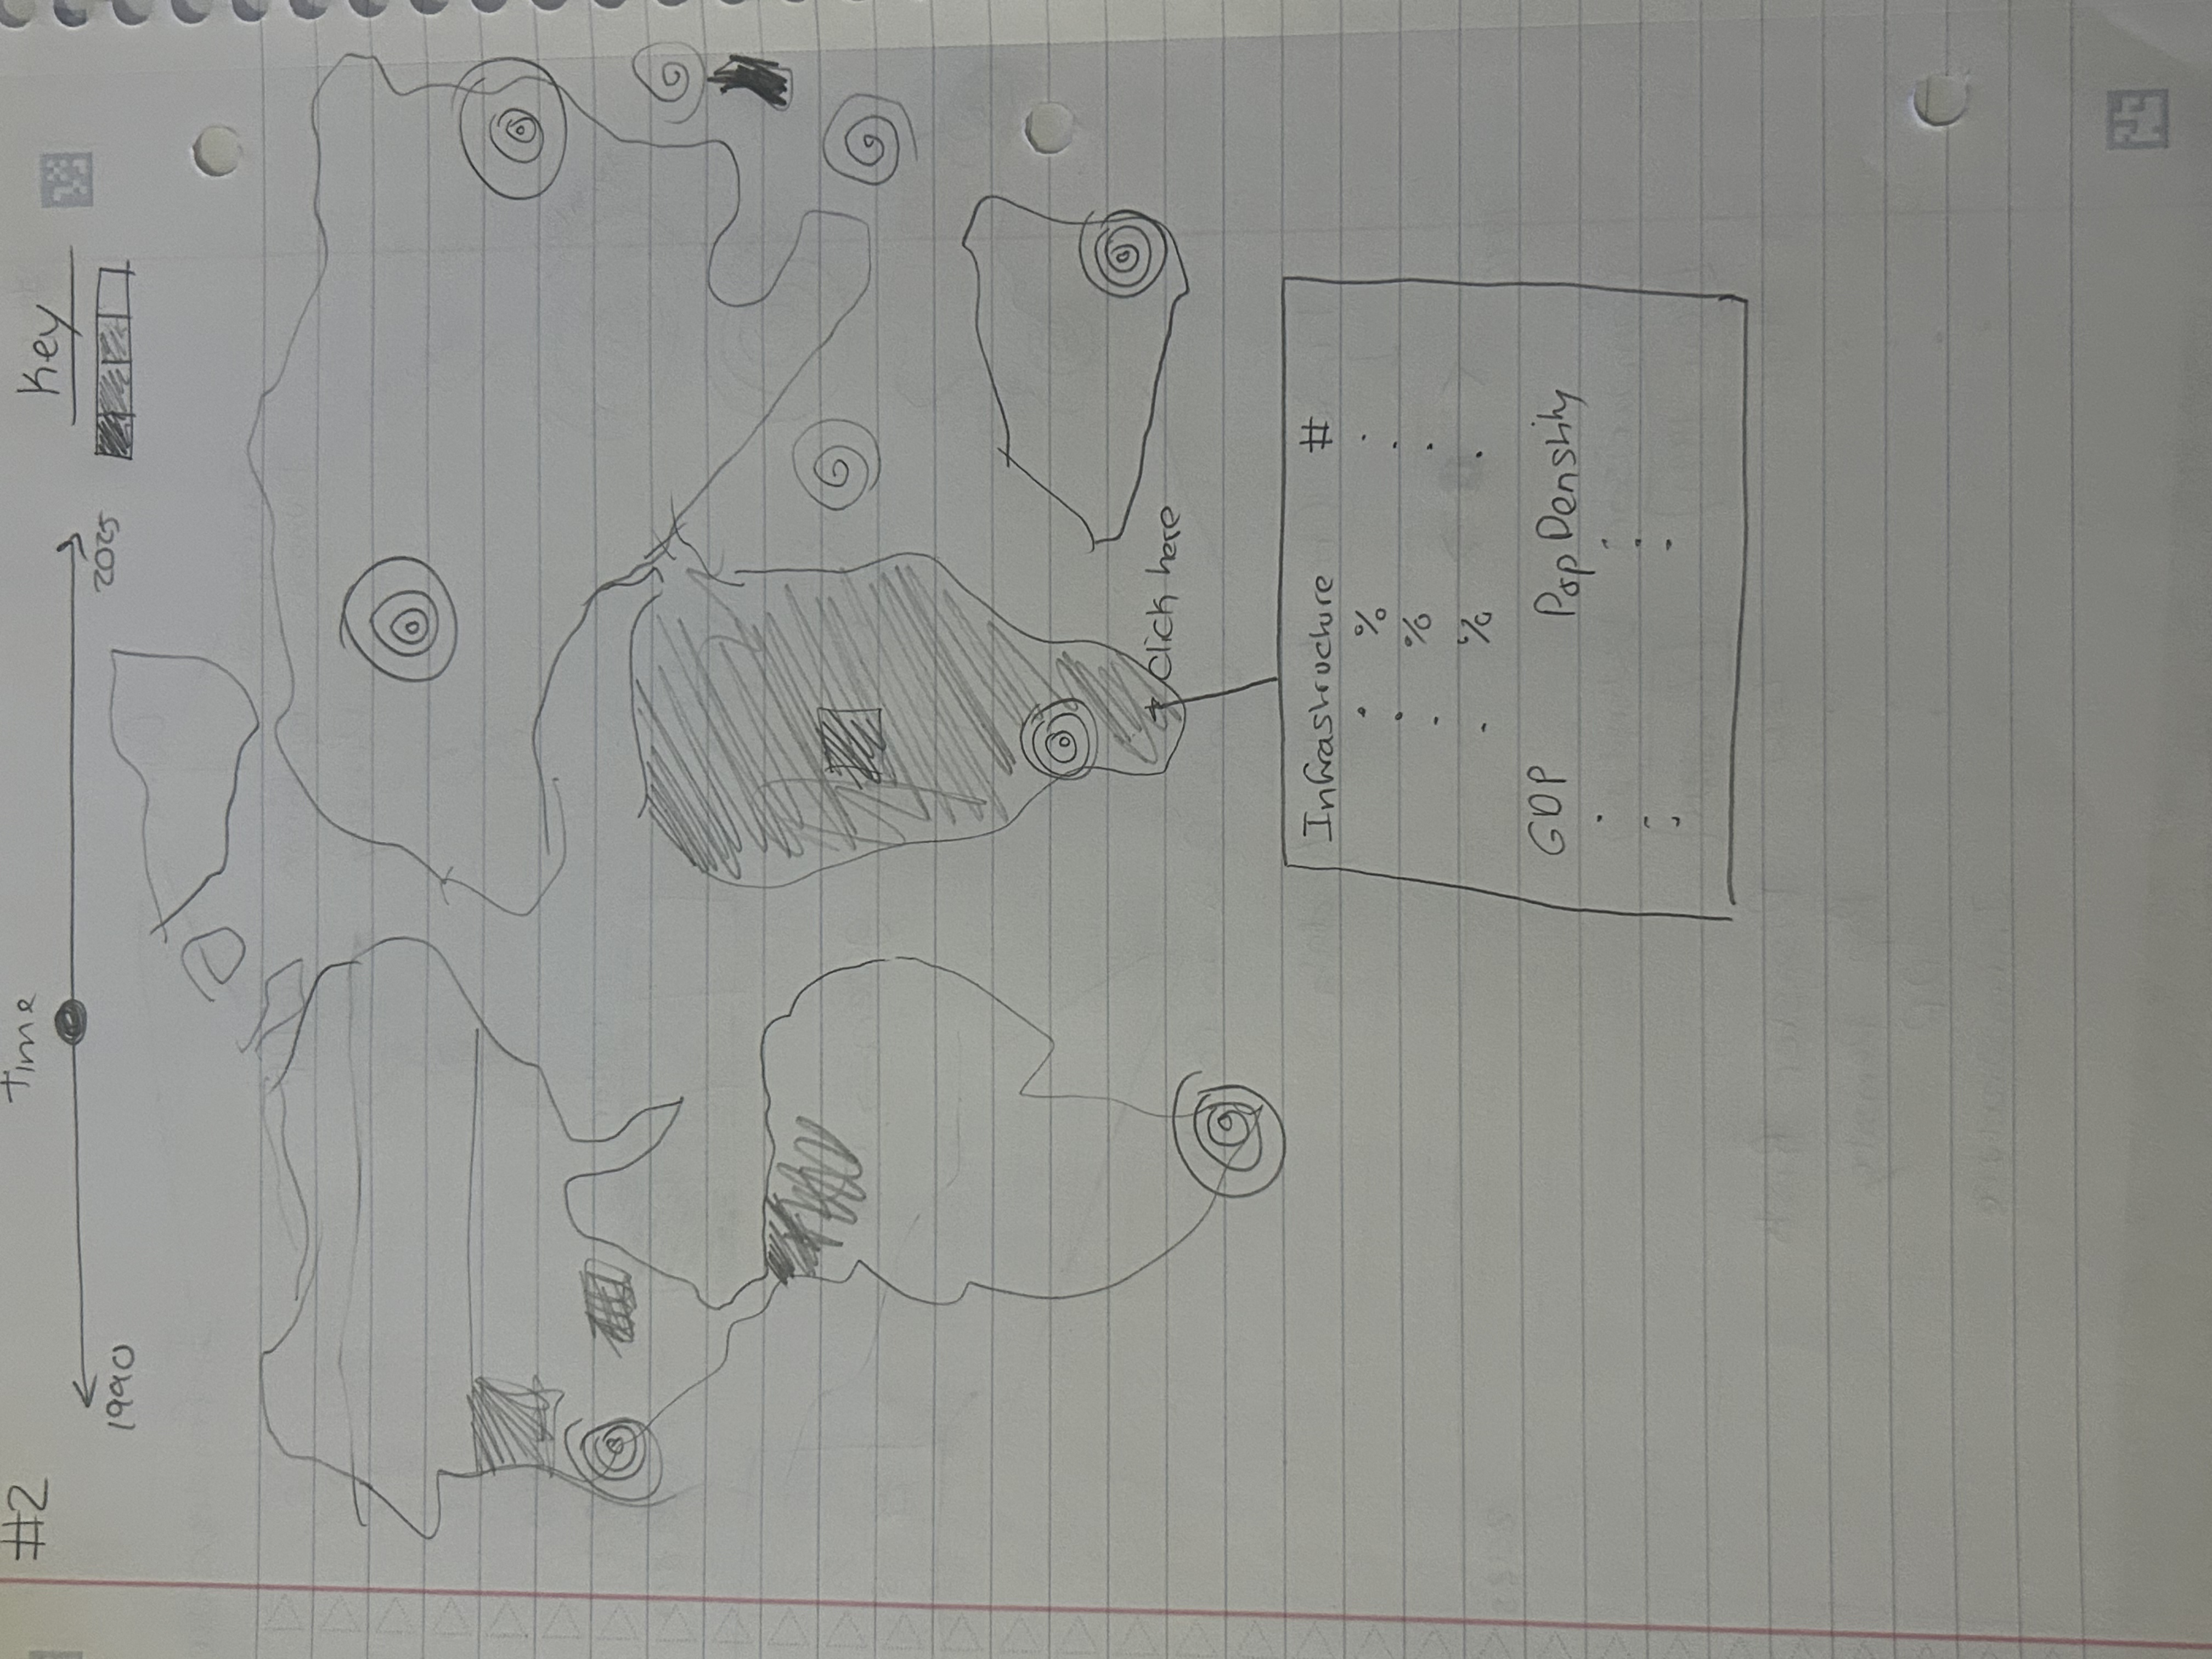
Figure 1
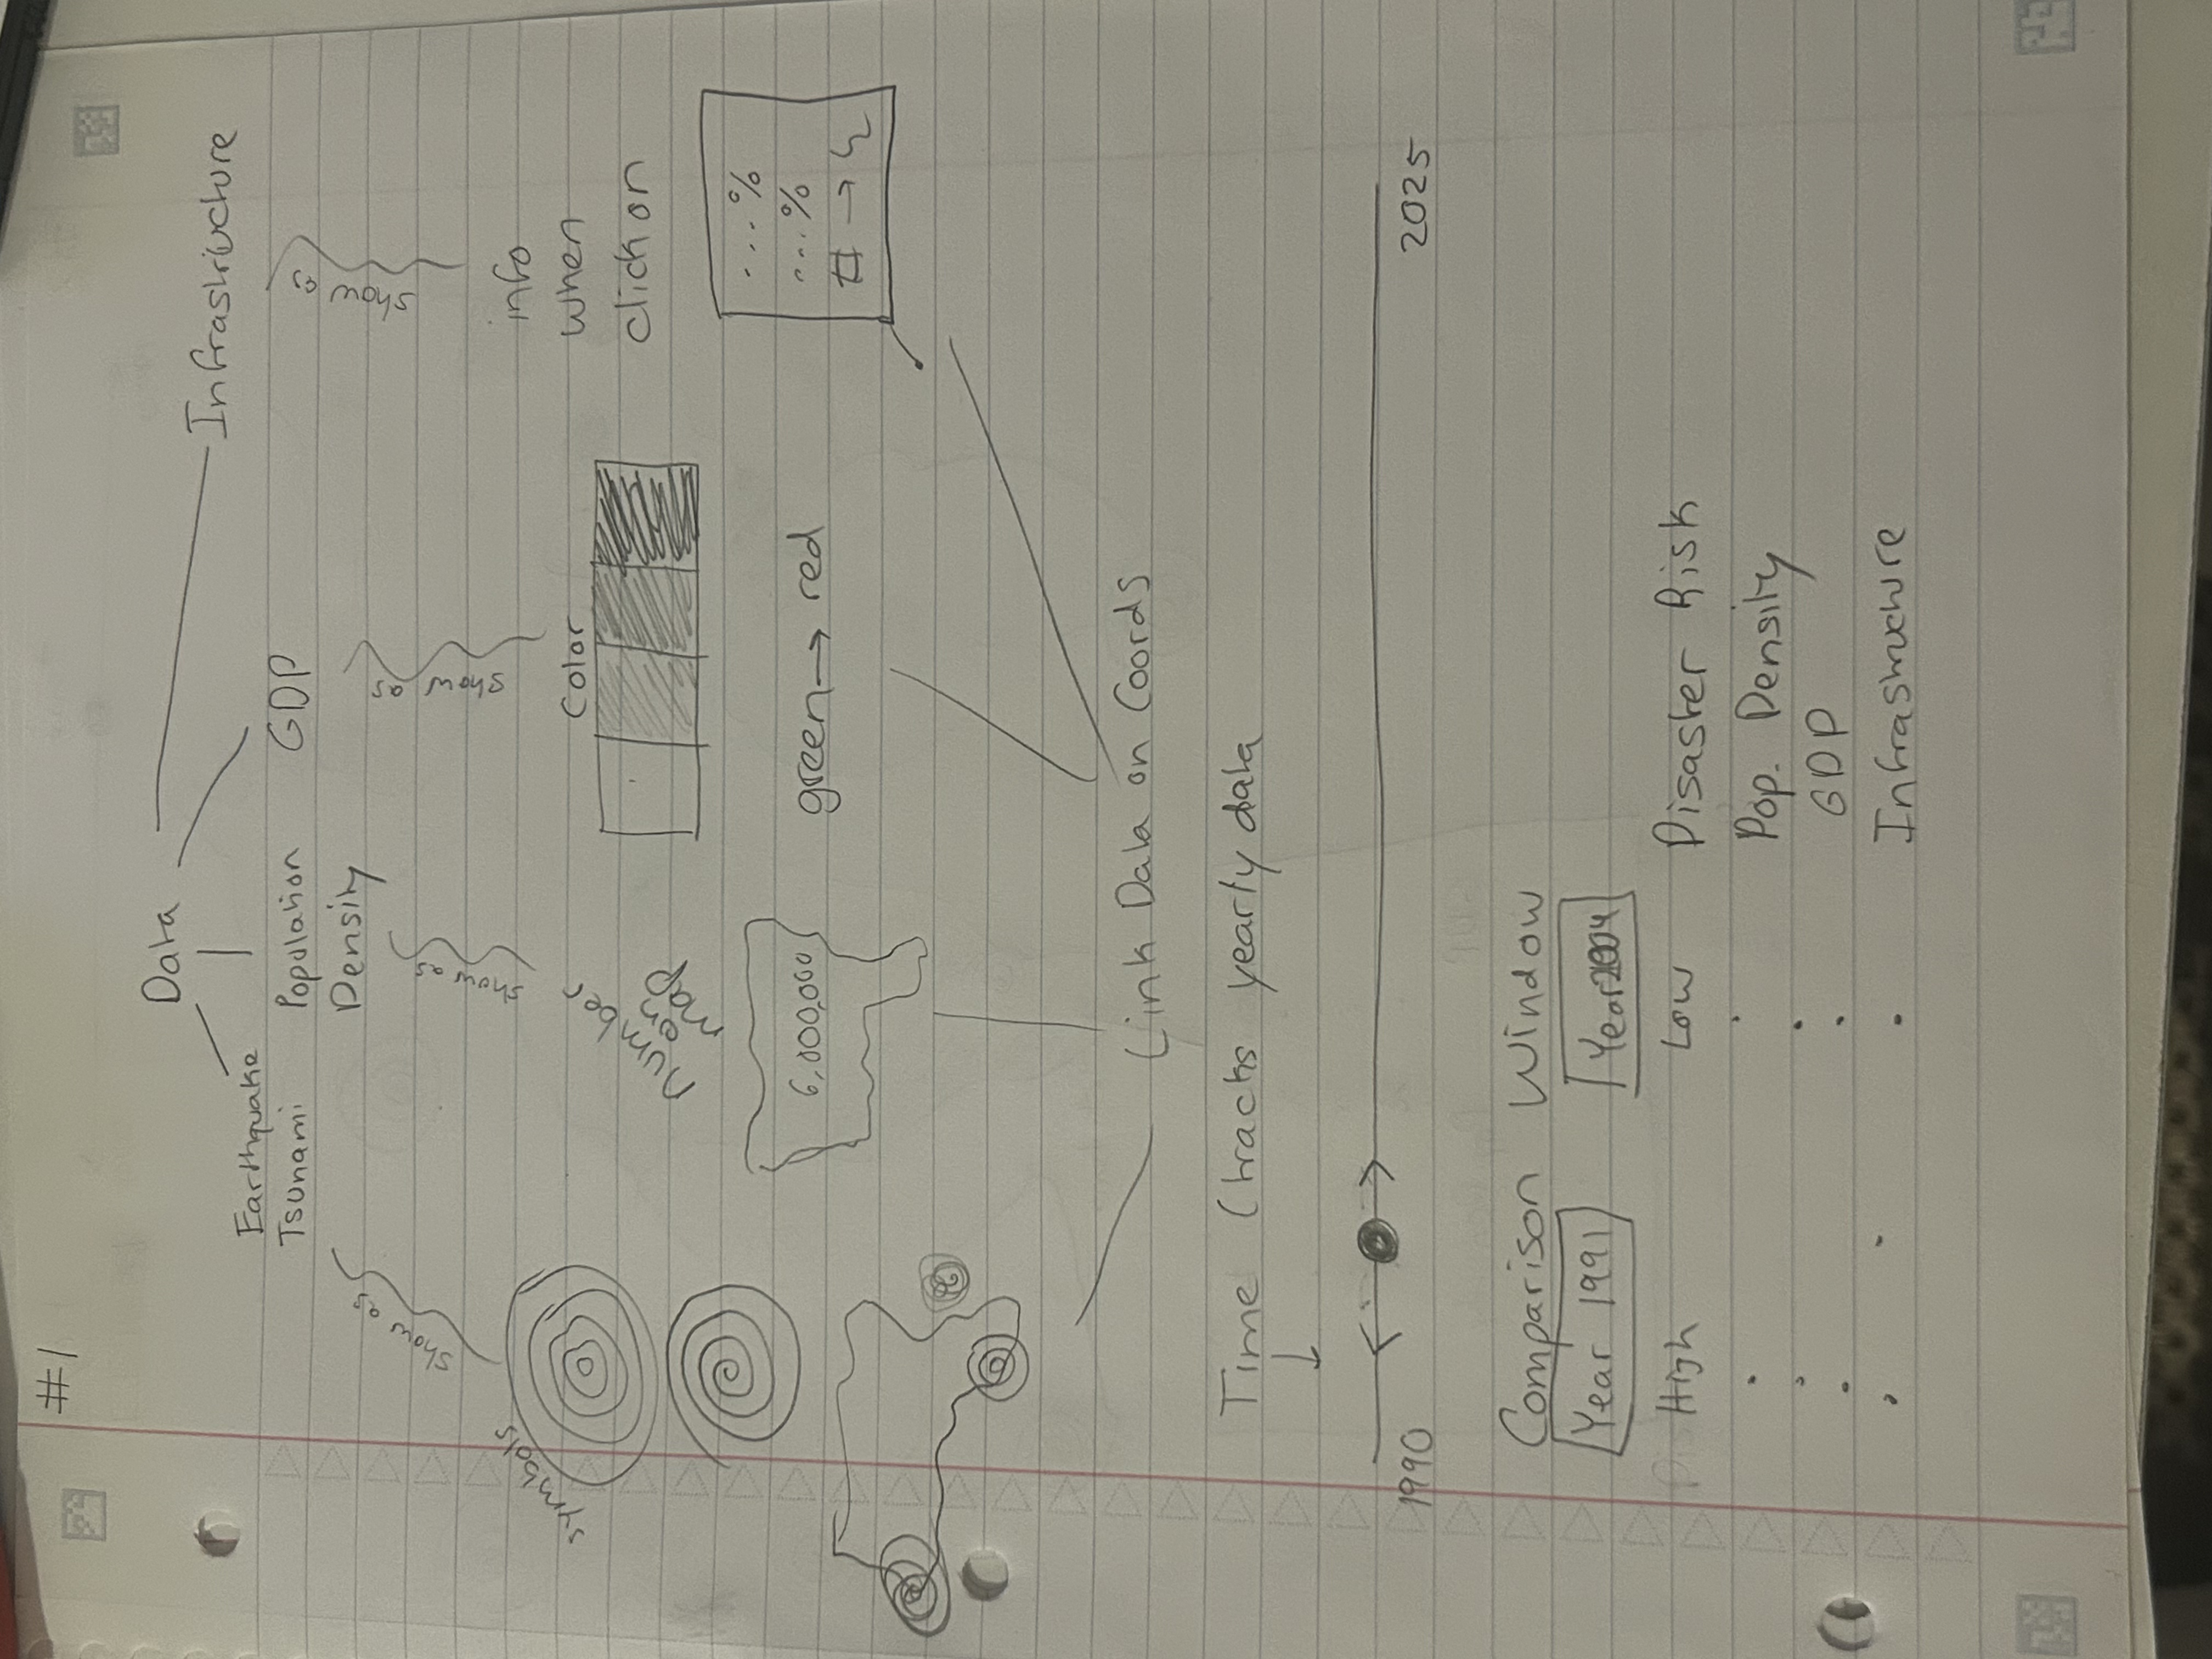
Figure 2
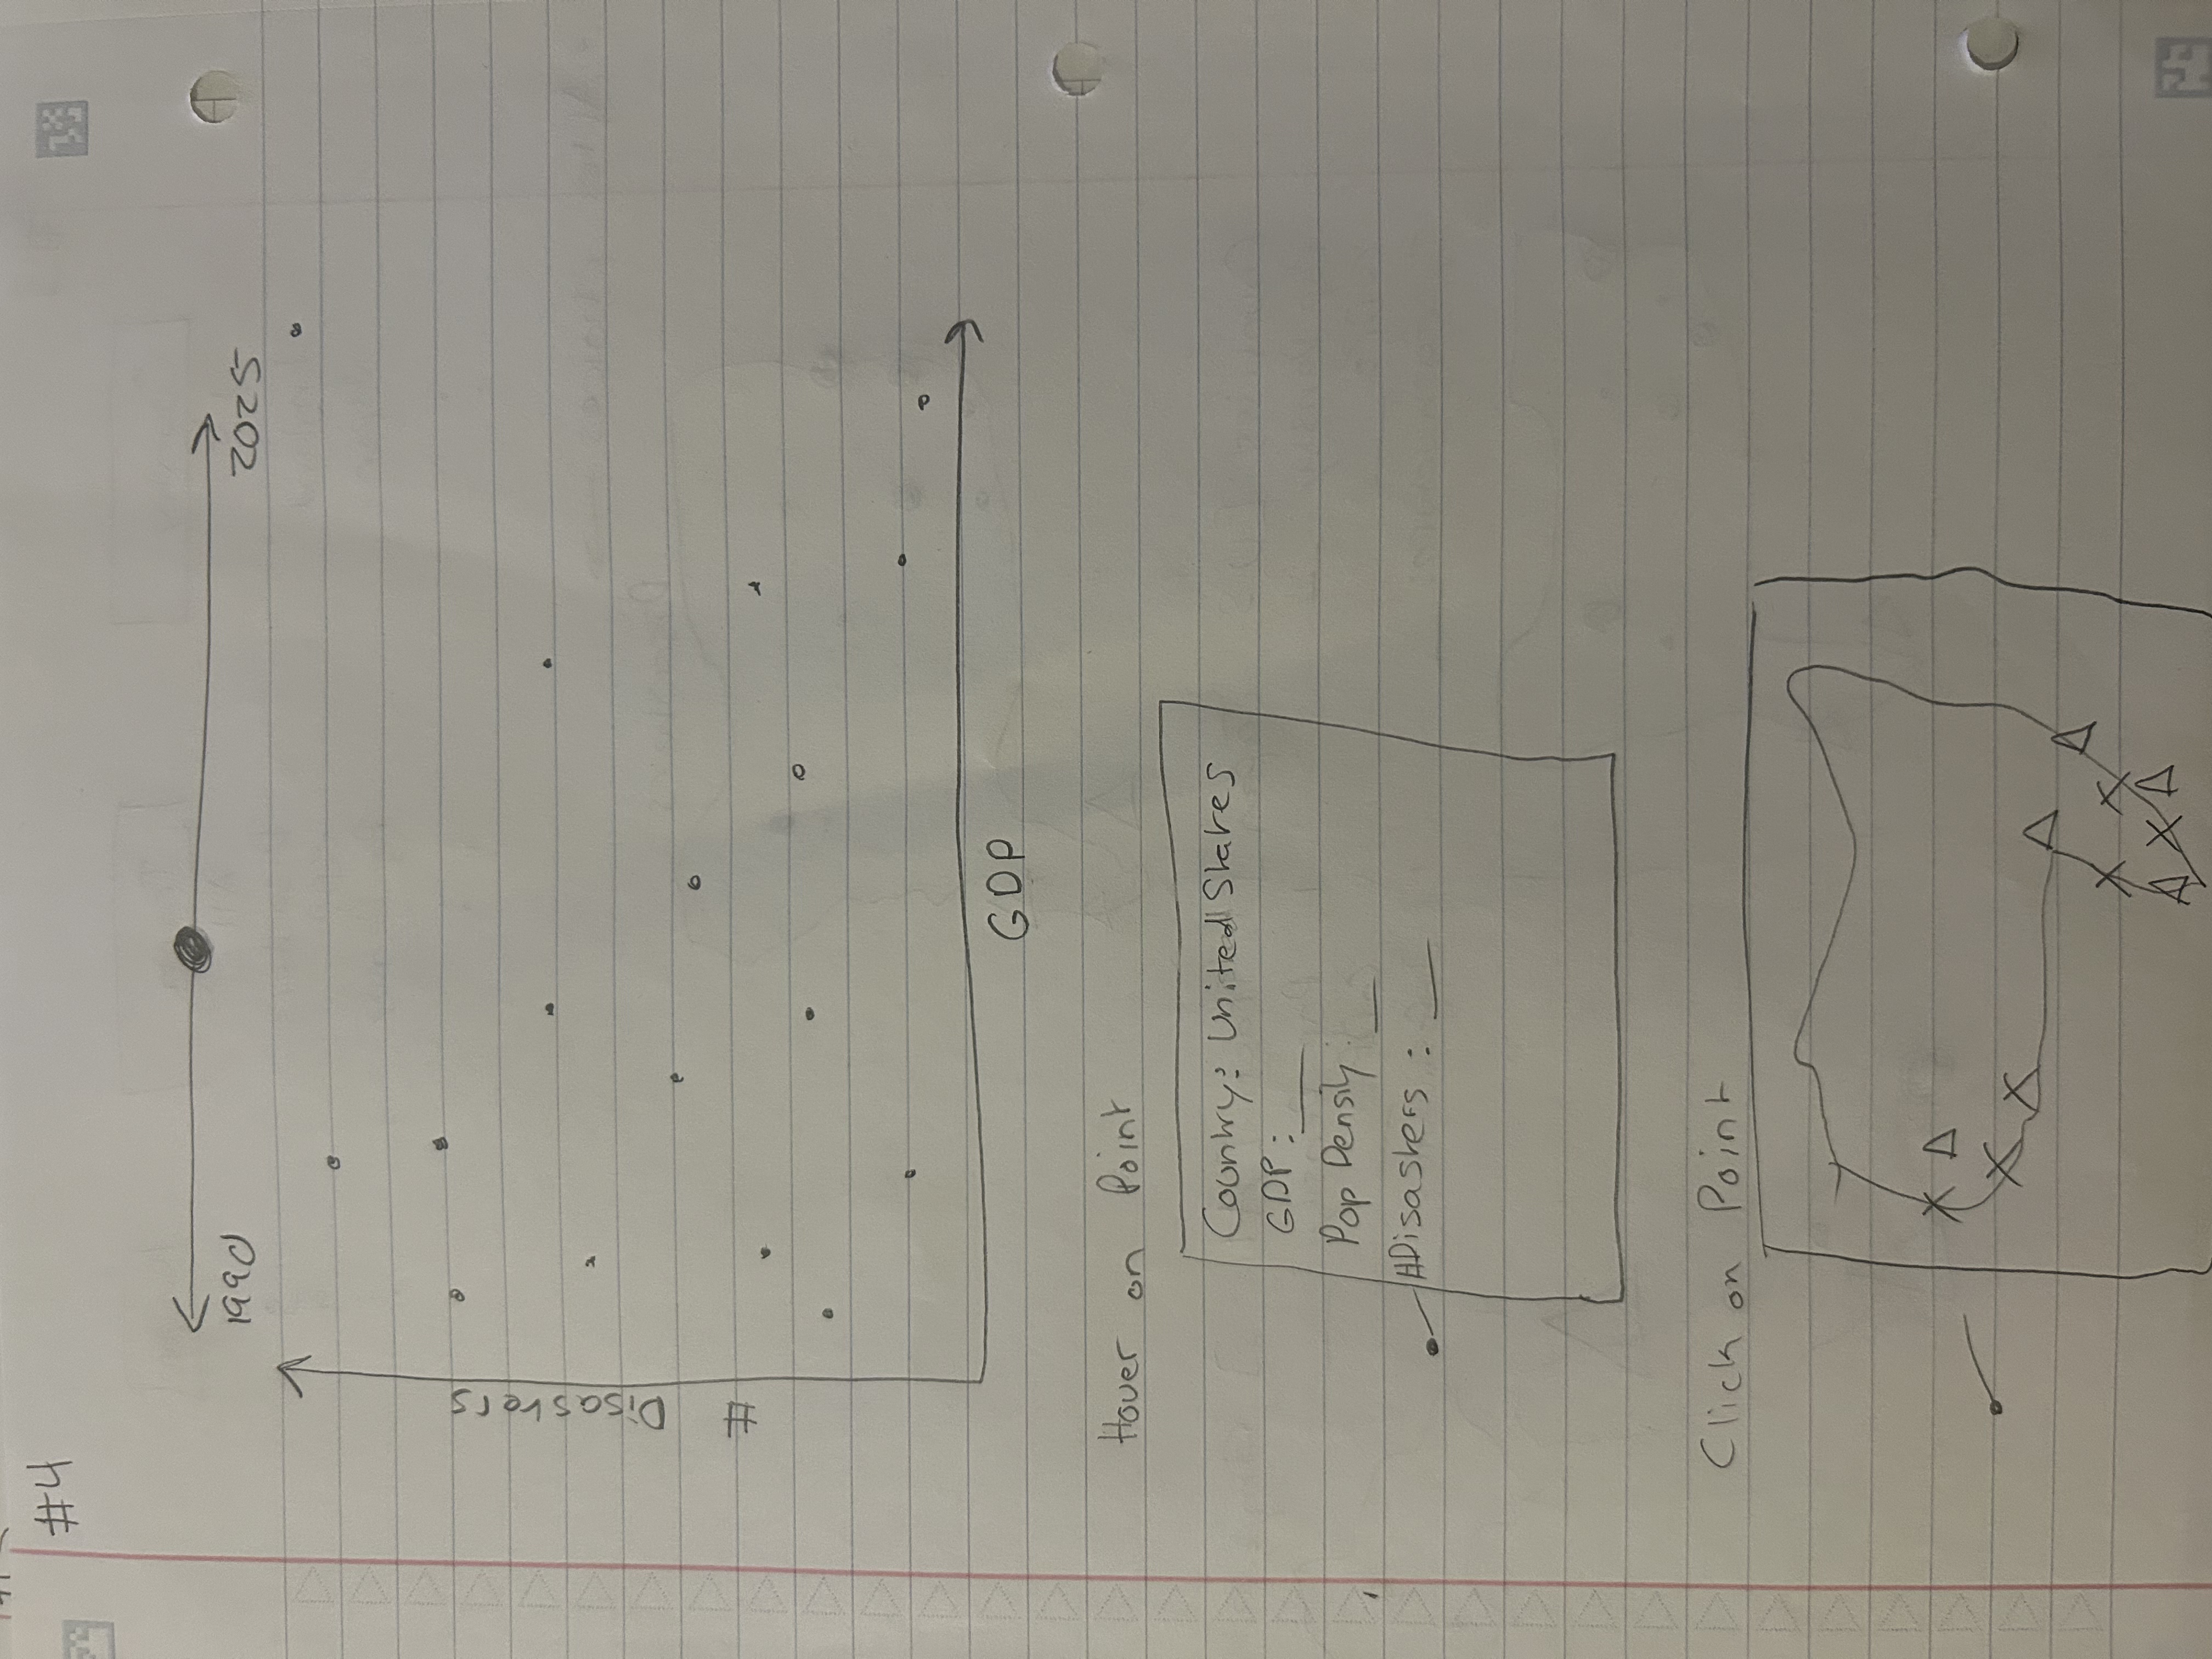
Figure 3
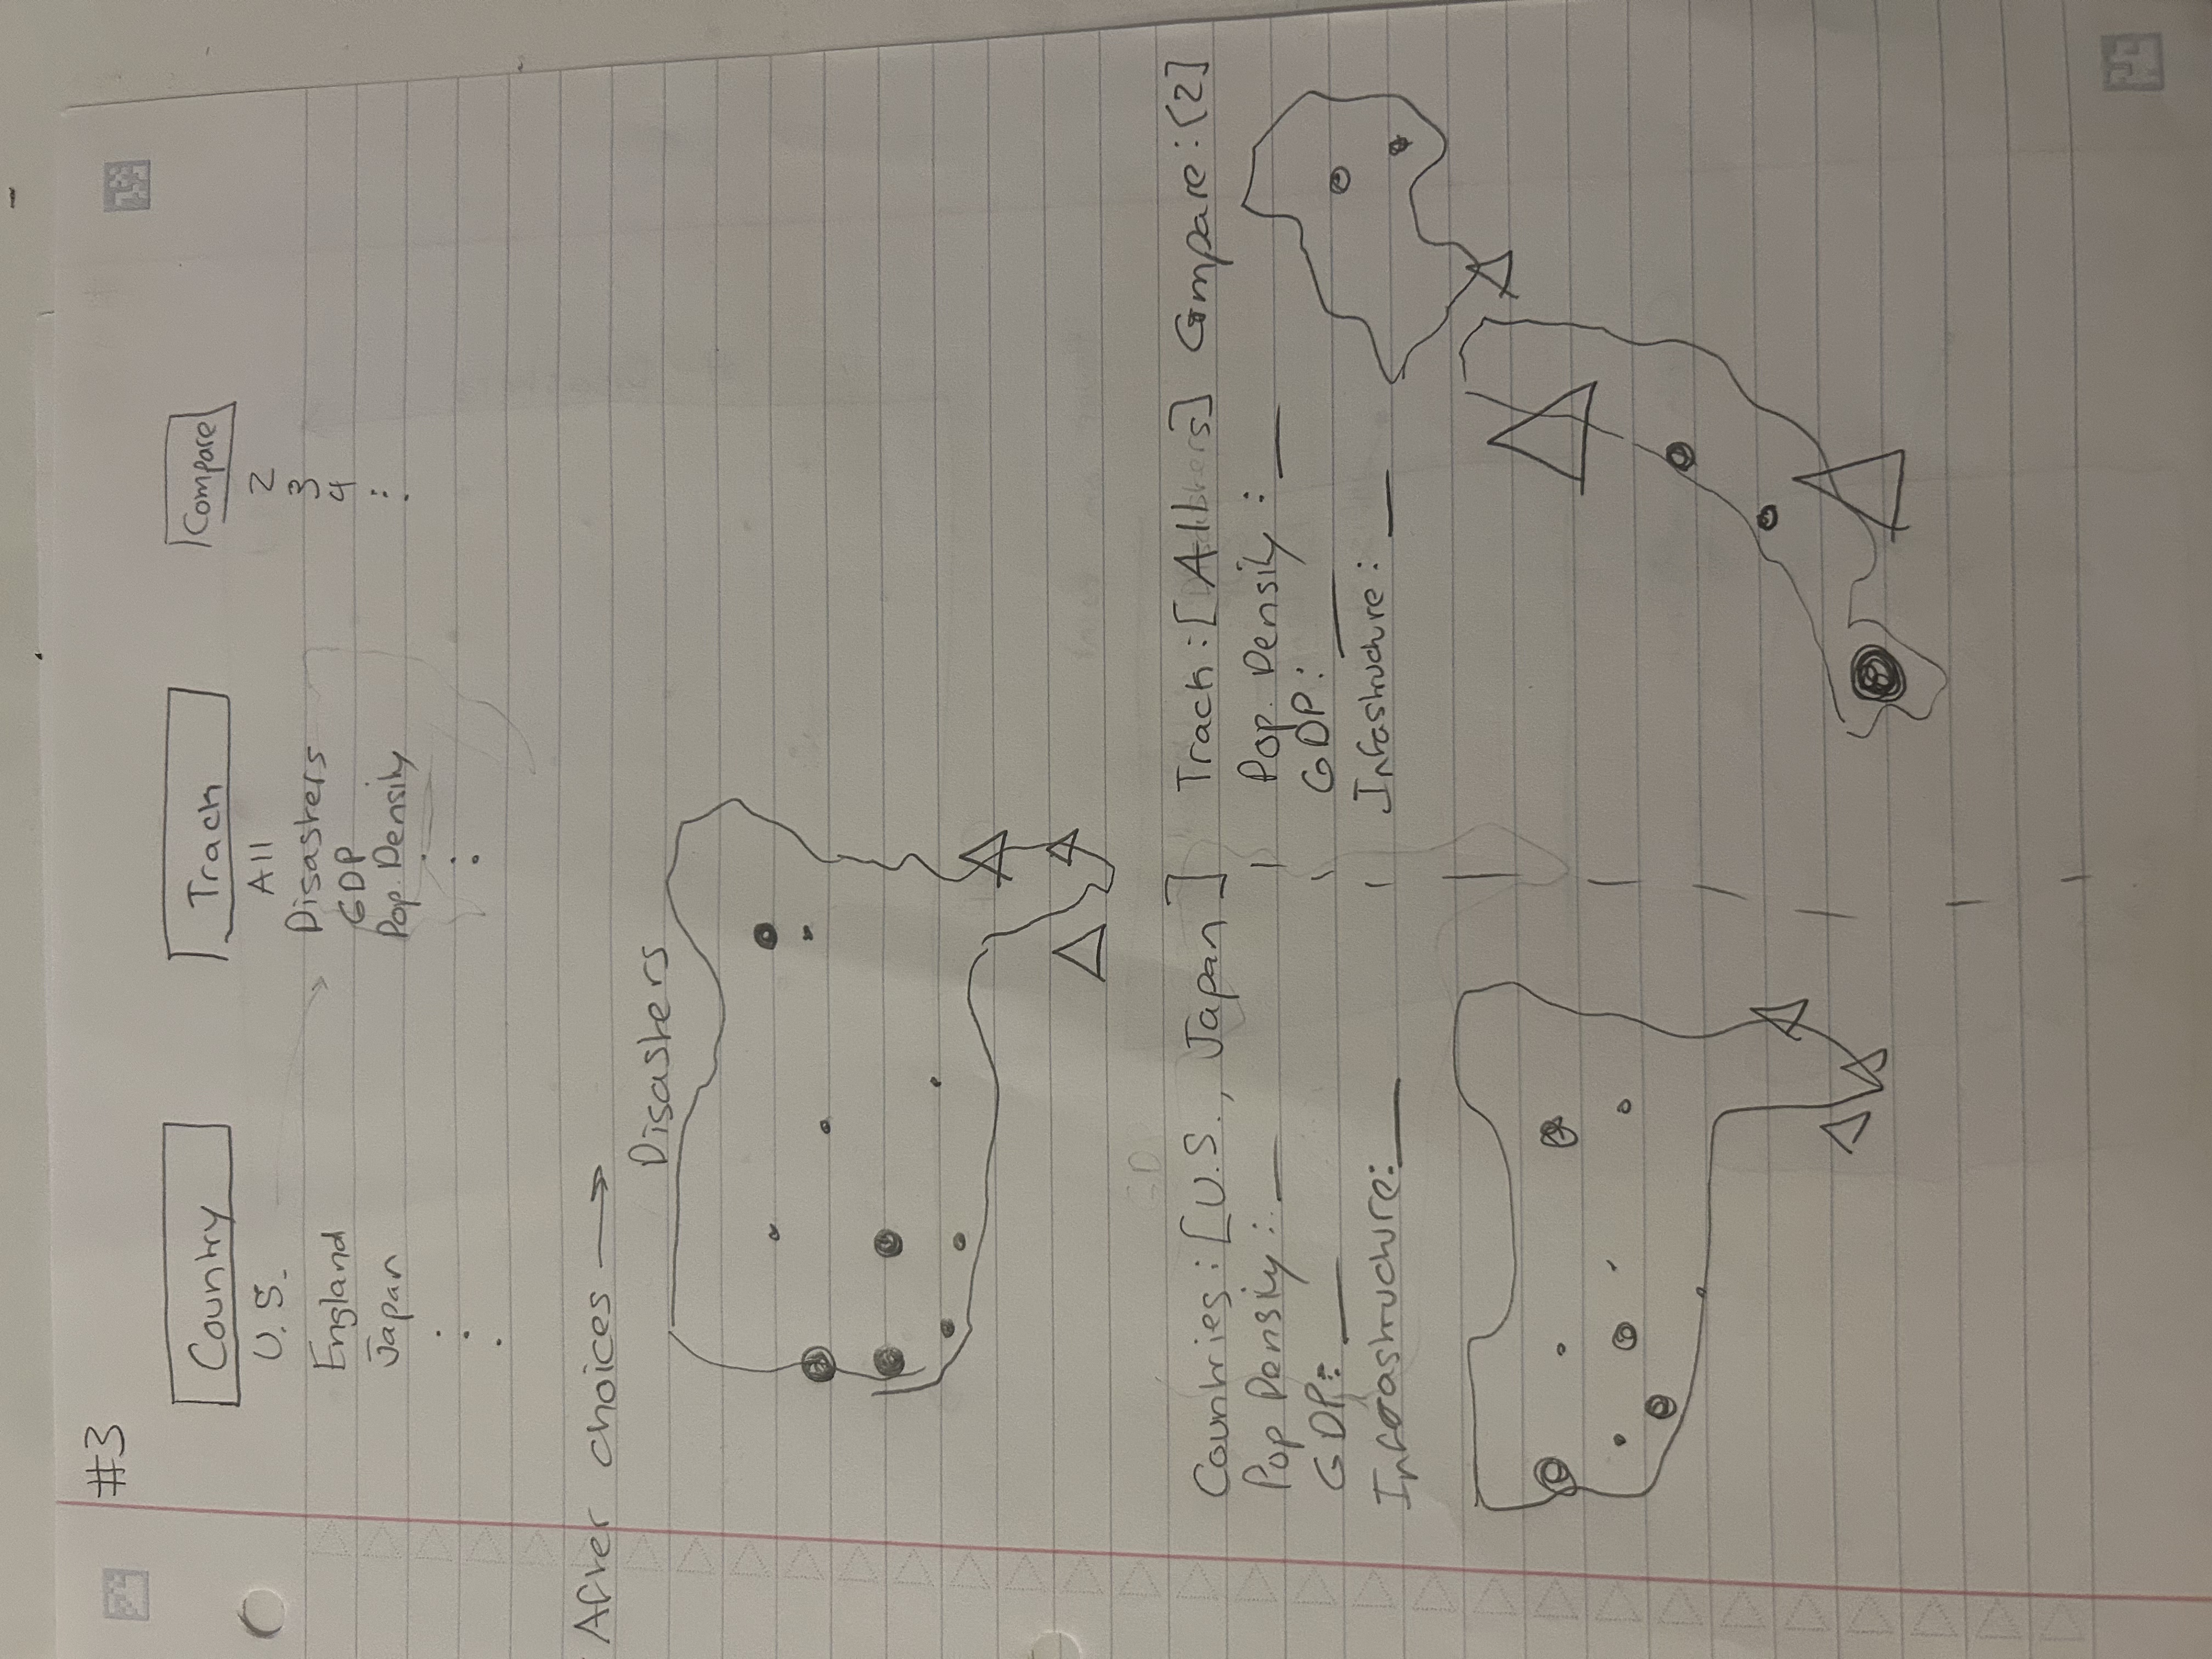
Figure 4
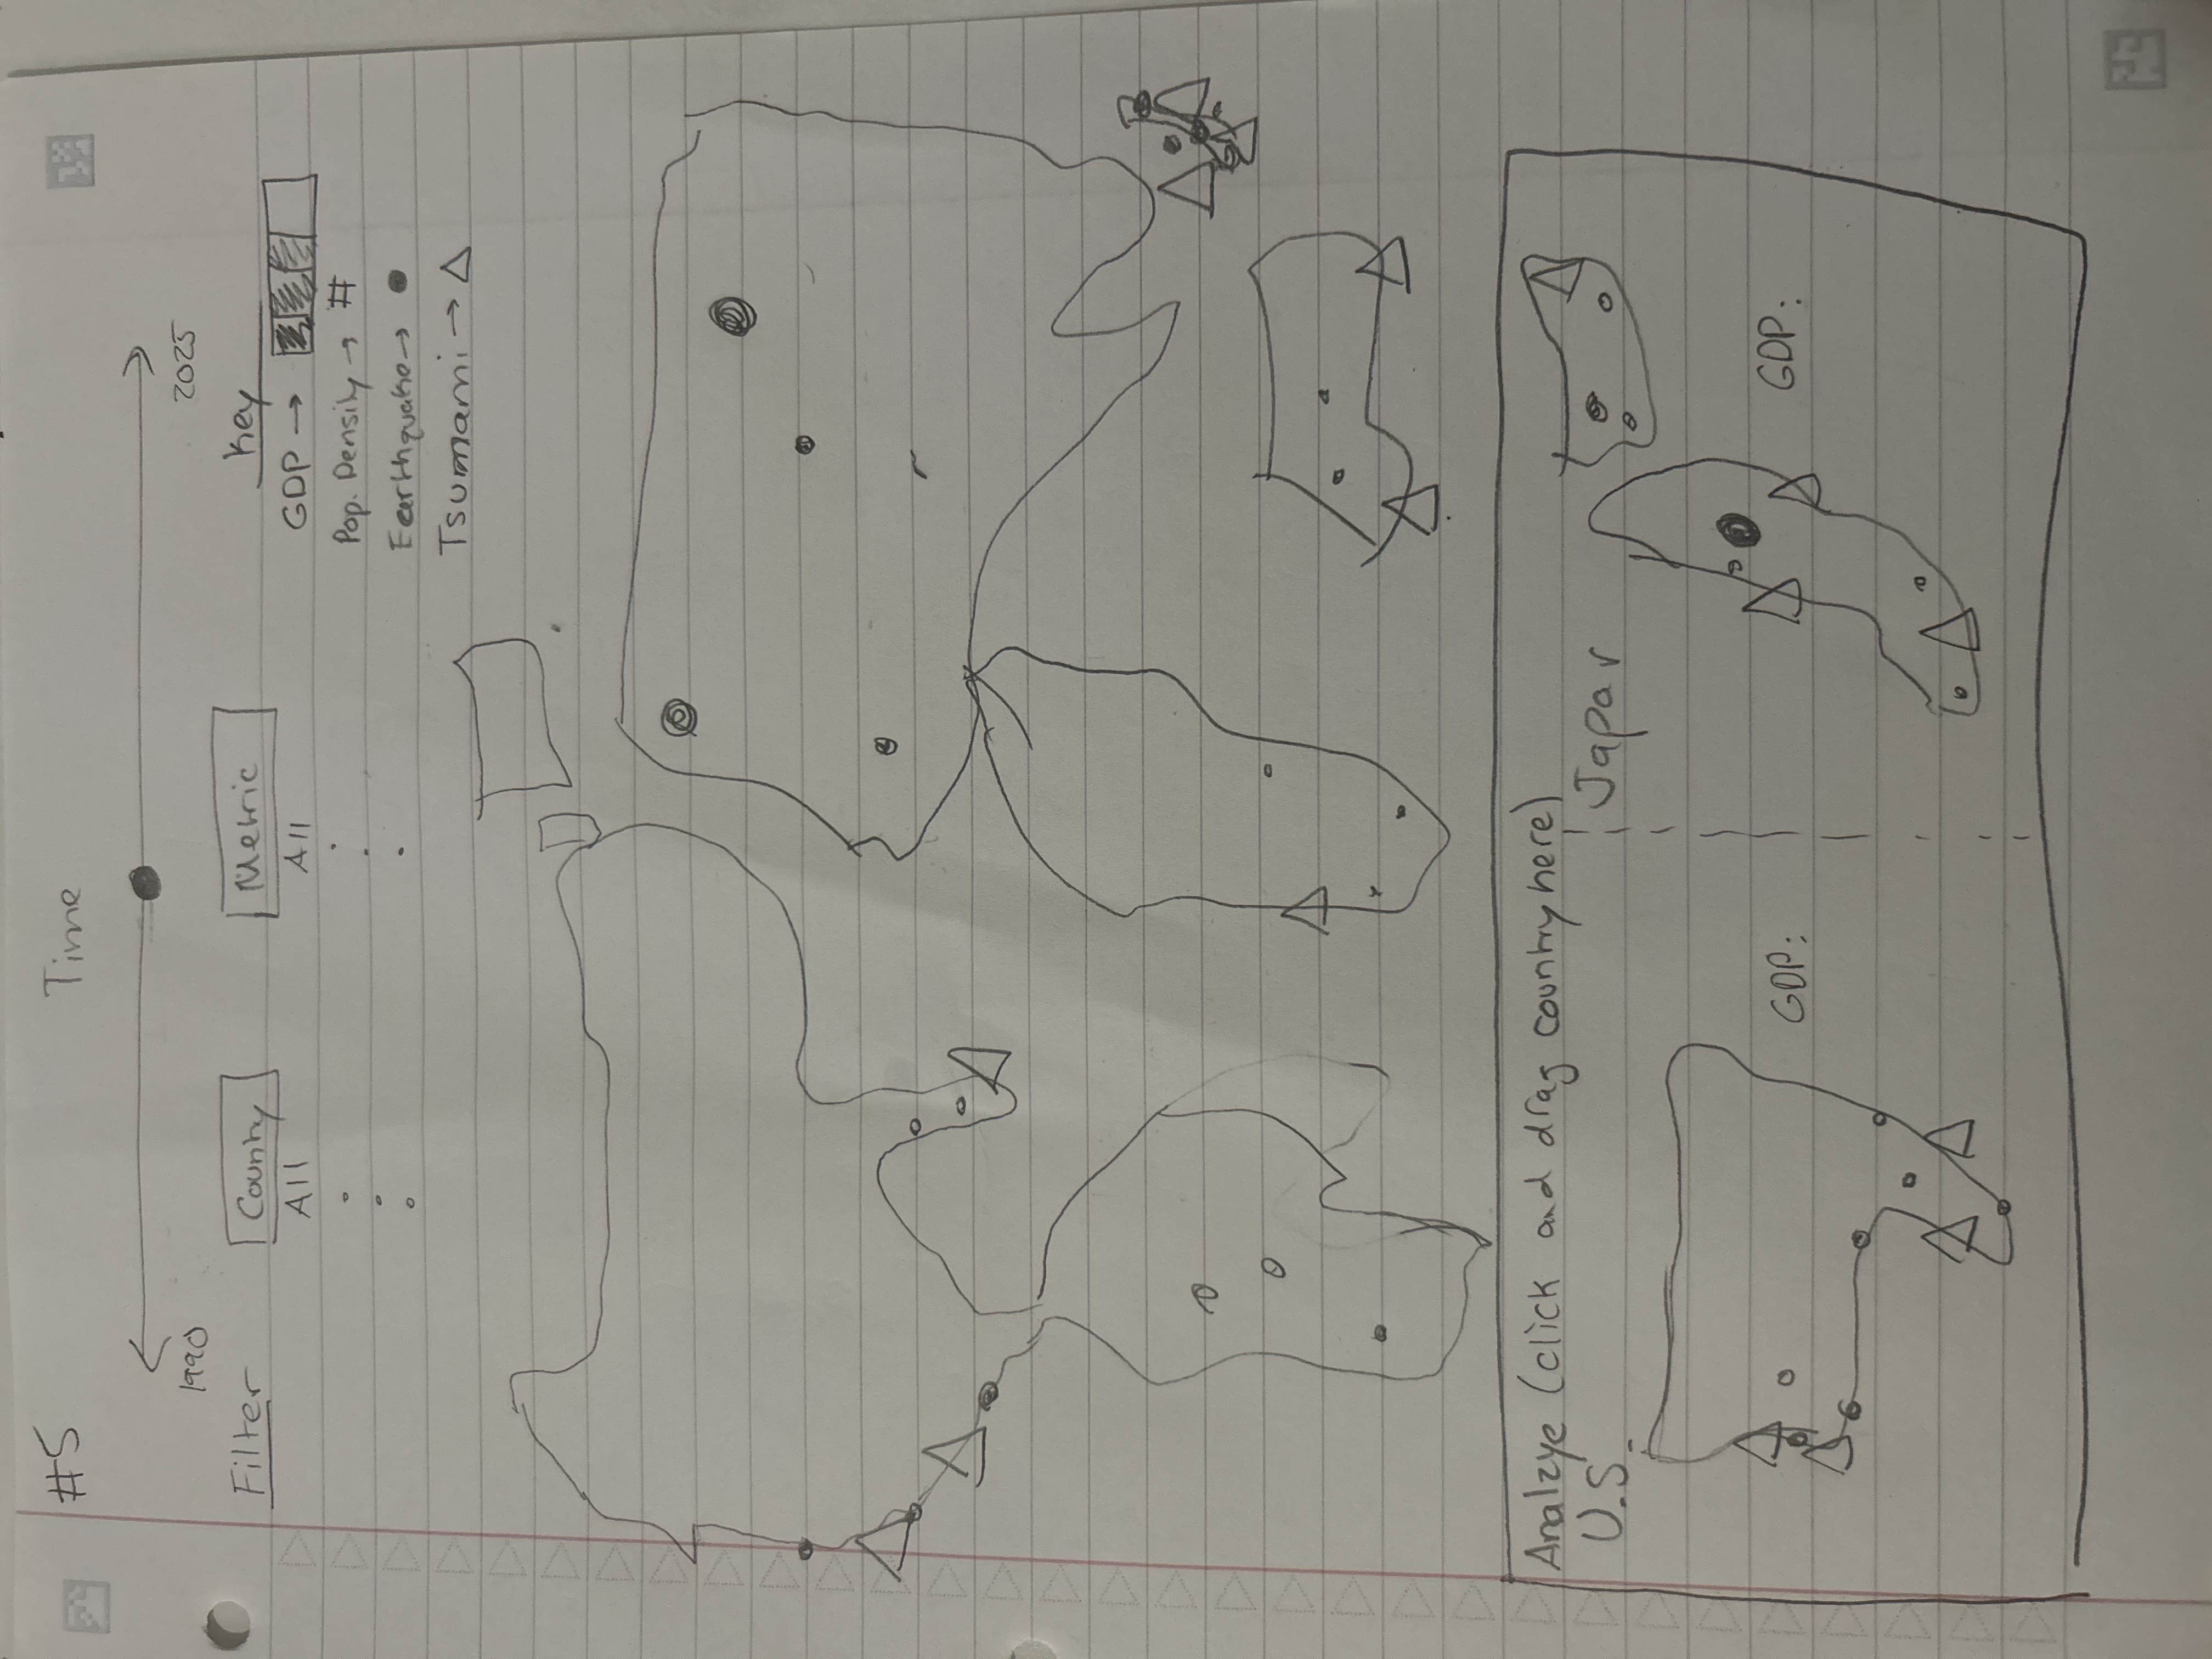
Figure 5
Milestone 1
By Milestone 1, we completed the initial data processing and developed a basic
interactive visualization framework, showing just Earthquake and Tsunami data on a map.
Milestone 2
As of Milestone 2, we have finalized all must-have features from Milestone 1
and made progress on additional features and optimizations.
Completed Features
-
Time Slider (Must-Have): Fully implemented with comprehensive functionality:
- Interactive slider at the bottom of the map for month-by-month navigation
- Current month-year display prominently shown (e.g., "Jan 2020")
- Manual dragging capability with smooth month transitions
- Automatic time range: 2001-2020 (240 months total)
- Data filtered to only show events from 2001 onwards for better data quality
-
Layer Filters (Must-Have): Complete layer control system:
- Toggleable layers for Earthquakes & Tsunamis, Airports, Ports, Power Plants, and Nuclear Plants
- Layers can be shown/hidden independently
- Year-based filtering for earthquakes and infrastructure (if year data available)
-
Time-Lapse Playback (Optional Feature): Implemented play/pause functionality:
- Play button automatically advances through months at 0.5 seconds per month
- Pause button stops playback
- Auto-play pauses when user manually interacts with slider
- Continuous looping from December 2020 back to January 2001
-
GDP Choropleth Visualization: Enhanced economic data visualization with ranking-based coloring:
- Ranking-based color assignment ensures highest GDP countries get darkest colors, lowest get lightest
- For each year, countries are ranked by GDP (rank 0 = lowest, rank 1 = highest)
- Continuous color interpolation with 16 color stops for high granularity
- High-contrast color scale (white → yellow → orange → red → purple → blue → navy) for obvious GDP differences
- Year-synchronized GDP display that updates with the time slider
- Interactive popups showing GDP total and GDP per capita for each country
- Legend included showing GDP color gradient from low to high
-
Enhanced User Controls: Additional interactive features:
- Map Lock Button: Prevents map panning/zooming when interacting with time slider
- Fullscreen Button: Allows users to expand the map to fullscreen mode
- Legend: Comprehensive legend in bottom-left showing GDP color scale and earthquake type indicators
- All controls prevent accidental map movement during interaction
-
Data Integration: Complete multi-dataset visualization:
- Earthquake events (magnitude > 2.0) with enhanced magnitude-based sizing - each magnitude unit adds 4px to radius for highly visible size differences
- Color coding: brown circles for earthquakes, blue circles for tsunamis
- Month-based filtering: earthquakes shown only for the selected month
- Infrastructure markers: airports (green), ports (cyan), power plants (amber), nuclear plants (red)
- Spatial correlation showing infrastructure within 100km of earthquake epicenters
- Temporal correlation linking disasters to GDP data for the same year (GDP data organized by year, earthquakes by month)
- Infrastructure without year data remains visible; infrastructure with year data filters by selected year
- Legend included showing earthquake type colors (brown for earthquakes, blue for tsunamis)
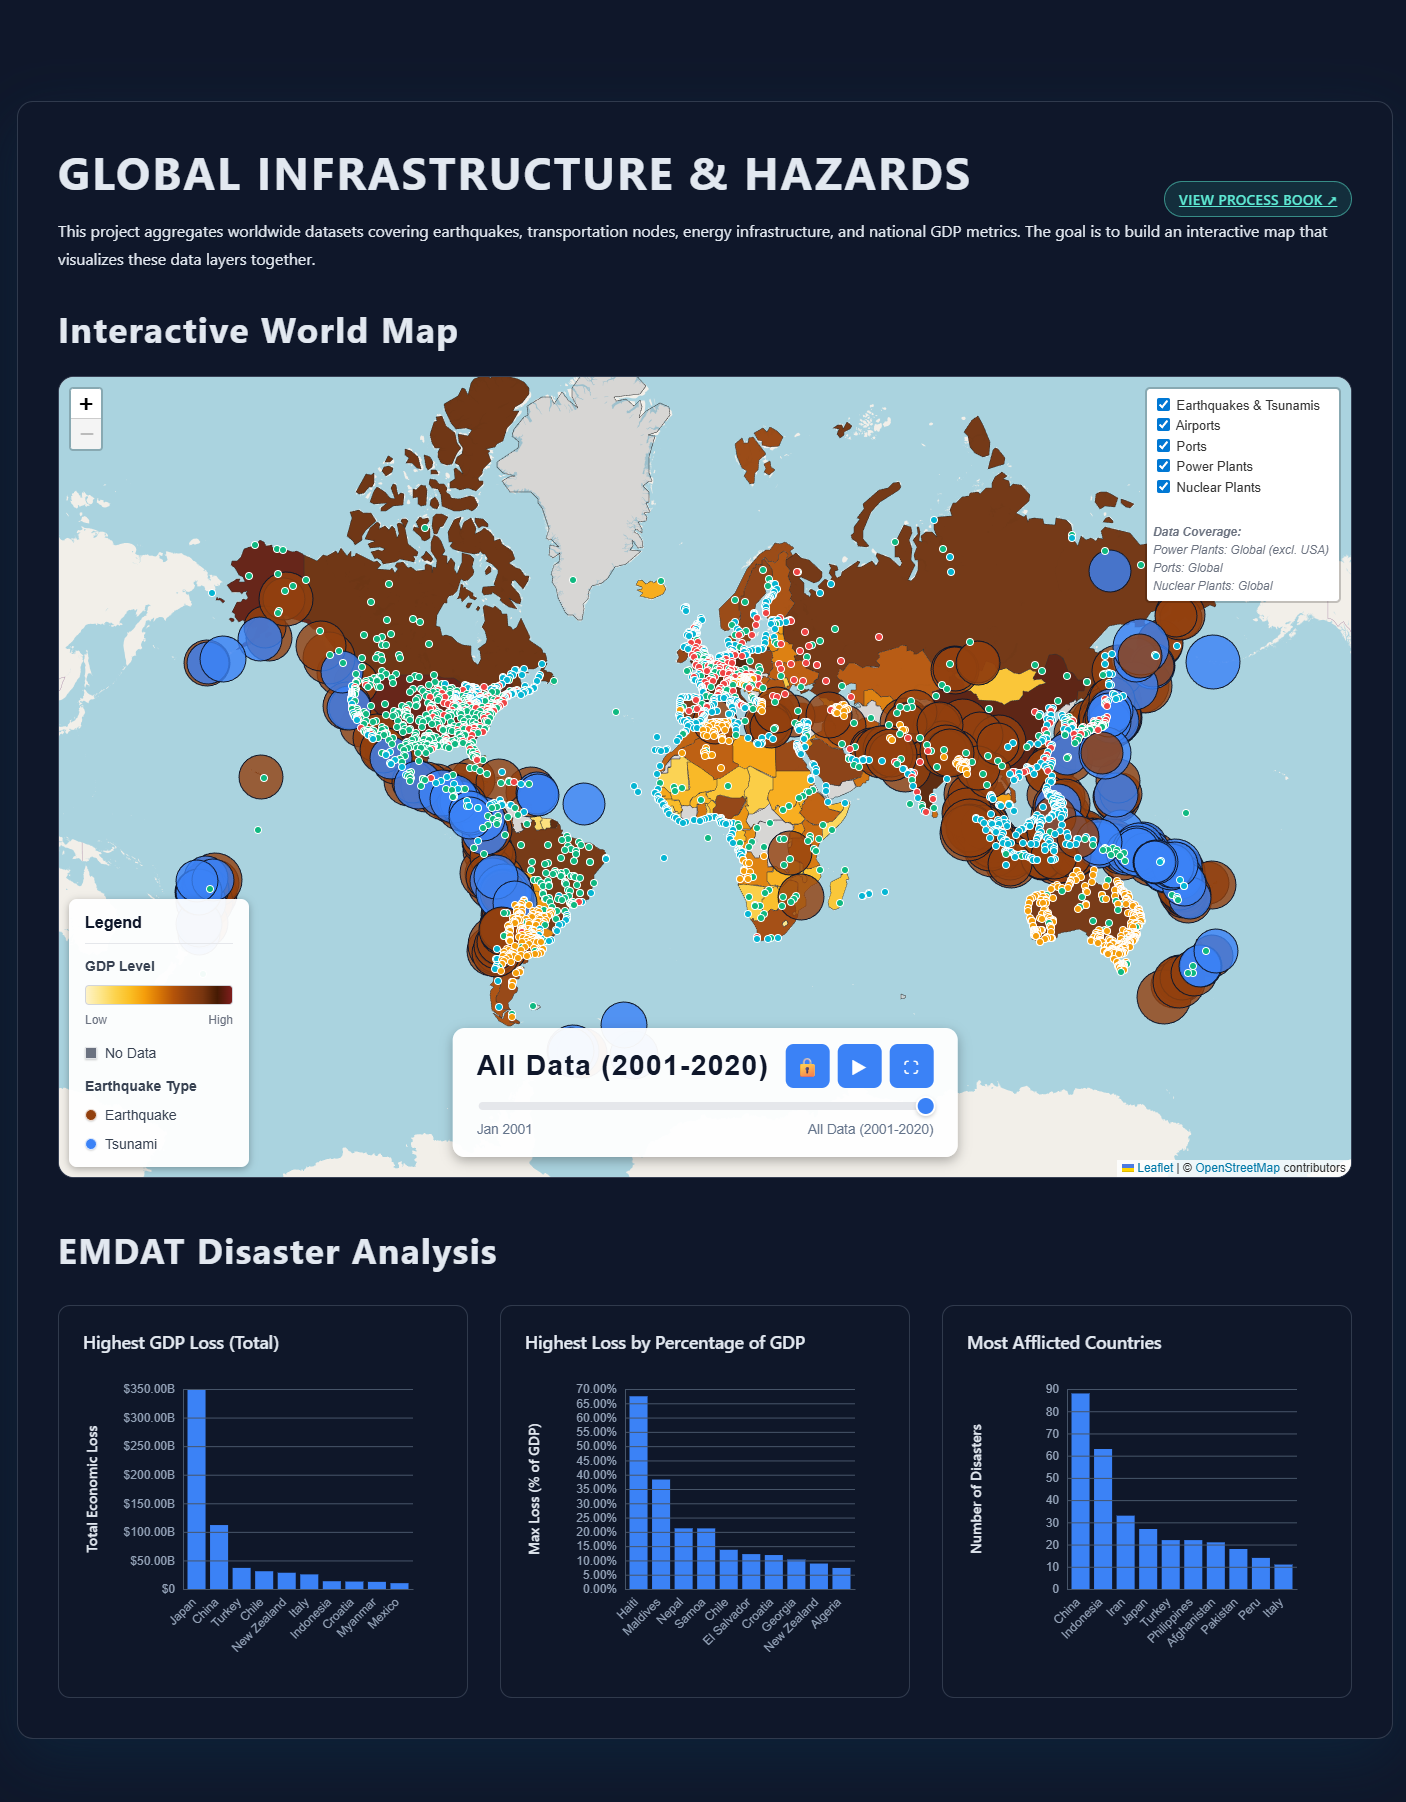
Final Product
The final visualization is a comprehensive interactive dashboard that successfully integrates
multiple datasets to explore the relationship between natural disasters, economic factors, and
infrastructure. The visualization provides users with powerful tools to analyze disaster impacts
across time and geography.
Key Features
-
Interactive World Map:
- Full-featured map visualization with earthquake/tsunami events, infrastructure markers, and GDP choropleth
- Earthquakes and tsunamis displayed as colored circles (brown for earthquakes, blue for tsunamis) with size proportional to magnitude
- Infrastructure markers: airports (green), ports (cyan), power plants (amber), nuclear plants (red)
- GDP choropleth map showing economic status of countries with ranking-based color coding
- Interactive popups for all map elements showing detailed information
-
Advanced Timeline Control:
- Month-by-month navigation from 2001 to 2020 (240 months)
- Play/pause functionality with adjustable speed (1 second per month)
- Special "All Data (2001-2020)" view at the end of timeline showing cumulative data
- Map lock feature to prevent accidental panning/zooming during timeline interaction
- Fullscreen mode for immersive viewing experience
-
Persistent Infrastructure Layers:
- Infrastructure layers (airports, ports, power plants, nuclear plants) remain visible when toggled on
- Infrastructure persists across timeline changes, providing consistent context
- Random global sampling of airports ensures worldwide representation (not just US airports)
- All infrastructure from 2001-2020 displayed when layers are enabled
-
EMDAT Disaster Analysis Charts:
- Three interactive bar charts below the map showing disaster impact metrics
- Highest GDP Loss (Total): Top 10 countries by total economic damage in USD
- Highest Loss by Percentage of GDP: Top 10 countries by maximum percentage loss relative to GDP
- Most Afflicted Countries: Top 10 countries by number of disasters
- Hover tooltips showing full country names and detailed values
- Comprehensive country name mapping for all ISO country codes
-
Enhanced User Experience:
- Smooth animations and transitions for all map elements
- Comprehensive legend showing GDP color scale and earthquake/tsunami indicators
- Data coverage notes for transparency about dataset limitations
- Responsive design that works across different screen sizes
- Optimized performance with efficient data loading and rendering
Technical Implementation
-
Data Integration: Successfully merged earthquake/tsunami data, GDP metrics, and
infrastructure datasets (airports, ports, power plants, nuclear plants) with spatial and temporal
correlations
-
Visualization Libraries: Built using D3.js for data manipulation and charting,
Leaflet for map rendering, and TopoJSON for geographic boundaries
-
Performance Optimization: Efficient data structures, lazy loading, and optimized
rendering ensure smooth interactions even with large datasets
-
Code Organization: Modular JavaScript architecture with clear separation of
concerns for maintainability and extensibility
Insights Enabled
The final visualization enables users to explore critical questions about disaster vulnerability:
- Identify countries most affected by natural disasters in terms of economic loss
- Understand the relationship between GDP and disaster recovery capacity
- Analyze spatial patterns of disasters and their proximity to critical infrastructure
- Track disaster frequency and intensity over time (2001-2020)
- Compare disaster impacts across different economic contexts
- Visualize infrastructure vulnerability to natural disasters
Final Product - Main Dashboard
Evaluation
Throughout the visualizations of our initial data, it became clear it wouldn't be sufficient to answer our questions. GDP data is too large for the sometimes low impact natural disasters have, so using EMDAT data was necessary
in order to show their disproportionate impact. Splitting up the overall data in the interactable map still shows all the aspects we want to show, and the EMDAT data allows us to better show the impact of natural disasters
on a country's economy. Better infrastrucutre data (exact dates of creation and destruction) would better show the impact of natural disasters, but this data was not able to be found and integrated. Future improvements would
include adding more specific data within each country (both infrastructure and wealth) to show more exact and specific impact.
Project Schedule
10/26-11/1 (Proposal Due 10/27)
- Finalize and submit proposal
- Verify accessibility and completeness of all datasets
- Assign team roles
11/2-11/8
- Raw data cleaning
- Standardize data formats
11/9-15 (Milestone 1 Due 11/10)
- Submit milestone 1 + data processing log
- Develop feature engineering
- Start basic visualization
11/16-11/22
- Build base visualization framework, load geospatial data and basic map rendering
- Prototype of core interactions, build time slider and dropdown filters
- Preliminary data analysis, identify key trends
11/23-11/29 (Milestone 2 Due 11/24)
- Submit milestone 2
- Optimize interactions, add time-lapse feature and refine visual effects
- Test and debug
11/30-12/8 (Final Project Presentations Due 11/30, 12/8 Final Due Date)
- Prepare presentation slides
- Rehearse presentations and refine storytelling
- Make final adjustments and submit all files