AI Infrastructure and Community Impact in the United States
Data Visualization Process Book
Back →Basic Info
Project Title: AI Infrastructure and Community Impact in the United States
| Team Member | Student ID | |
|---|---|---|
| Alicia Zhang | a.c.zhang@email.wustl.edu | 526399 |
| Vincent Li | liv@email.wustl.edu | 525831 |
| Echo Dong | d.echo@wustl.edu | 525487 |
Overview and Motivation
As AI usage surges globally, increasingly more infrastructure is being built to meet demands. A few months ago, a lawsuit arose regarding a newly constructed data center in the middle of a Lowell, Massachusetts neighborhood. Neighbors complained about the constant noise, the pollution from exhaust and the looming shadow of the structure over the neighborhood (CBS News). Predominantly working class, the neighborhood’s median income was far below the national average at $51,839 (Neighborhood income source). It becomes abundantly clear that the very people whose lives are upended by AI are hardly the corporations who reap the benefits of the data center. The Lowell data center situation begs the question: Are other underserved communities also impacted by data centers?
Related Work
A visualization and project that inspired us was the Brockovitch Data Center. This is a website by environmental activist Erin Brockovitch that visualizes data centers around the country, as well as what reports were made. There is also an option on the website to submit a report and add to the data. Through our project, we hope to expand upon this work and the data it's collected, and understand the people and communities who are impacted by these data centers.
Project Objectives
Through this visualization project we seek to understand the impact of AI on communities and people throughout the United States.
- Who uses AI and who is impacted by AI infrastructure?
- Are those who use AI those impacted the most by data centers?
Ultimately, we hope to not only help ourselves understand, but to help others in our class see the scale and consequence of AI infrastructure. How are we, as individual users, complicit to the harms inflicted on communities around the country?
Data
Brokovich AI Data Center Reporting
Brokovich AI Data Center Reporting is a platform for reporting concerns about the construction of data centers, currently holding a running catalogue of 9k+ reports with zip codes and primary concerns. It also maps major AI data centers across the U.S. and further categorizes them into operational, under construction, permitted, proposed and cancelled. Since the website does not include a download link, we will be scraping the entries and metadata with an AI-generated script.
Source: Brokovich community statistics
Microsoft AI Diffusion Report
The Microsoft AI Diffusion Report provides U.S. AI user share at the state, county, and metropolitan-area levels over 2025 (two halves) and 2026 (first two quarters). AI usage was measured by aggregated monthly Microsoft telemetry covering usage of major AI services (ChatGPT, Google Gemini, Anthropic Claude, Microsoft Copilot, etc.). The raw data for 2026 Q1 is available at their GitHub repo.
Global Data Center Map
Global Data Center Map is an open-source data center location dataset, including 18k+ data centers over 116 countries. We will be using the listed 8,818 U.S. data centers in our visualization. Raw labeled data is downloadable on their GitHub repo.
Source: Global Data Center Map GitHub repository
U.S. Population, Poverty, and Income
We will use 2026 U.S. population data at the county, metropolitan-area, and state levels.
- Poverty levels by county: USDA Economic Research Service county-level data
- Personal income by county: Bureau of Economic Analysis county personal income
HUD-USPS ZIP Code Crosswalk
The HUD-USPS ZIP Code Crosswalk maps U.S. ZIP codes to counties, which will be useful in deriving county-level entries/quantities from the ZIP code-based Brokovich data.
Data Processing
What we cleaned: We cleaned every source listed above and lined them all up by county so they could be compared. Getting the Brokovich data was easier than expected, as the site loads all reports and data centers from a few plain files, so we downloaded those directly instead of scraping the page. We dropped the few reports without a usable ZIP code and the one data center without a county, which left us with 9,728 reports and 544 data centers. We ended up not using the Global Data Center Map, since most of its U.S. entries have no location and are not necessarily AI data centers, and the Brokovich AI data centers already cover what we need.
What we derived:
- For each data center, the number of community reports closest to it. Most data centers have somewhere between 1 and 50 nearby reports, but one in Sulphur Springs, Texas has over 400.
- The county each data center and each ZIP code falls in, so reports and data centers can be counted by county and state.
- One table for counties and one for states, each with population, AI usage, median household income, poverty rate, unemployment rate, and per capita income.
- We grouped the 9,728 community reports into 100 clusters by location using k-means, so each circle on the map sits at the average location of the reports in its cluster.
Quantities like reports per 100,000 residents or AI data centers per AI user will be calculated in the visualization itself from these tables.
How we did it: All of this was done with AI-generated scripts.
Design
Design 1: AI Usage and Data Center Distribution
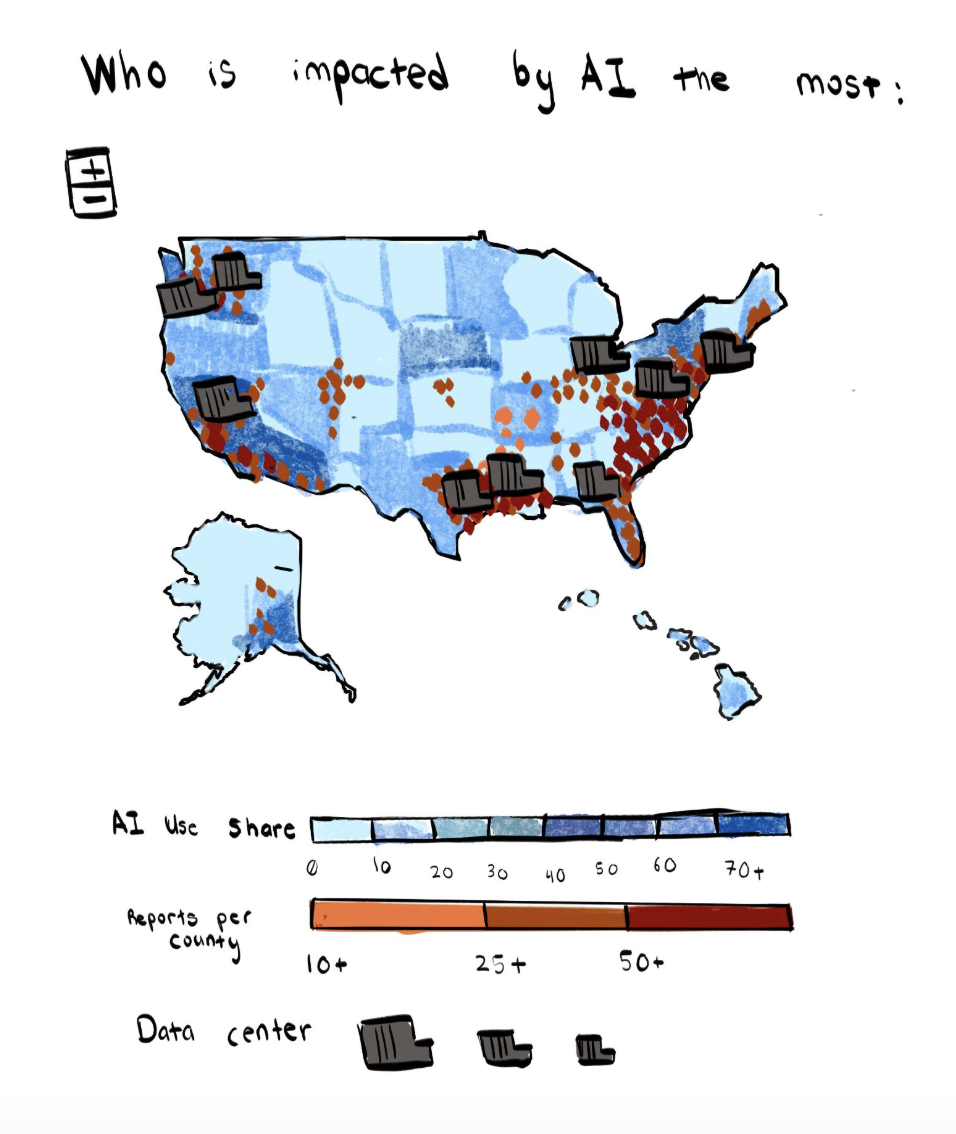
This design centers around a map of the US, which uses a choropleth map to represent the AI usage share per county of each of the different states. The number of AI reports per county are represented using dots, with the darker colors representing more AI reports per a specific county. Finally, the data centers are represented by an icon, proportionate to the number of data centers in a given state.
Design 2: Interactive State-Level Exploration
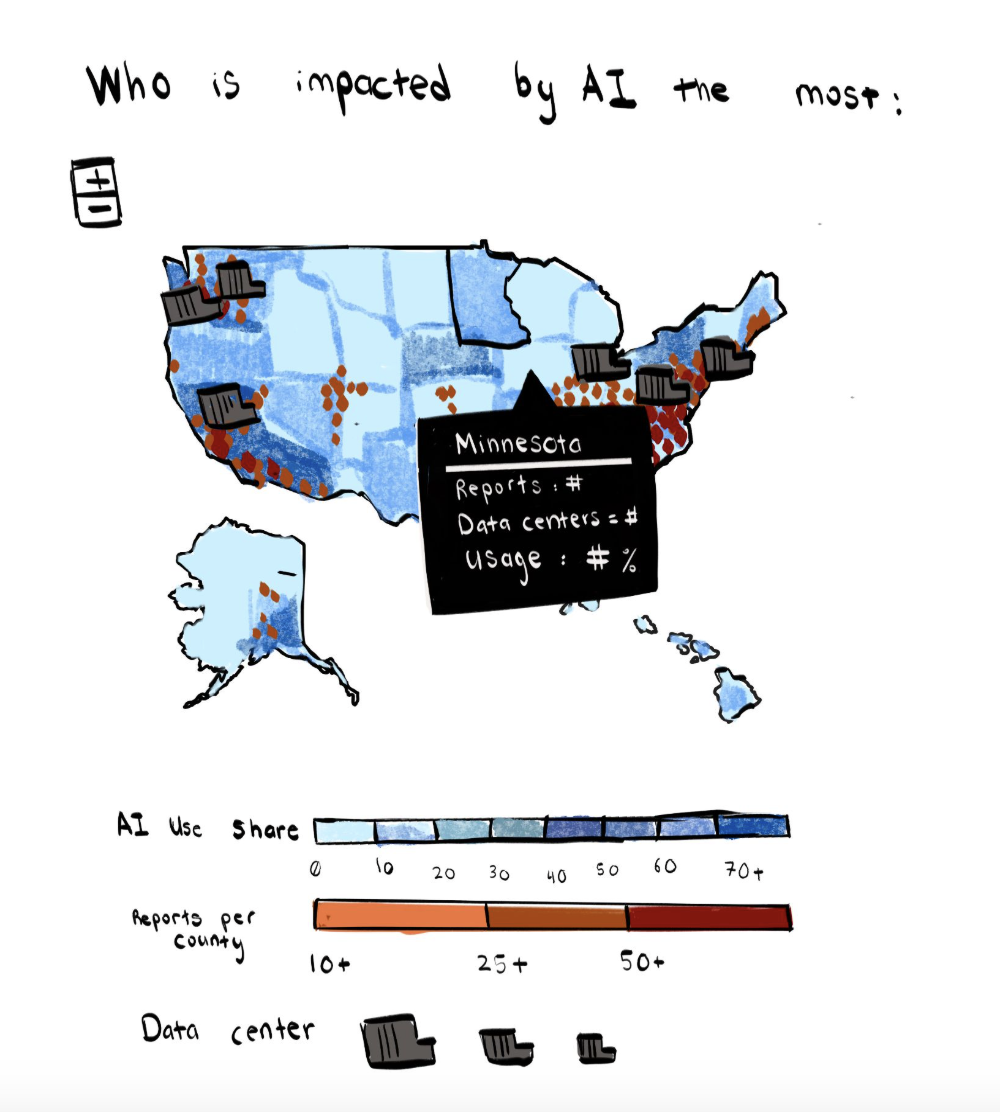
This illustration shows the interactive behavior that occurs when clicking on a specific state on the map. You are able to see the number of reports, data centers and usage percentage for that specific state.
Design 3: Data Centers and Community Reports Dashboard
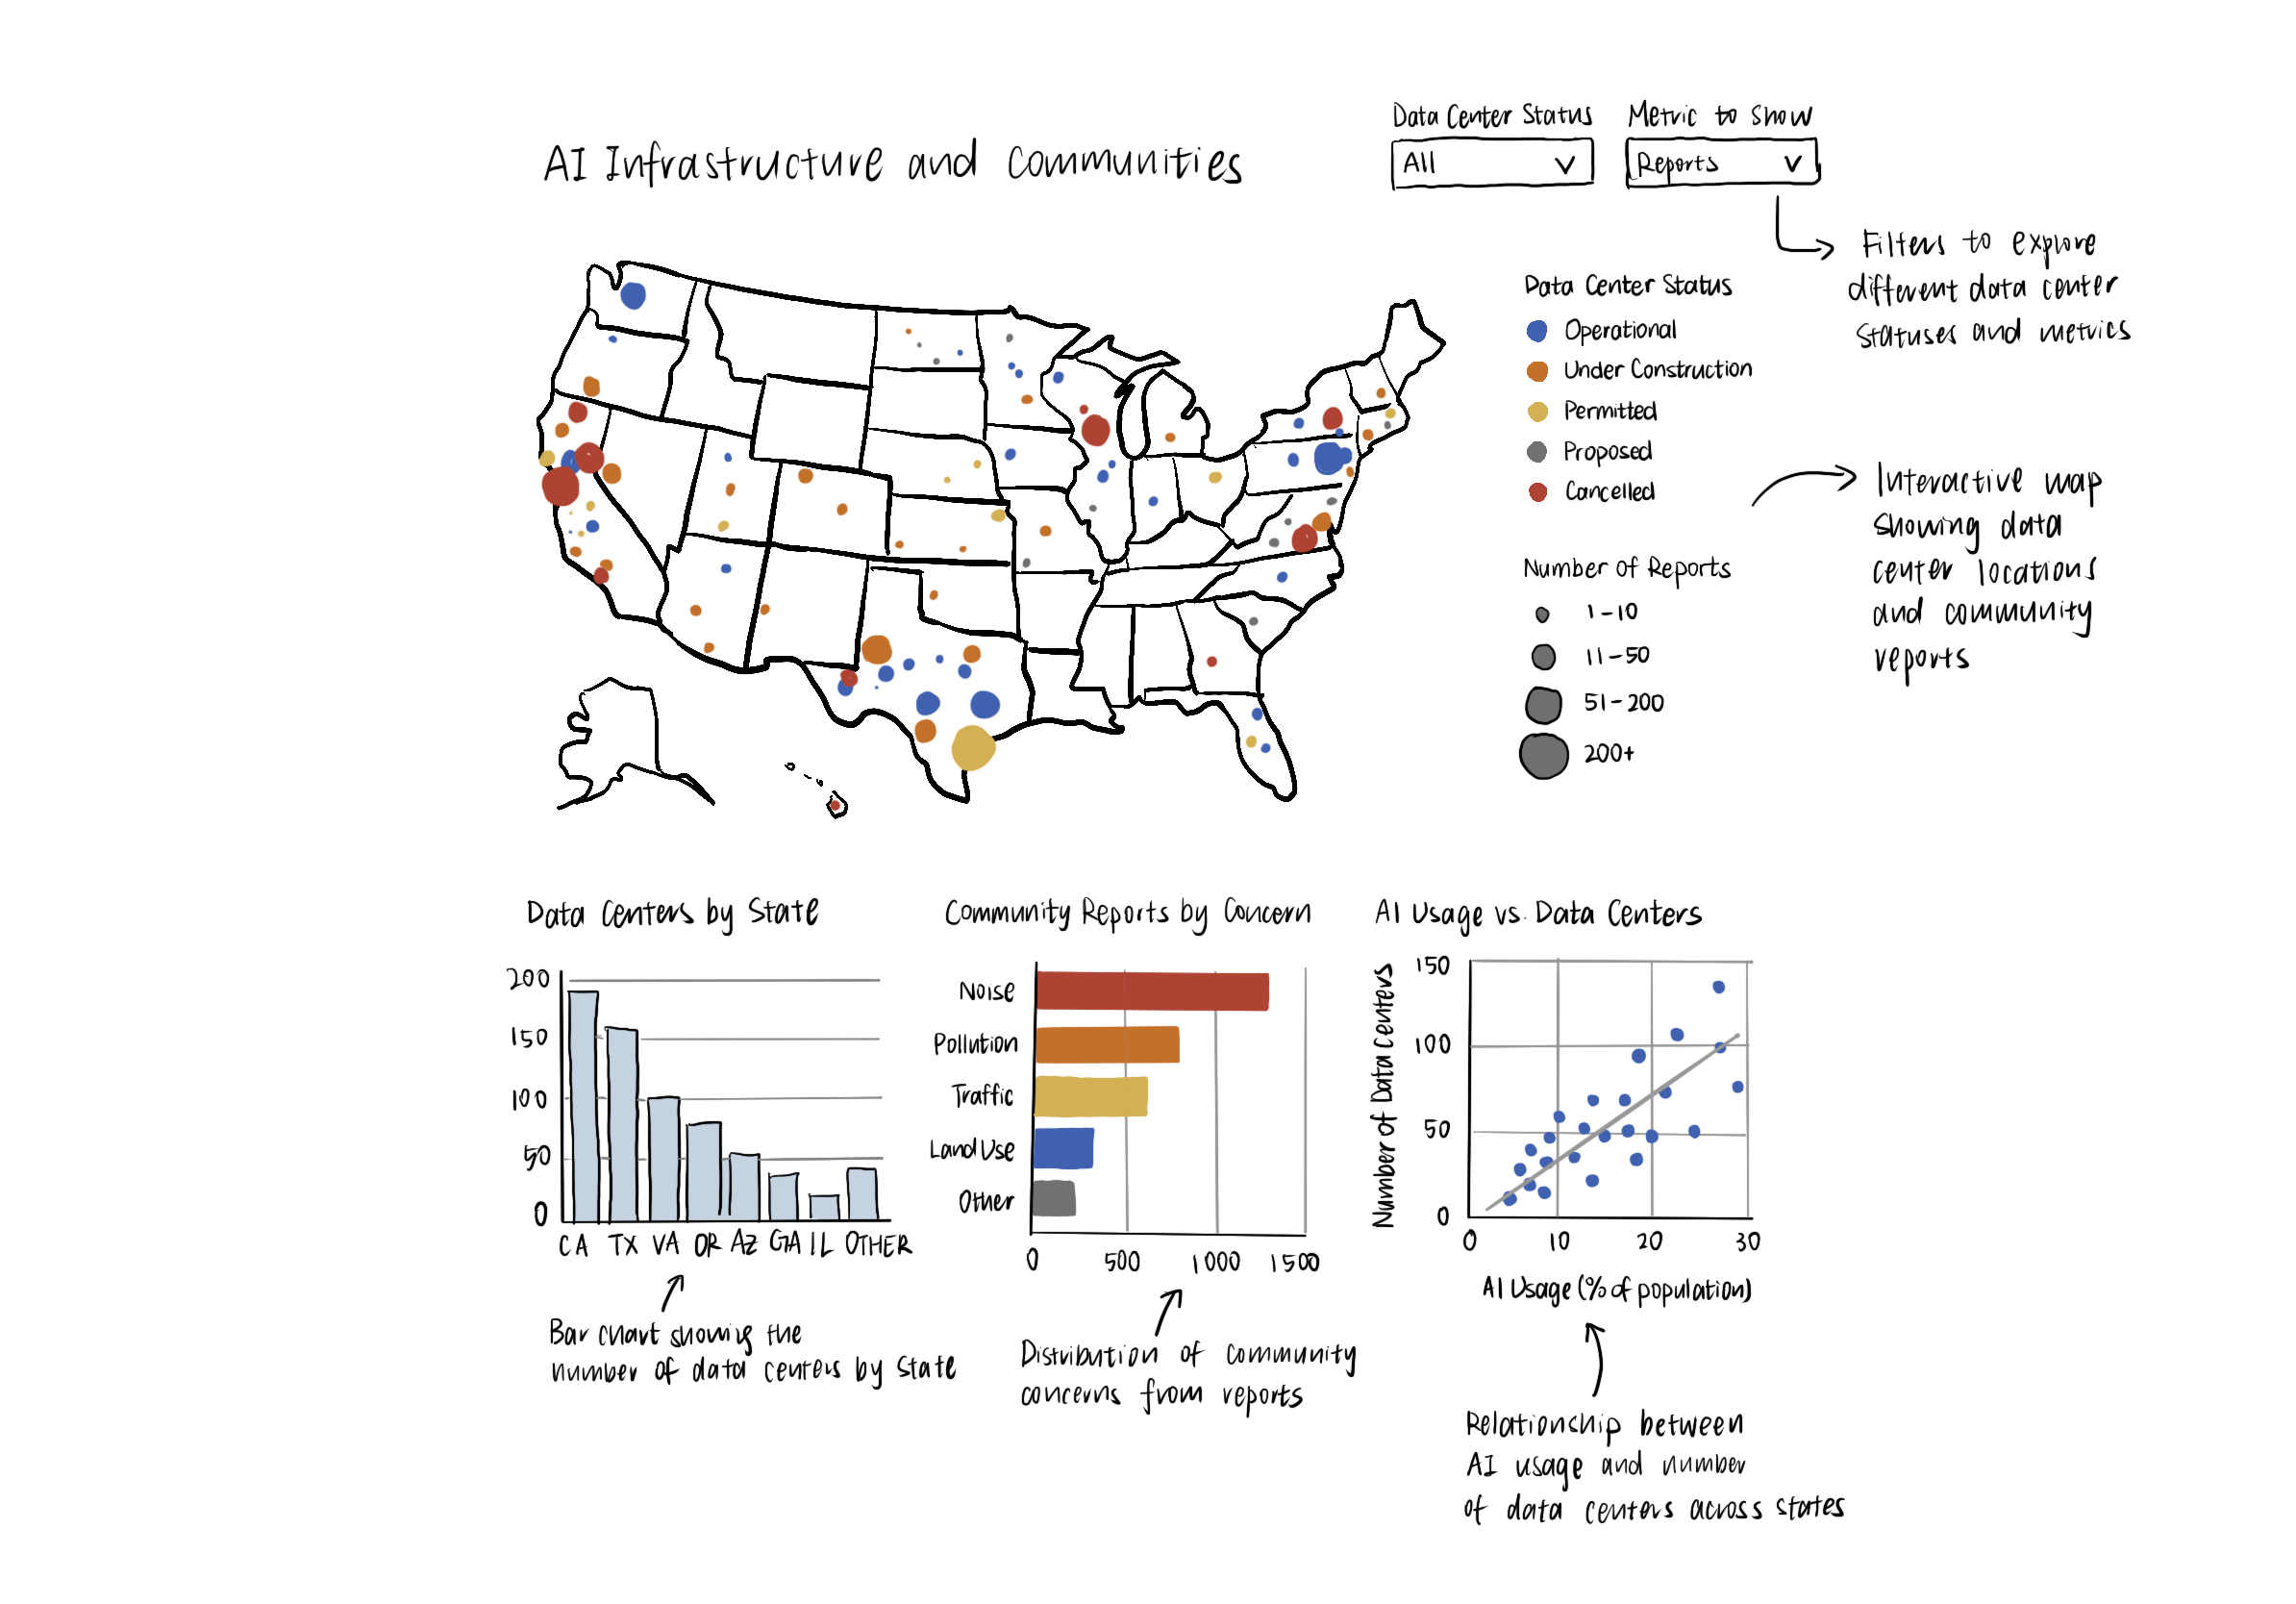
This design uses an interactive U.S. map to display data center locations and community reports. Colors distinguish data center statuses, while circle sizes represent the number of reports. Supporting bar charts compare data centers by state and types of community concerns, while a scatterplot explores the relationship between AI usage and data centers.
Design 4: Side-by-Side Choropleth Maps
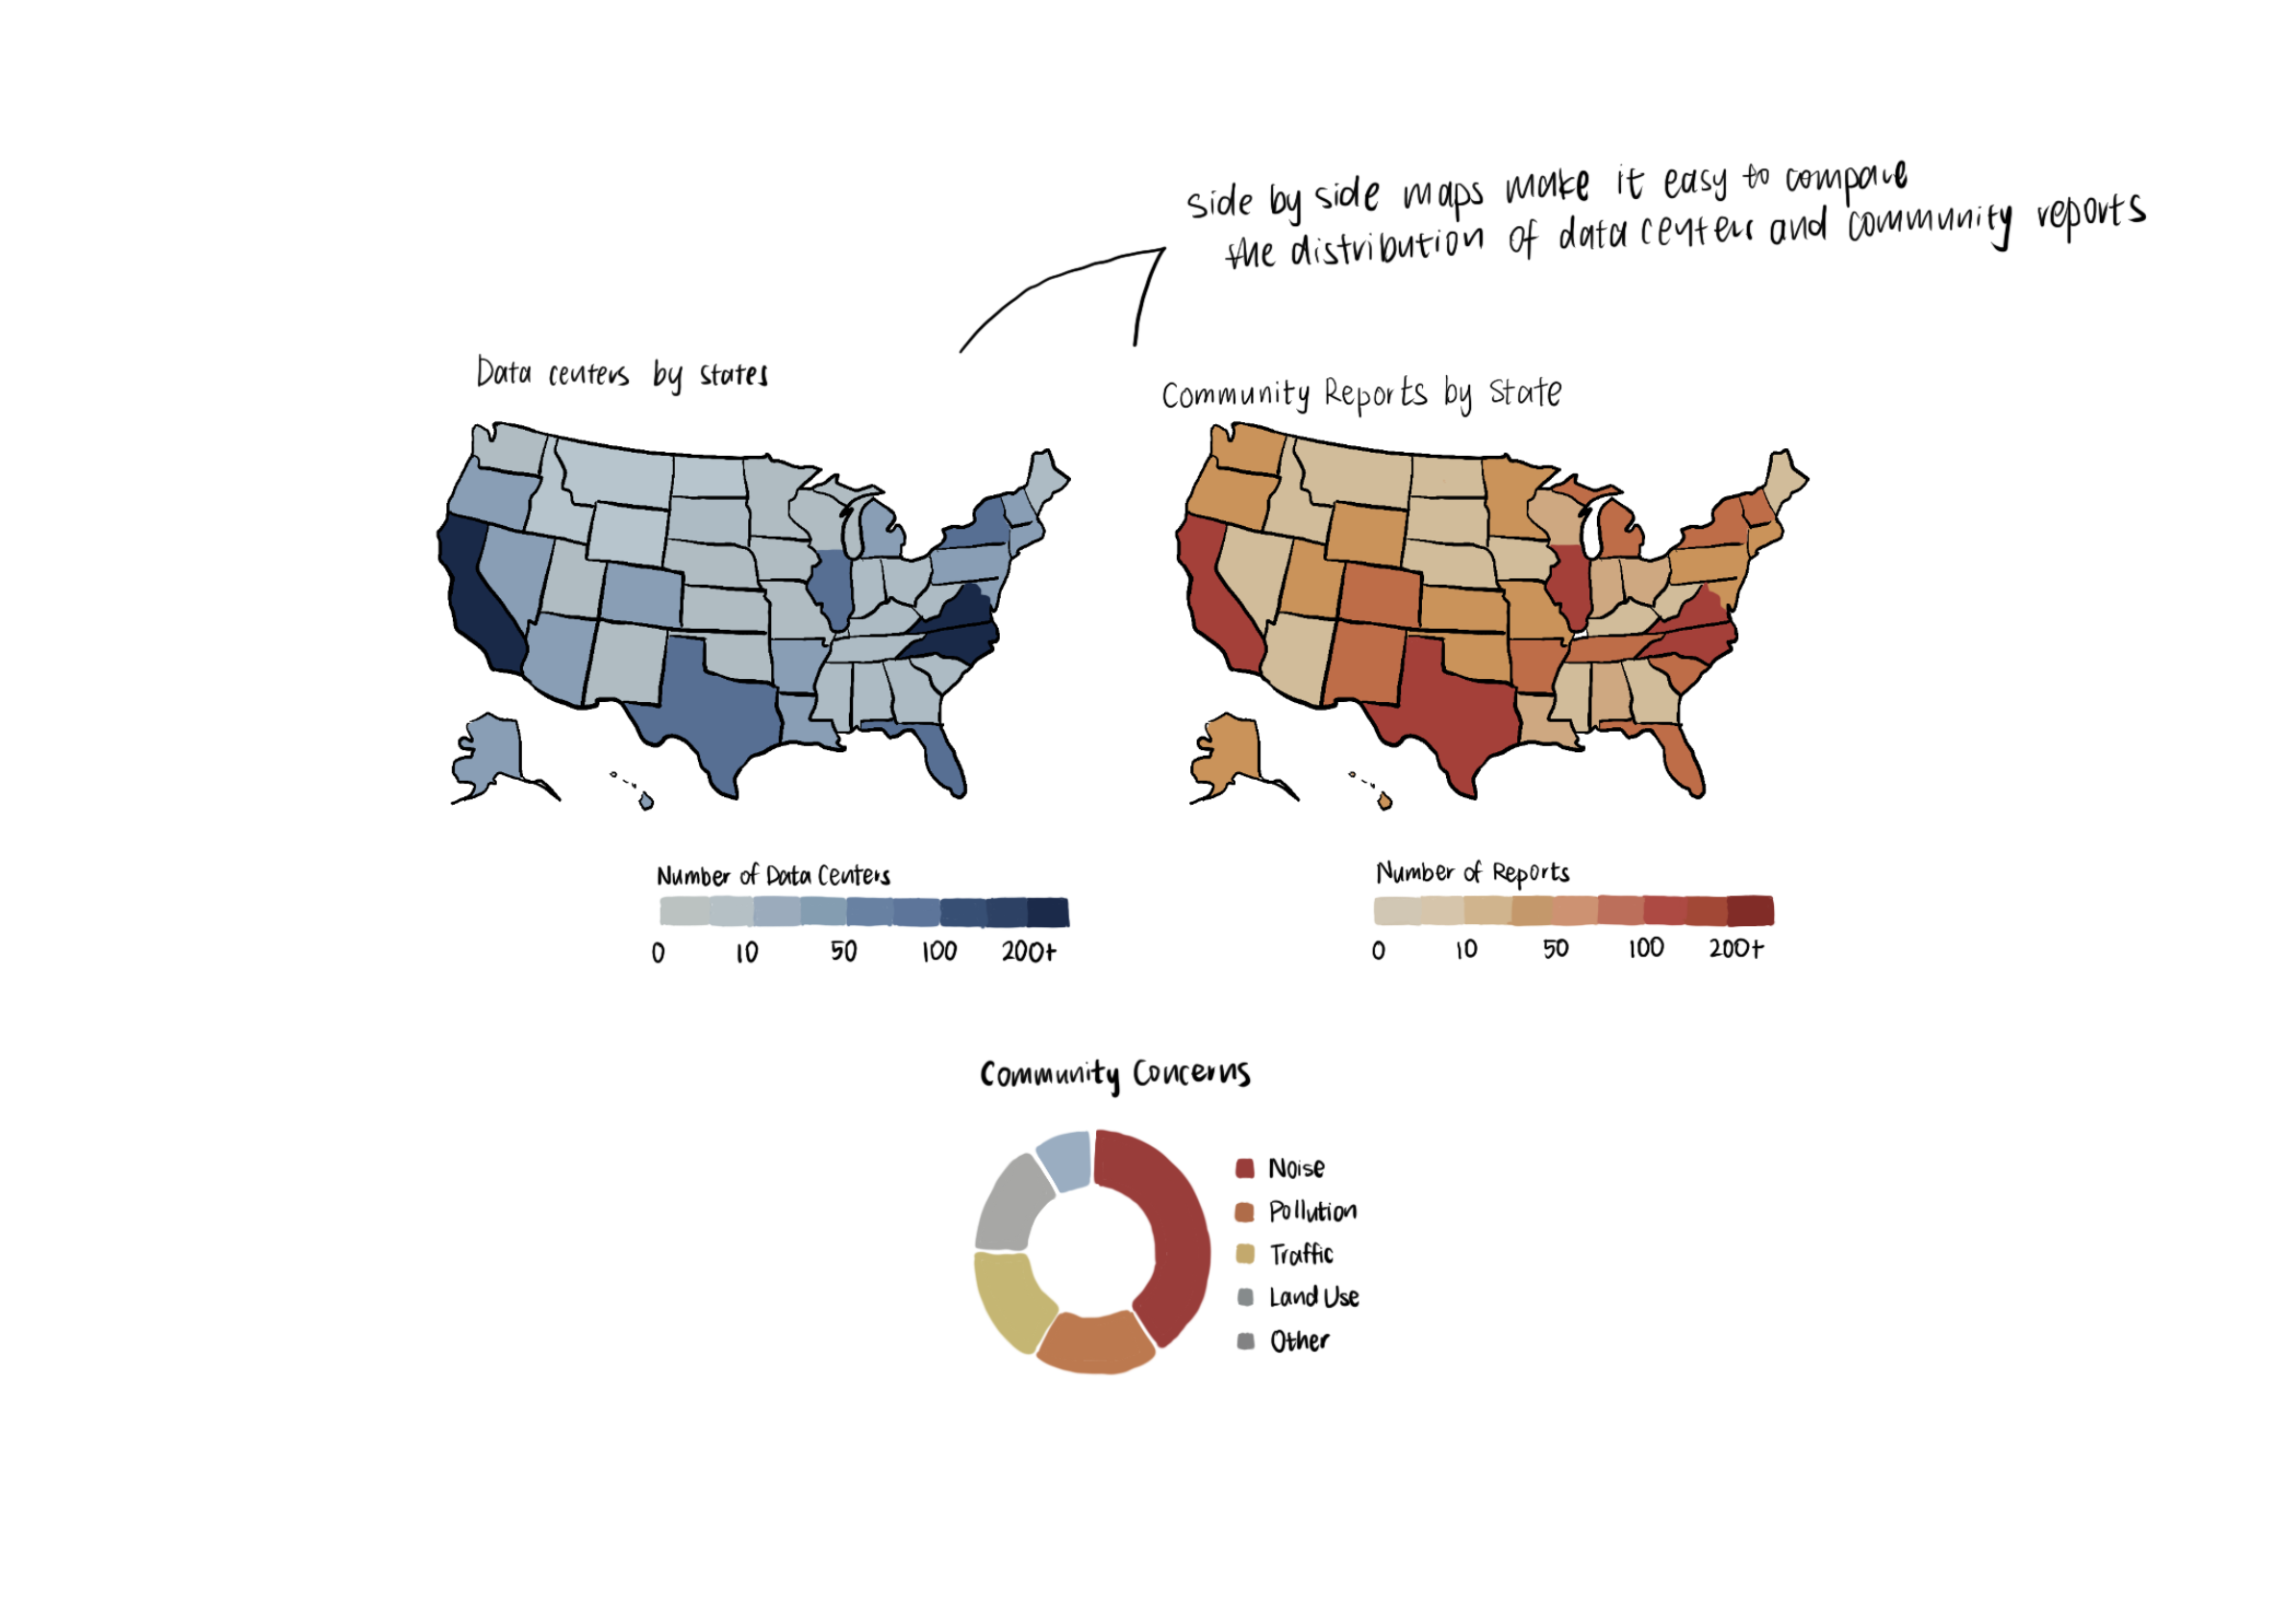
This design uses two choropleth maps to compare data center distribution and community reports by state. Darker colors represent higher counts. Supporting charts include a bar chart ranking states by data centers, a scatterplot comparing AI usage and community reports, and a donut chart showing the proportions of different community concerns.
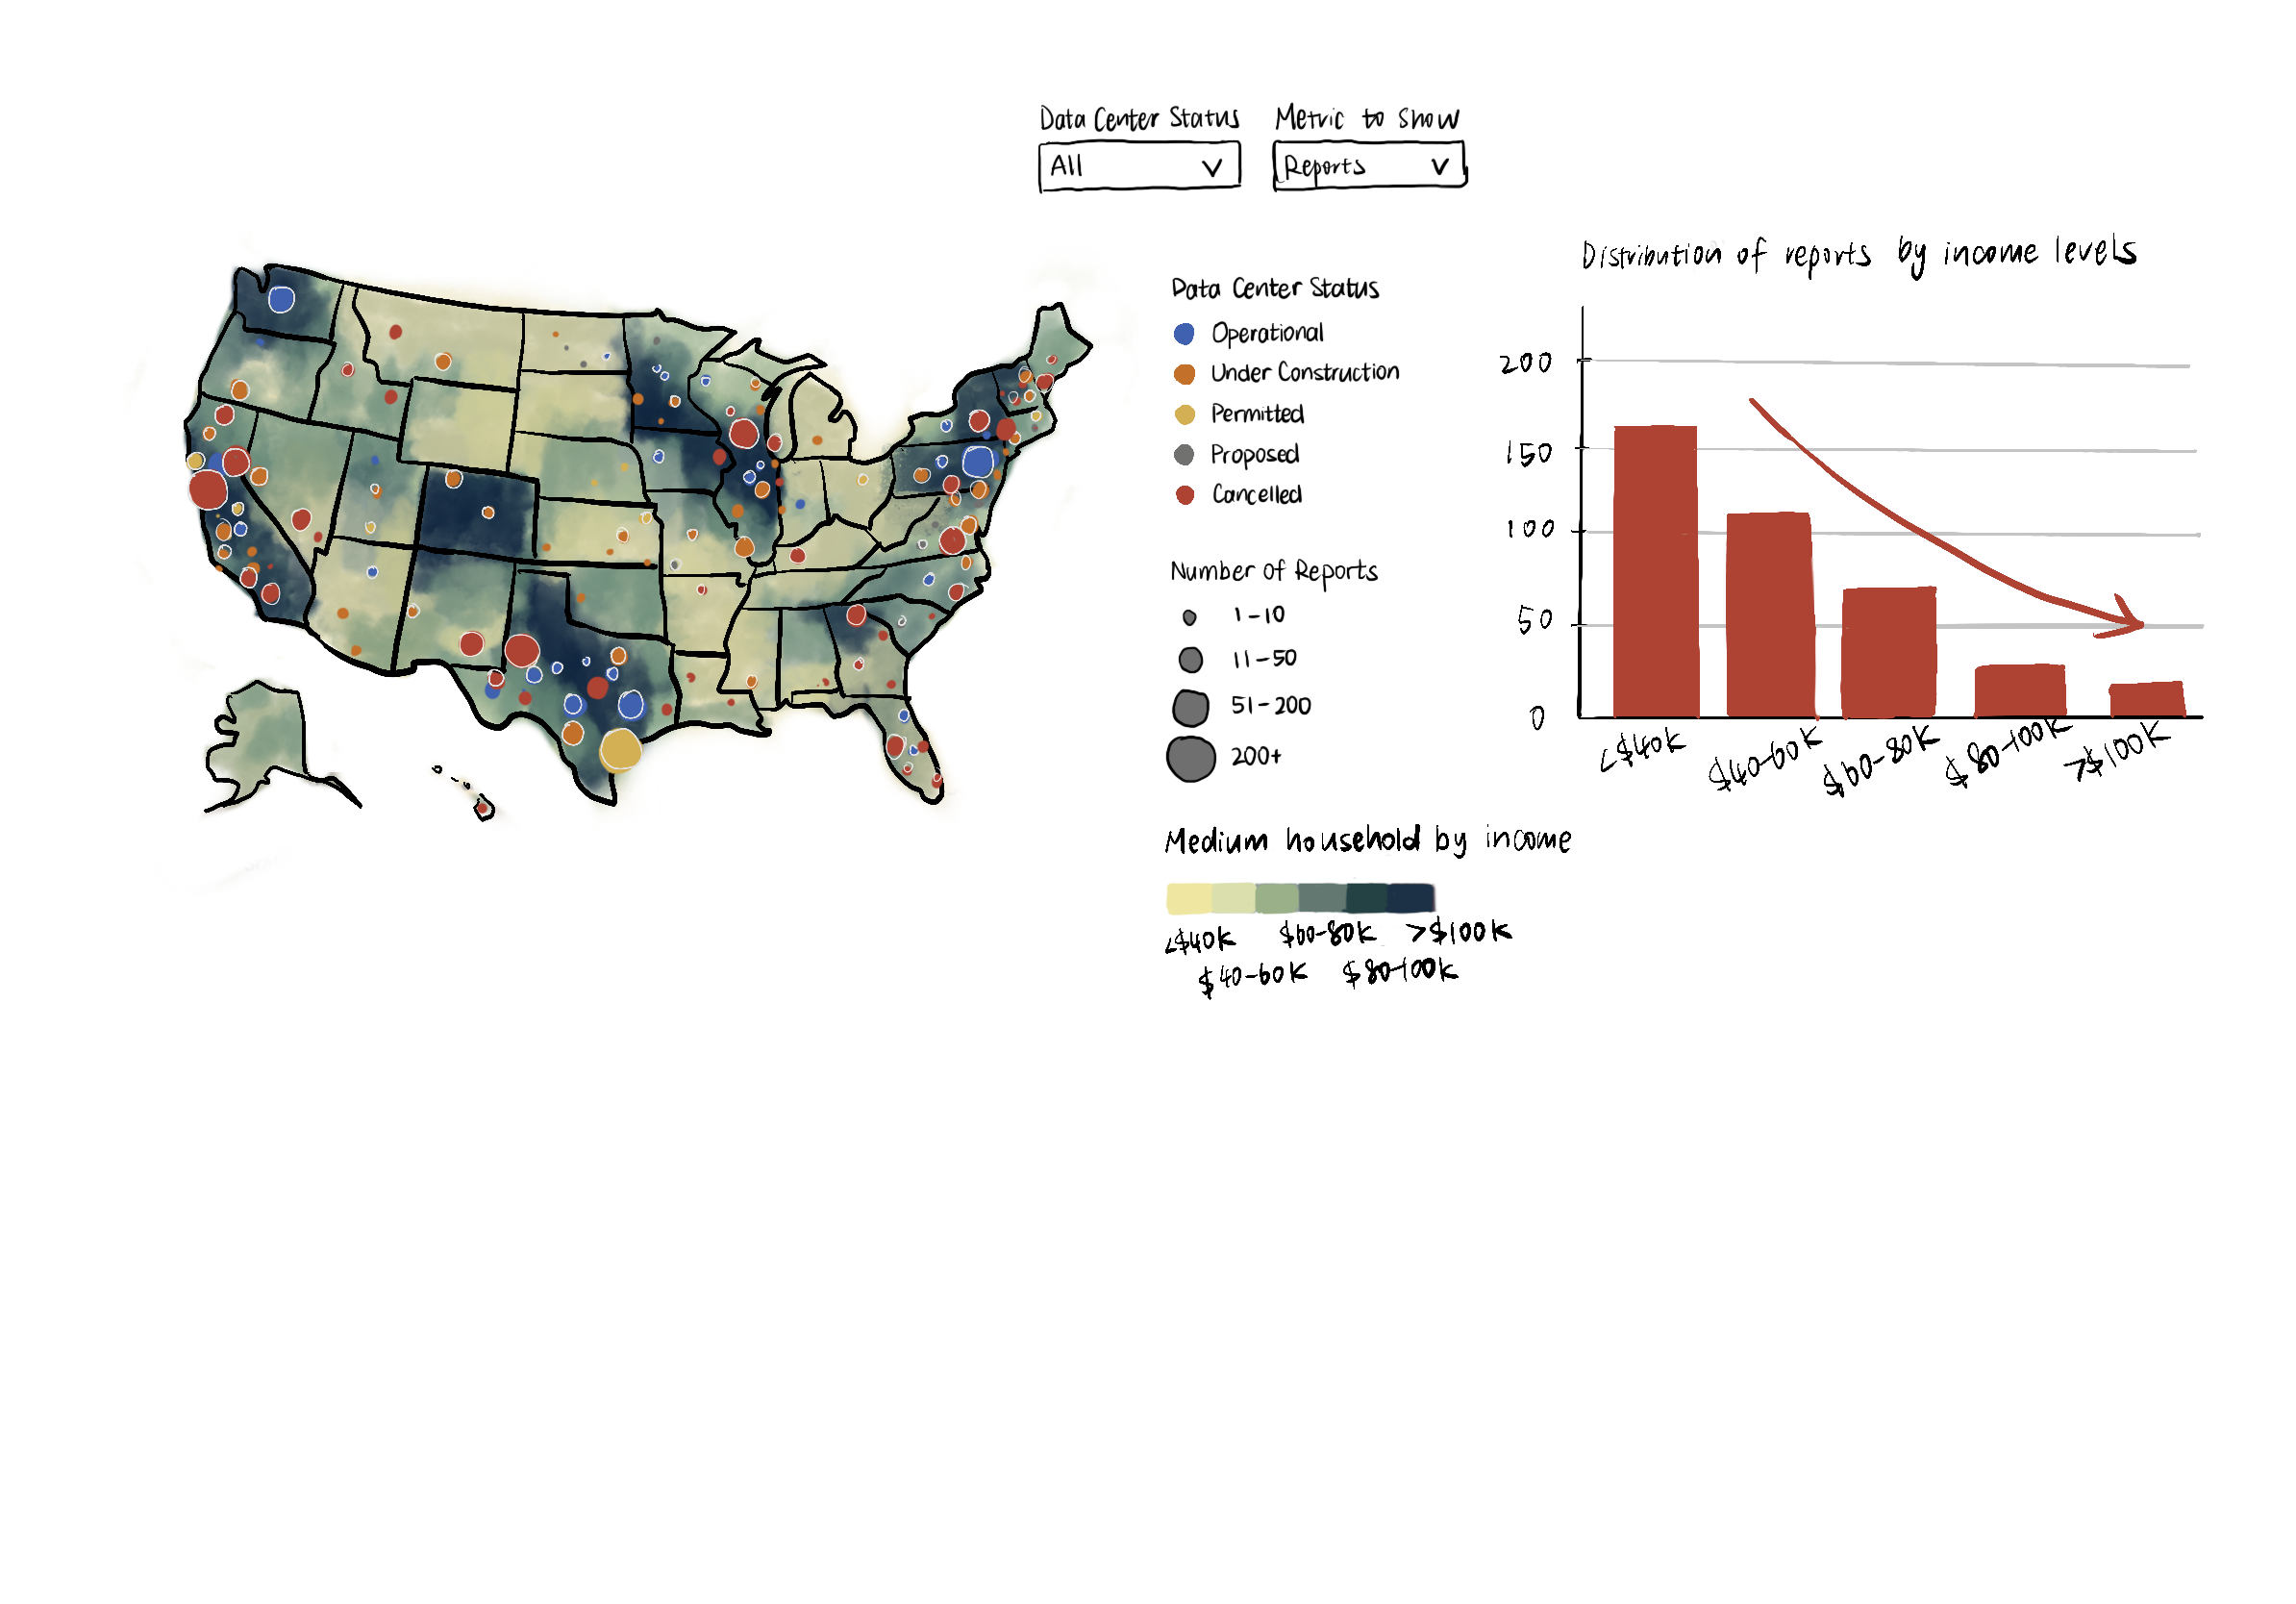
Final Design: Income-Level Map with Data Centers and Community Reports
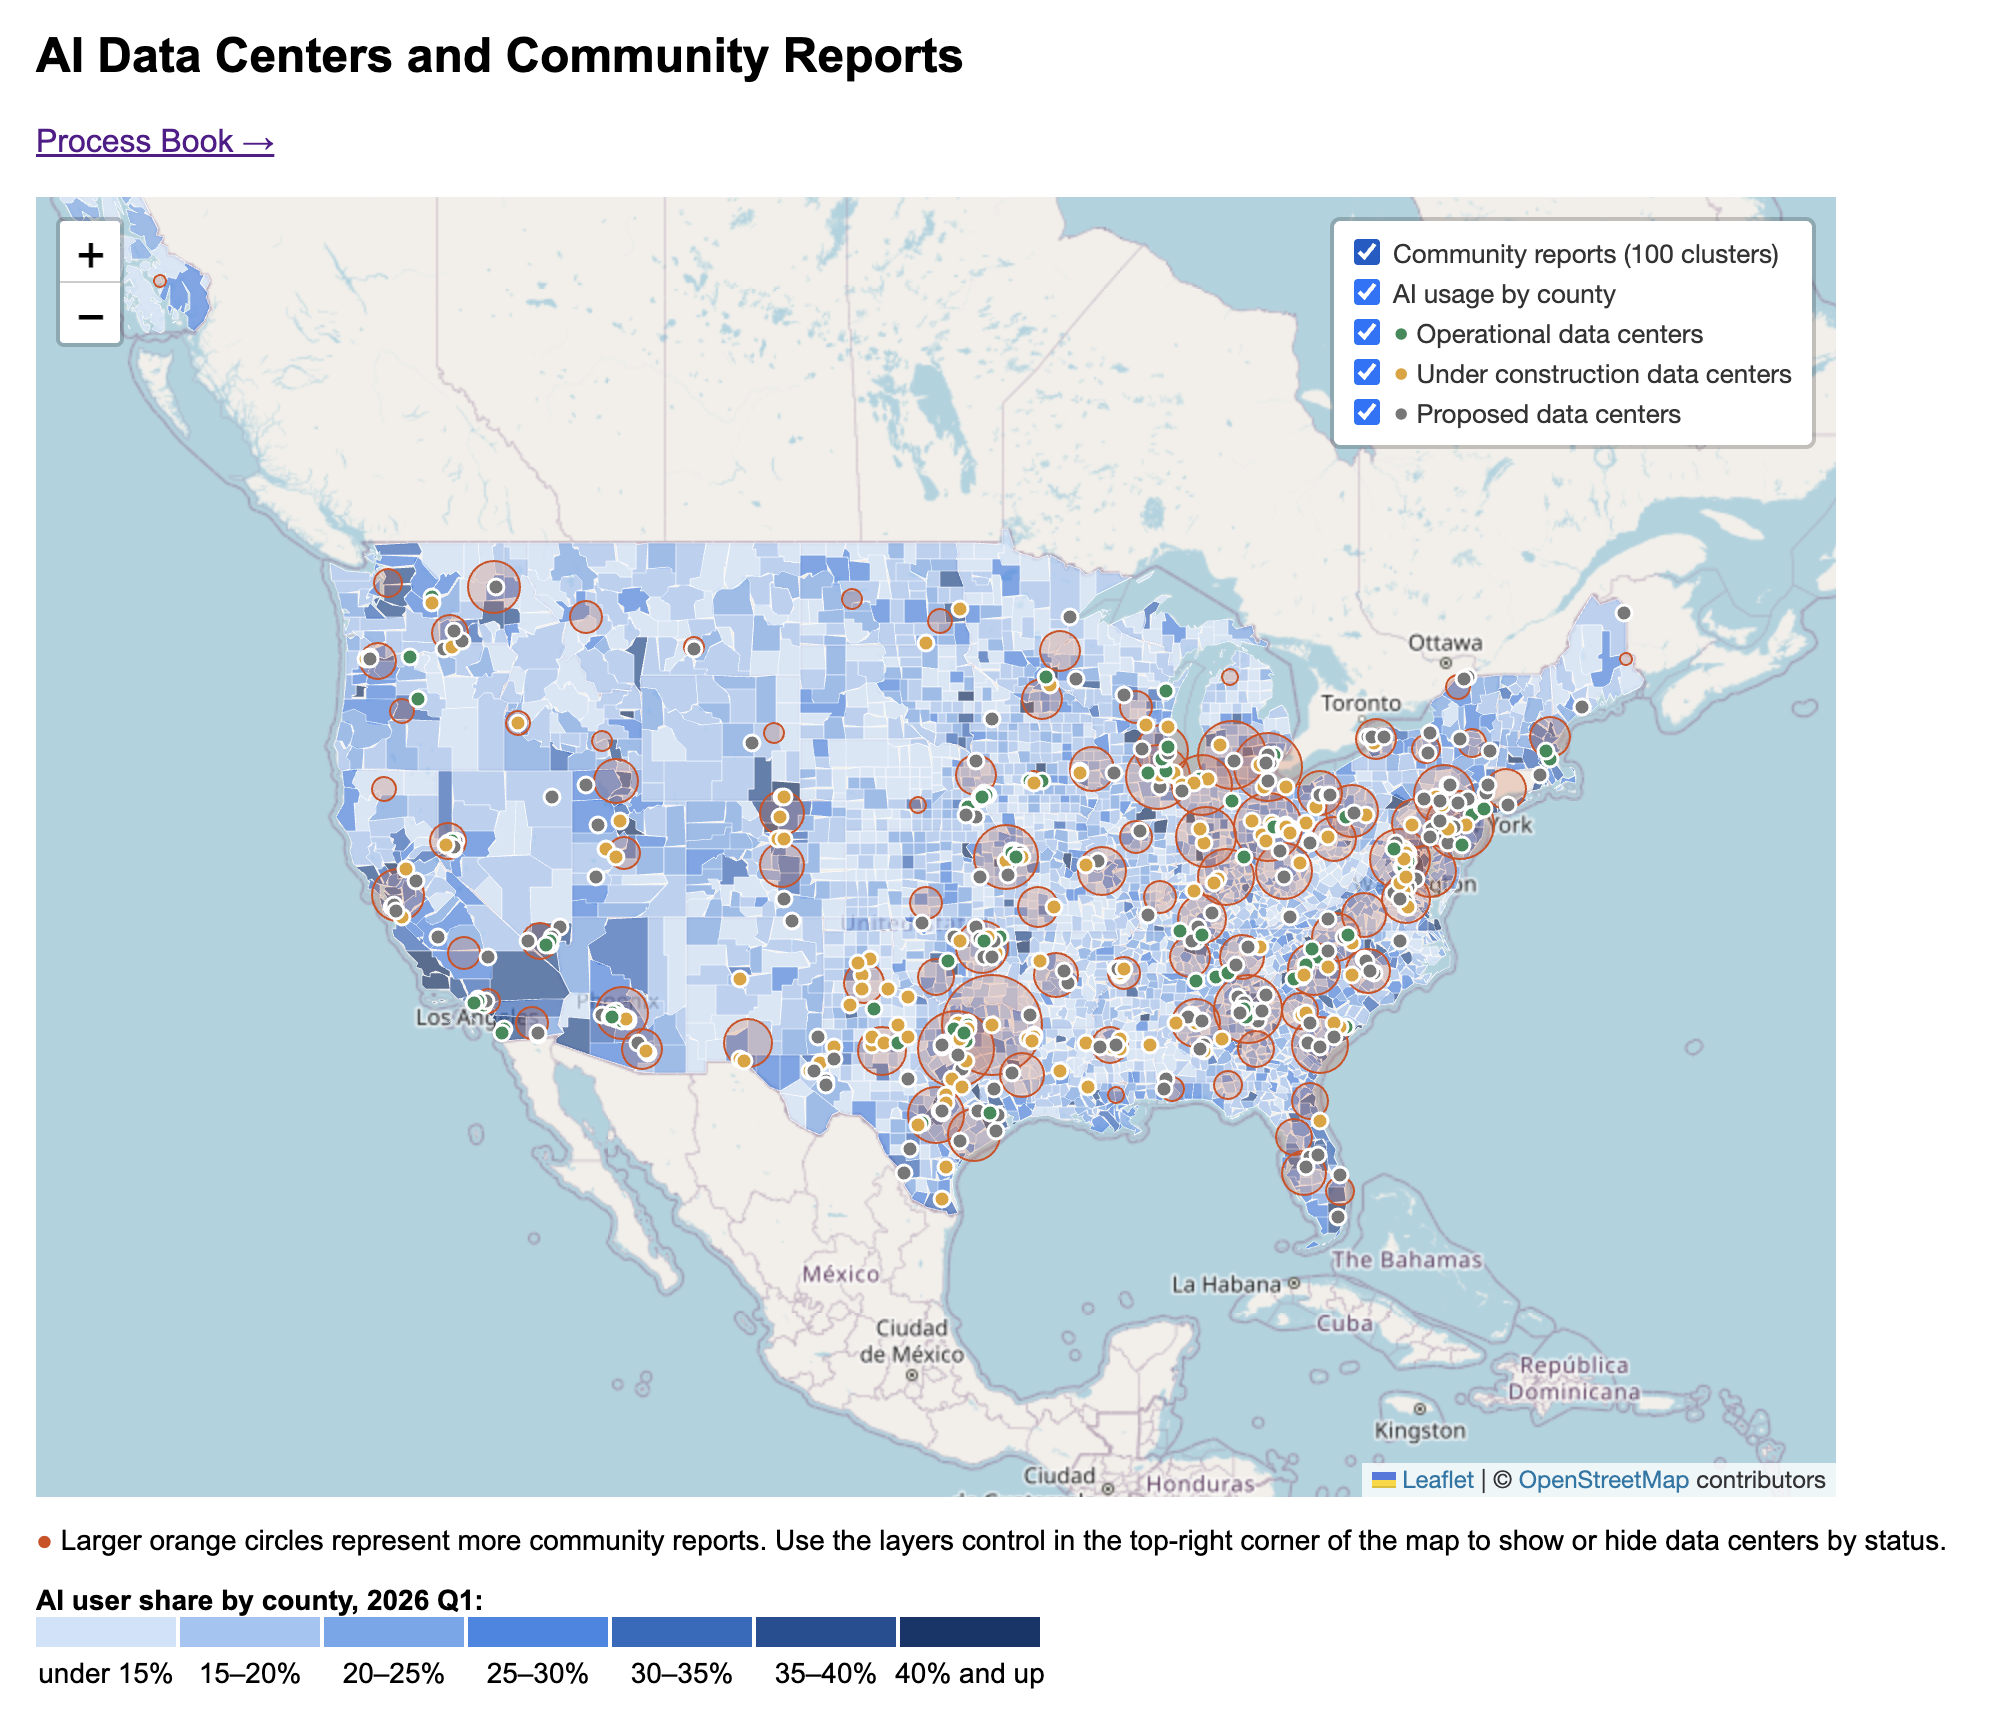
Main Map: Points show AI data center locations, colored by status. Orange circles represent 100 k-means clusters of community reports. Each circle is centered on its cluster's centroid, and its area is proportional to the number of reports in the cluster. Clicking a point or circle opens a popup with details, and either layer (AI data centers; community reports) can be toggled on or off. (Not implemented) Uses color intensity to represent county-level income, with darker shades indicating higher income.
Income Levels: (Not implemented) Counties are grouped into income ranges (e.g., below $40k, 40k–60k, 60k–80k, 80k–100k, and above $100k) to compare community impacts across different economic groups.
Milestone 1 Updates
See data section for data processing
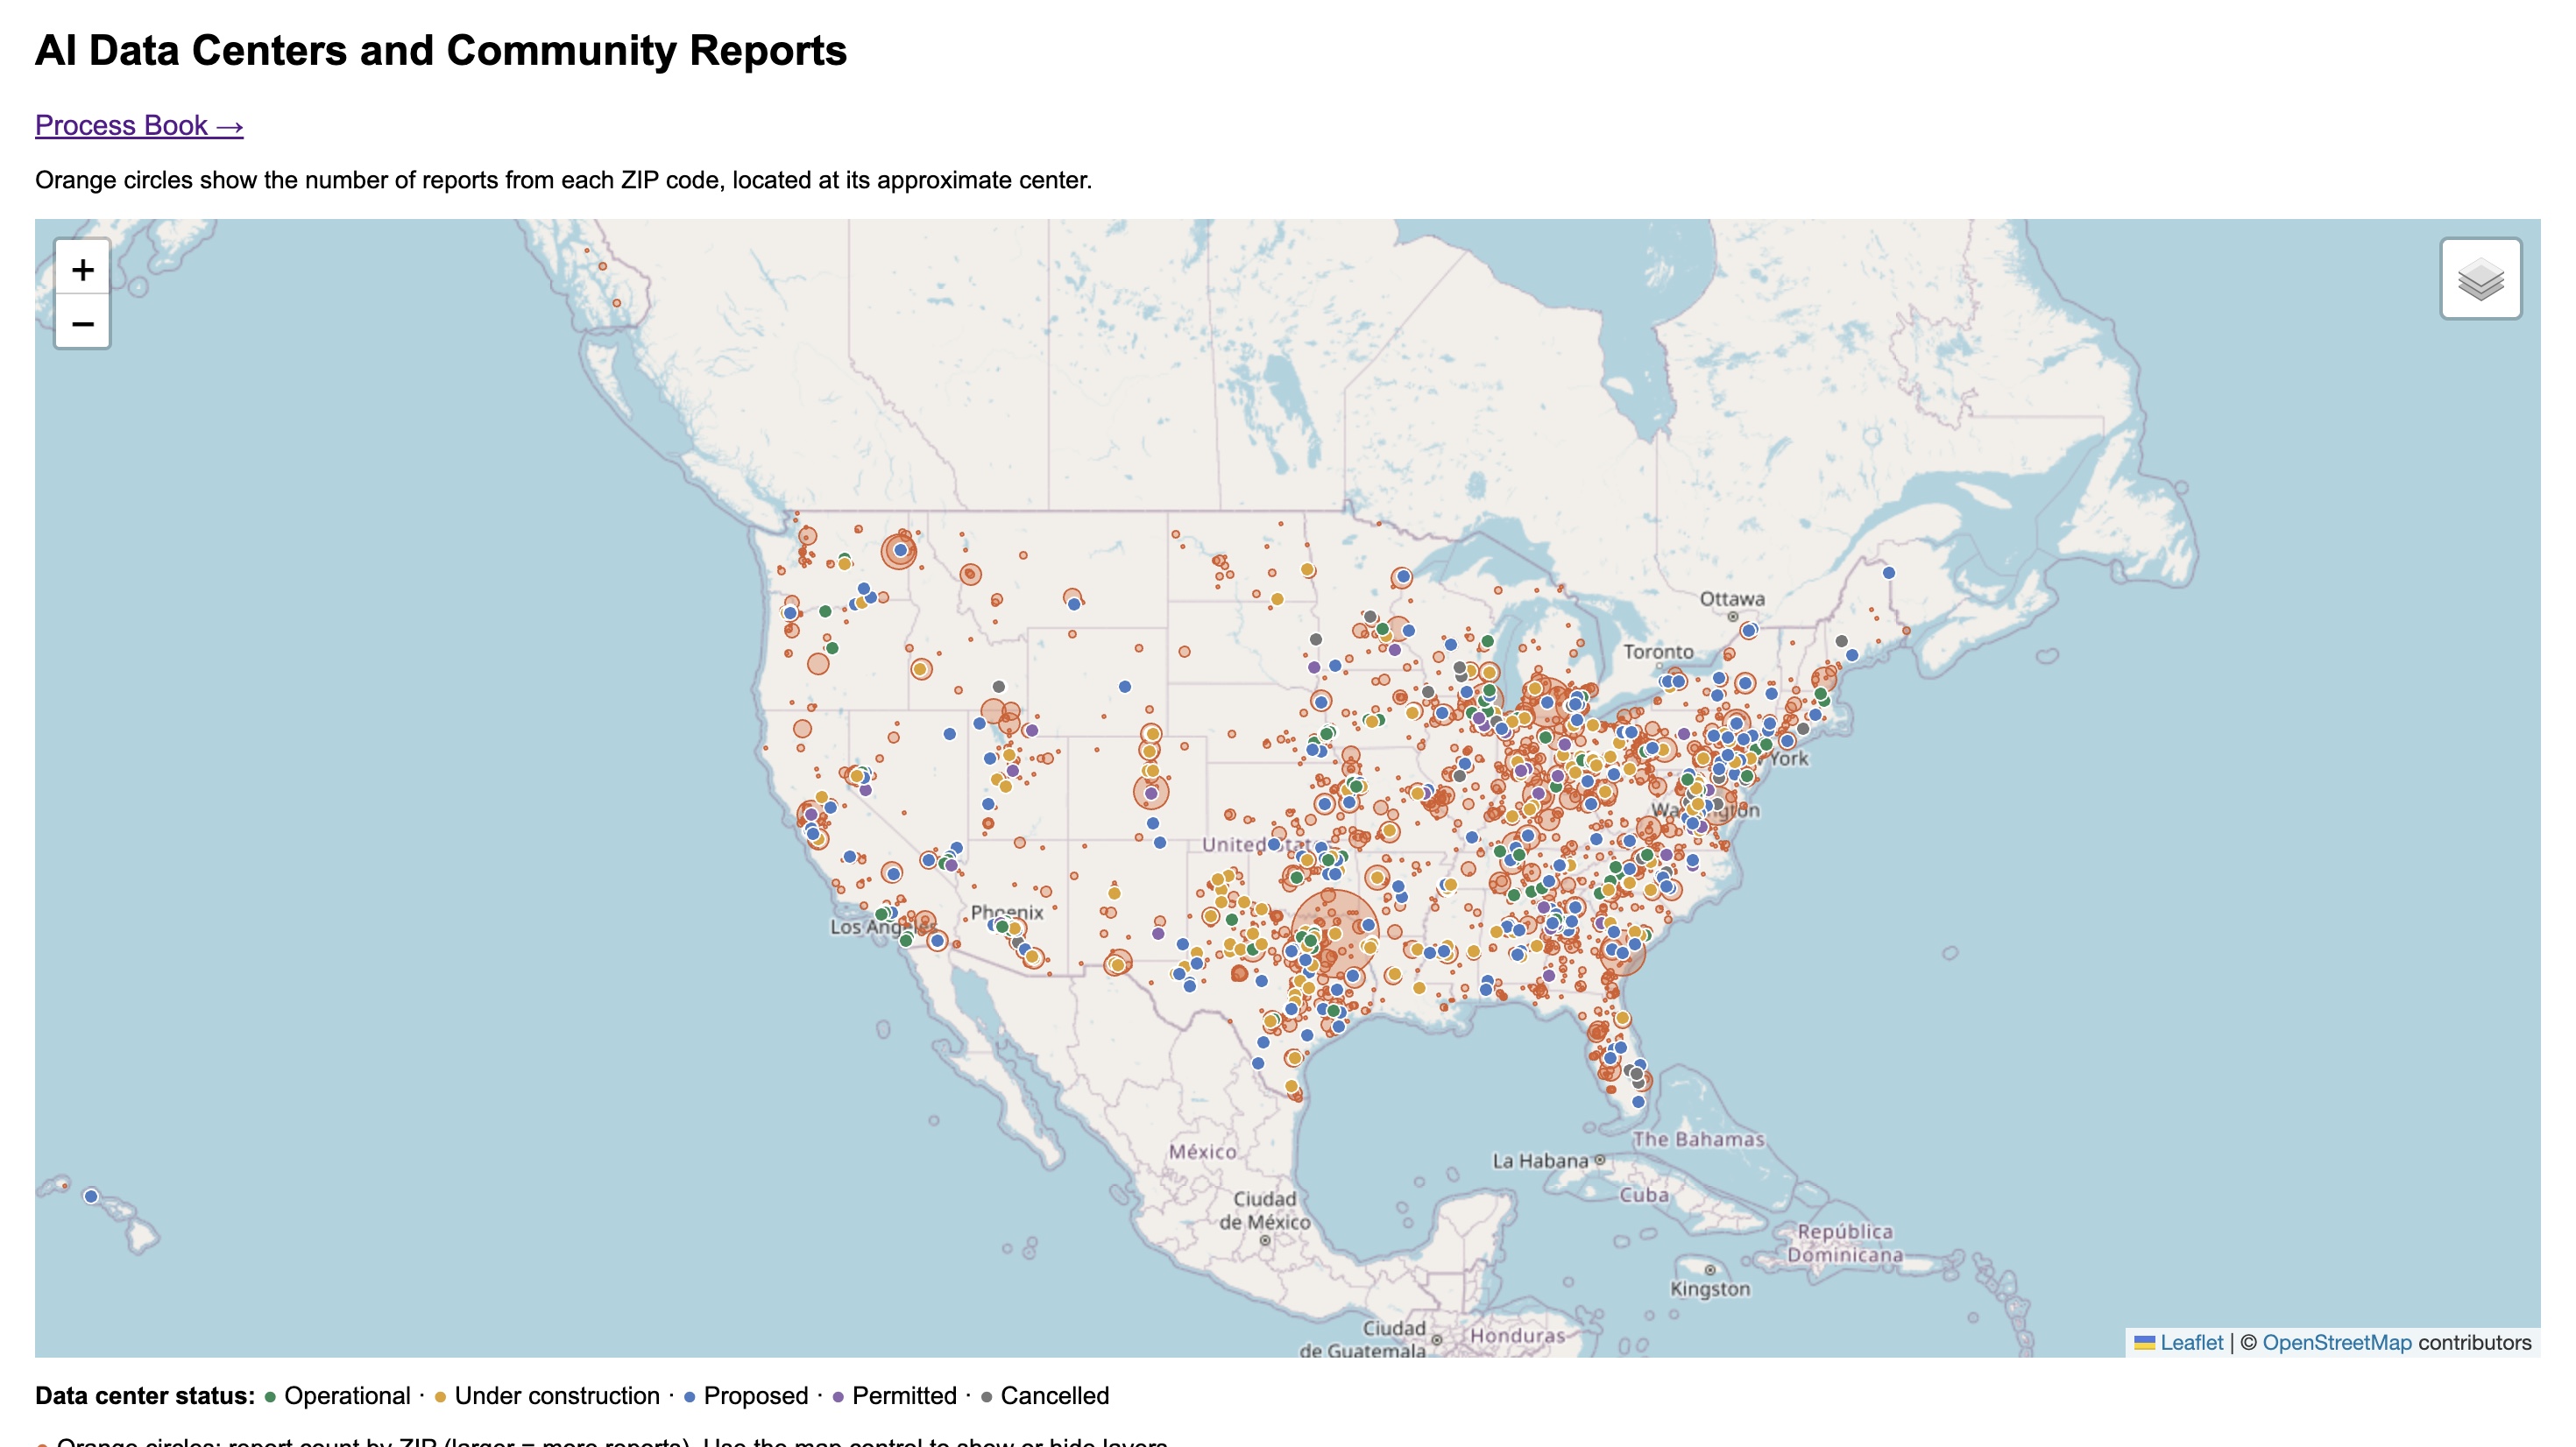
Our current prototype uses Leaflet to create an interactive U.S. map with OpenStreetMap tiles. We use D3 to load the cleaned CSV datasets and scale report circles based on the number of reports.
Data Center Layer
Data centers are displayed as small circle markers using their geographic coordinates. Different colors represent operational, under construction, proposed, permitted, and cancelled statuses. Clicking a marker opens a popup showing the data center's name, location, and status.
Community Report Layer
Community reports are grouped into 100 geographic clusters using k-means. Each cluster is represented by an orange circle positioned at its centroid. Circle area is proportional to the number of reports in the cluster. Clicking a circle displays the nearby place, number of reports, number of ZIP codes, and average distance of reports from the cluster center.
Interactions
Users can zoom and pan around the map to explore different regions. A layer control allows users to independently show or hide data centers and community reports. Popups provide additional information without overcrowding the map.
Milestone 2 Updates
County-Level AI Usage
We added a choropleth layer showing the share of AI users in each county in the first quarter of 2026. Darker blue shades indicate a higher share.
Data Center Status Toggles
The map's layers control now lets users show or hide proposed, operational, and under-construction data centers independently. This makes it easier to focus on one status when markers crowd the map. We also removed markers for cancelled and permitted data centers.