Overview & Motivation
“A Hungry World” visualizes the imbalance between global food production, food waste, and food insecurity. Our goal is to make the scale of food waste tangible and show how much of it could be redirected to solve hunger. The motivation came from a shared interest in addressing global food inequality and sustainability.
Even though the world produces enough calories to feed everyone, distribution inefficiencies and waste lead to chronic hunger. By visualizing data, our project aims to highlight both the magnitude of wasted resources and their potential to meet human nutritional needs.
Research Questions
- What is the current severity of food insecurity in different regions of the world?
- How does the current volume of food production and the current volume of food loss/waste compare across regions?
- Which regions appear to be handling food production and distribution more efficiently (i.e., high production + low waste + lower hunger)? Which regions appear most vulnerable (higher waste or low production + high insecurity)?
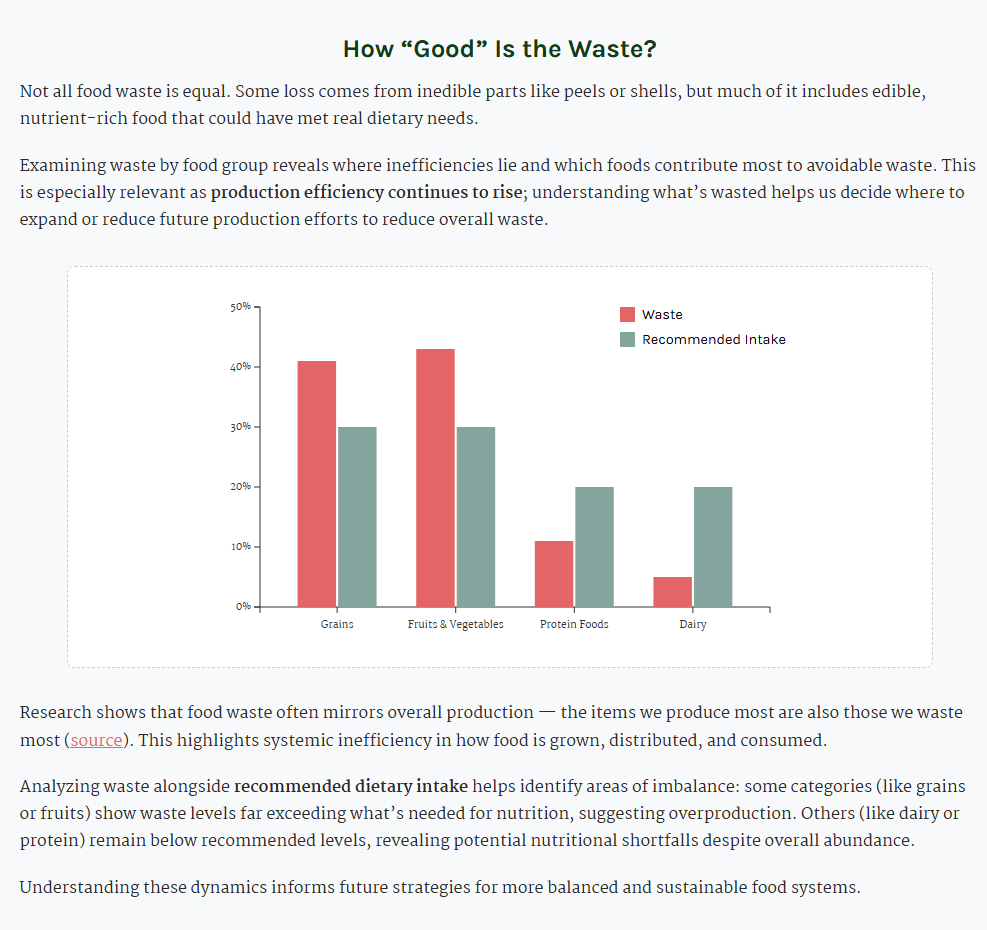
- What might the inefficiencies or food waste distributions suggest about possible interventions (i.e. is there a better way to distribute food, are we over or underproducing certain food groups)?
Data Acquisition & Processing
-
Food Waste:
World Population Review Food Waste by Country
The source provided an csv with food waste in tons by country. Since we categorizing our data by continents, we wrote a python script to aggregate total waste by continent (data/scripts/accWasteByContinent.py)
-
Food Insecurity Population:
FAO Food Security Data
The source provided an csv with number of food insecure people by region. We cleaned the data to only include the most recent year per continent.
-
Food Production:
Food and agricultural Organization
The source provided an csv with food production in tons by country. We wrote a python script to aggregate total production by continent (data/scripts/accProductionByContinent.py)
-
Recommended Daily Food Needs:
American Heart Association - Suggested Servings from Each Food
Group
We converted the recommended daily food needs from servings to kilograms based on average food weights.
-
Food Productivity:
U.S. Department of Agriculture
The gave an overview of production productivity that was mentioned in the background section
-
Food Waste Group Category:
Global nutrient content embedded in food losses and waste:
Identifying the sources and magnitude along the food supply
chain
The gave percentages of food waste by 8 categories in the results section. We combined group to correlate the groups on myPlate to be able to easily compare food group by waste ad recommended intake.
-
Recommended Intake by Food Group:
MyPlate
MyPlate is a commonly used model for daily food consumption. We manually added the categories by group.
Exploratory Data Analysis
We looked at various existing visualizations that tackled food waste and food insecurity separately. For example, this visualization shows the number of severely food insecure people by region across multiple years.
Another visualization we looked into honed in more on the sources and final locations of food waste, providing a more granular view of the issue. We thought the design of this visualization effictively showed the flow of food
Design Evolution
We explored multiple layout options — including a world map, stacked bars, and flows in the brainstorming stage. We settled on the flow chart with other visualation aids such as a total bar.
Implementation
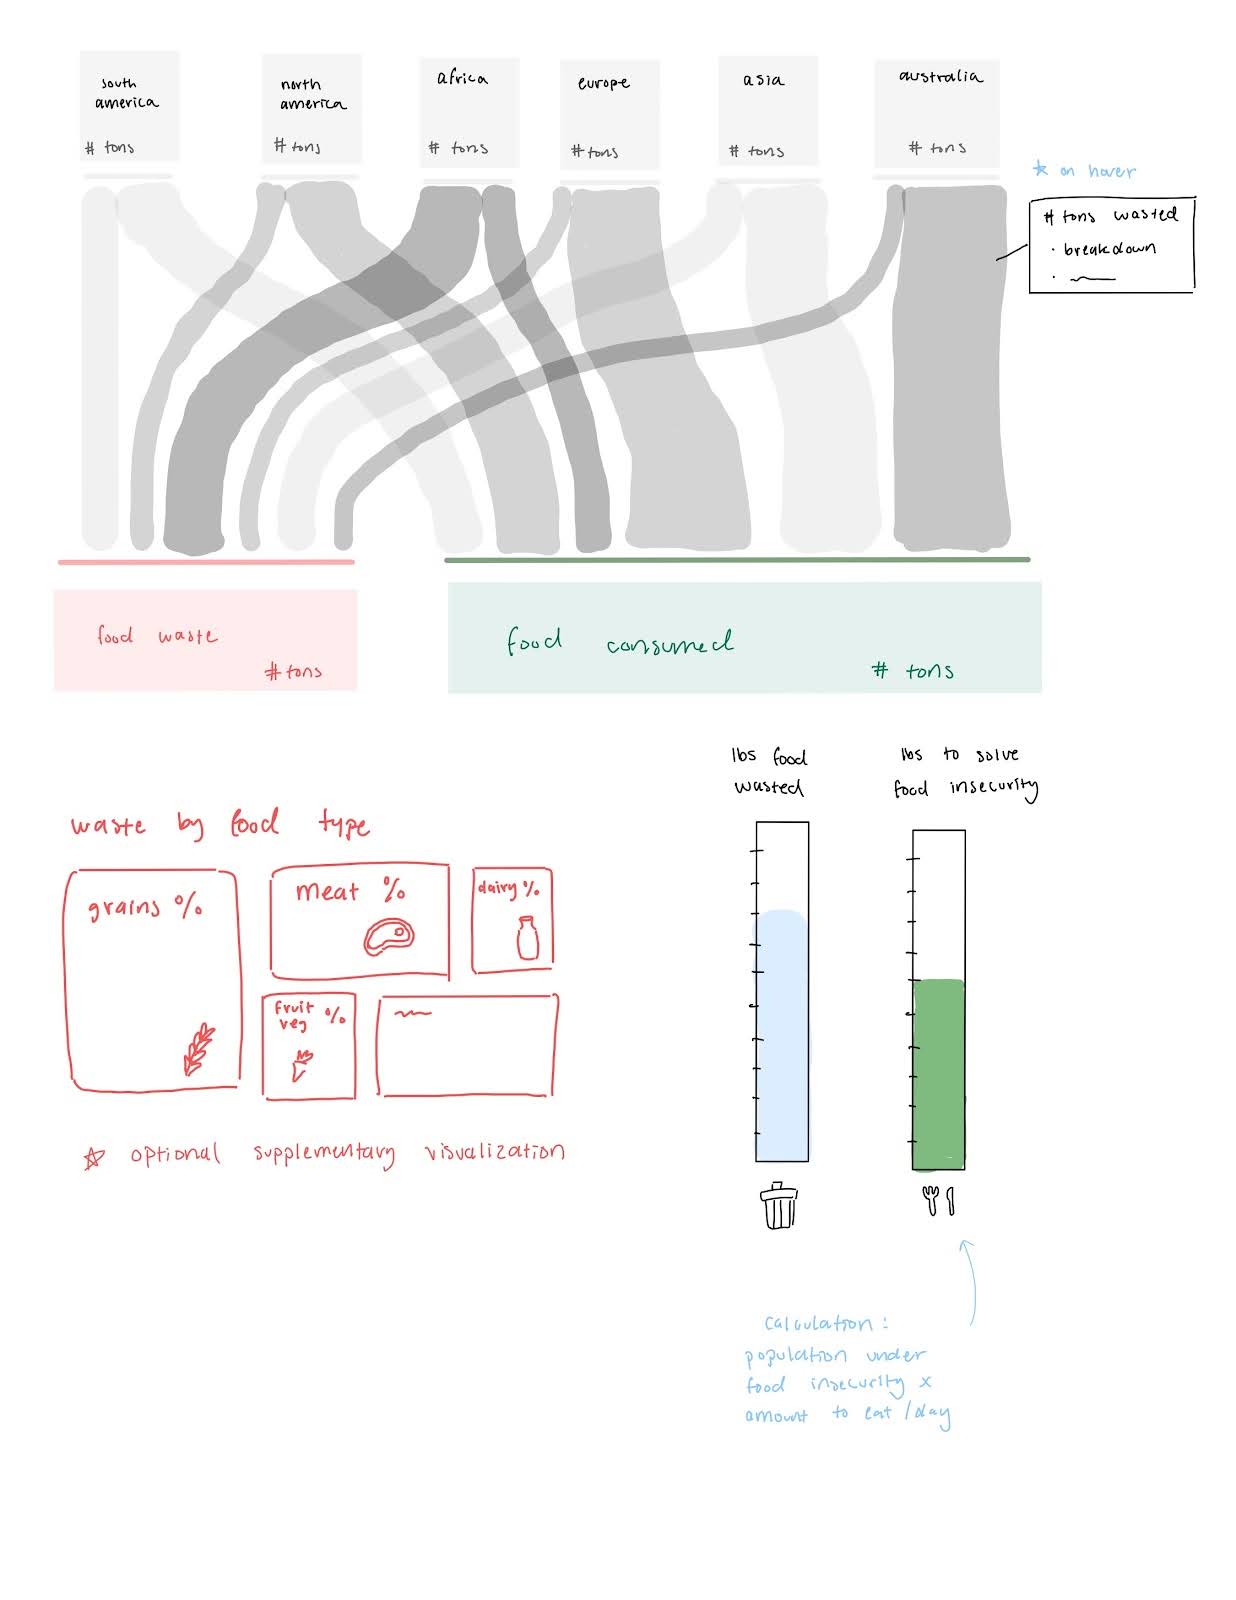
Inital Proposed Design -- milestone 1 aimed on creating the bottom right visualization
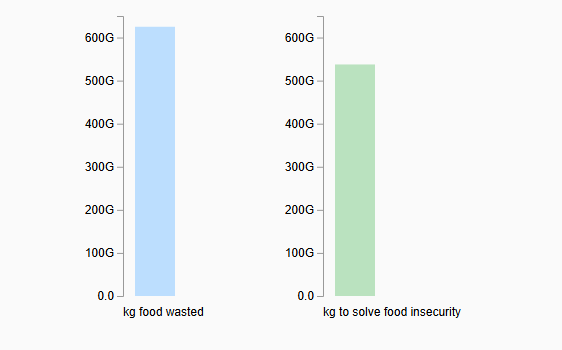
Milestone 1: Prototype screenshot
Our current prototype implements an object-oriented D3.js structure, where each bar chart is managed by its own FoodBarChart class. These bars allow us to see side by side how much food is wasted and how much food we need to resolve food insecurity.
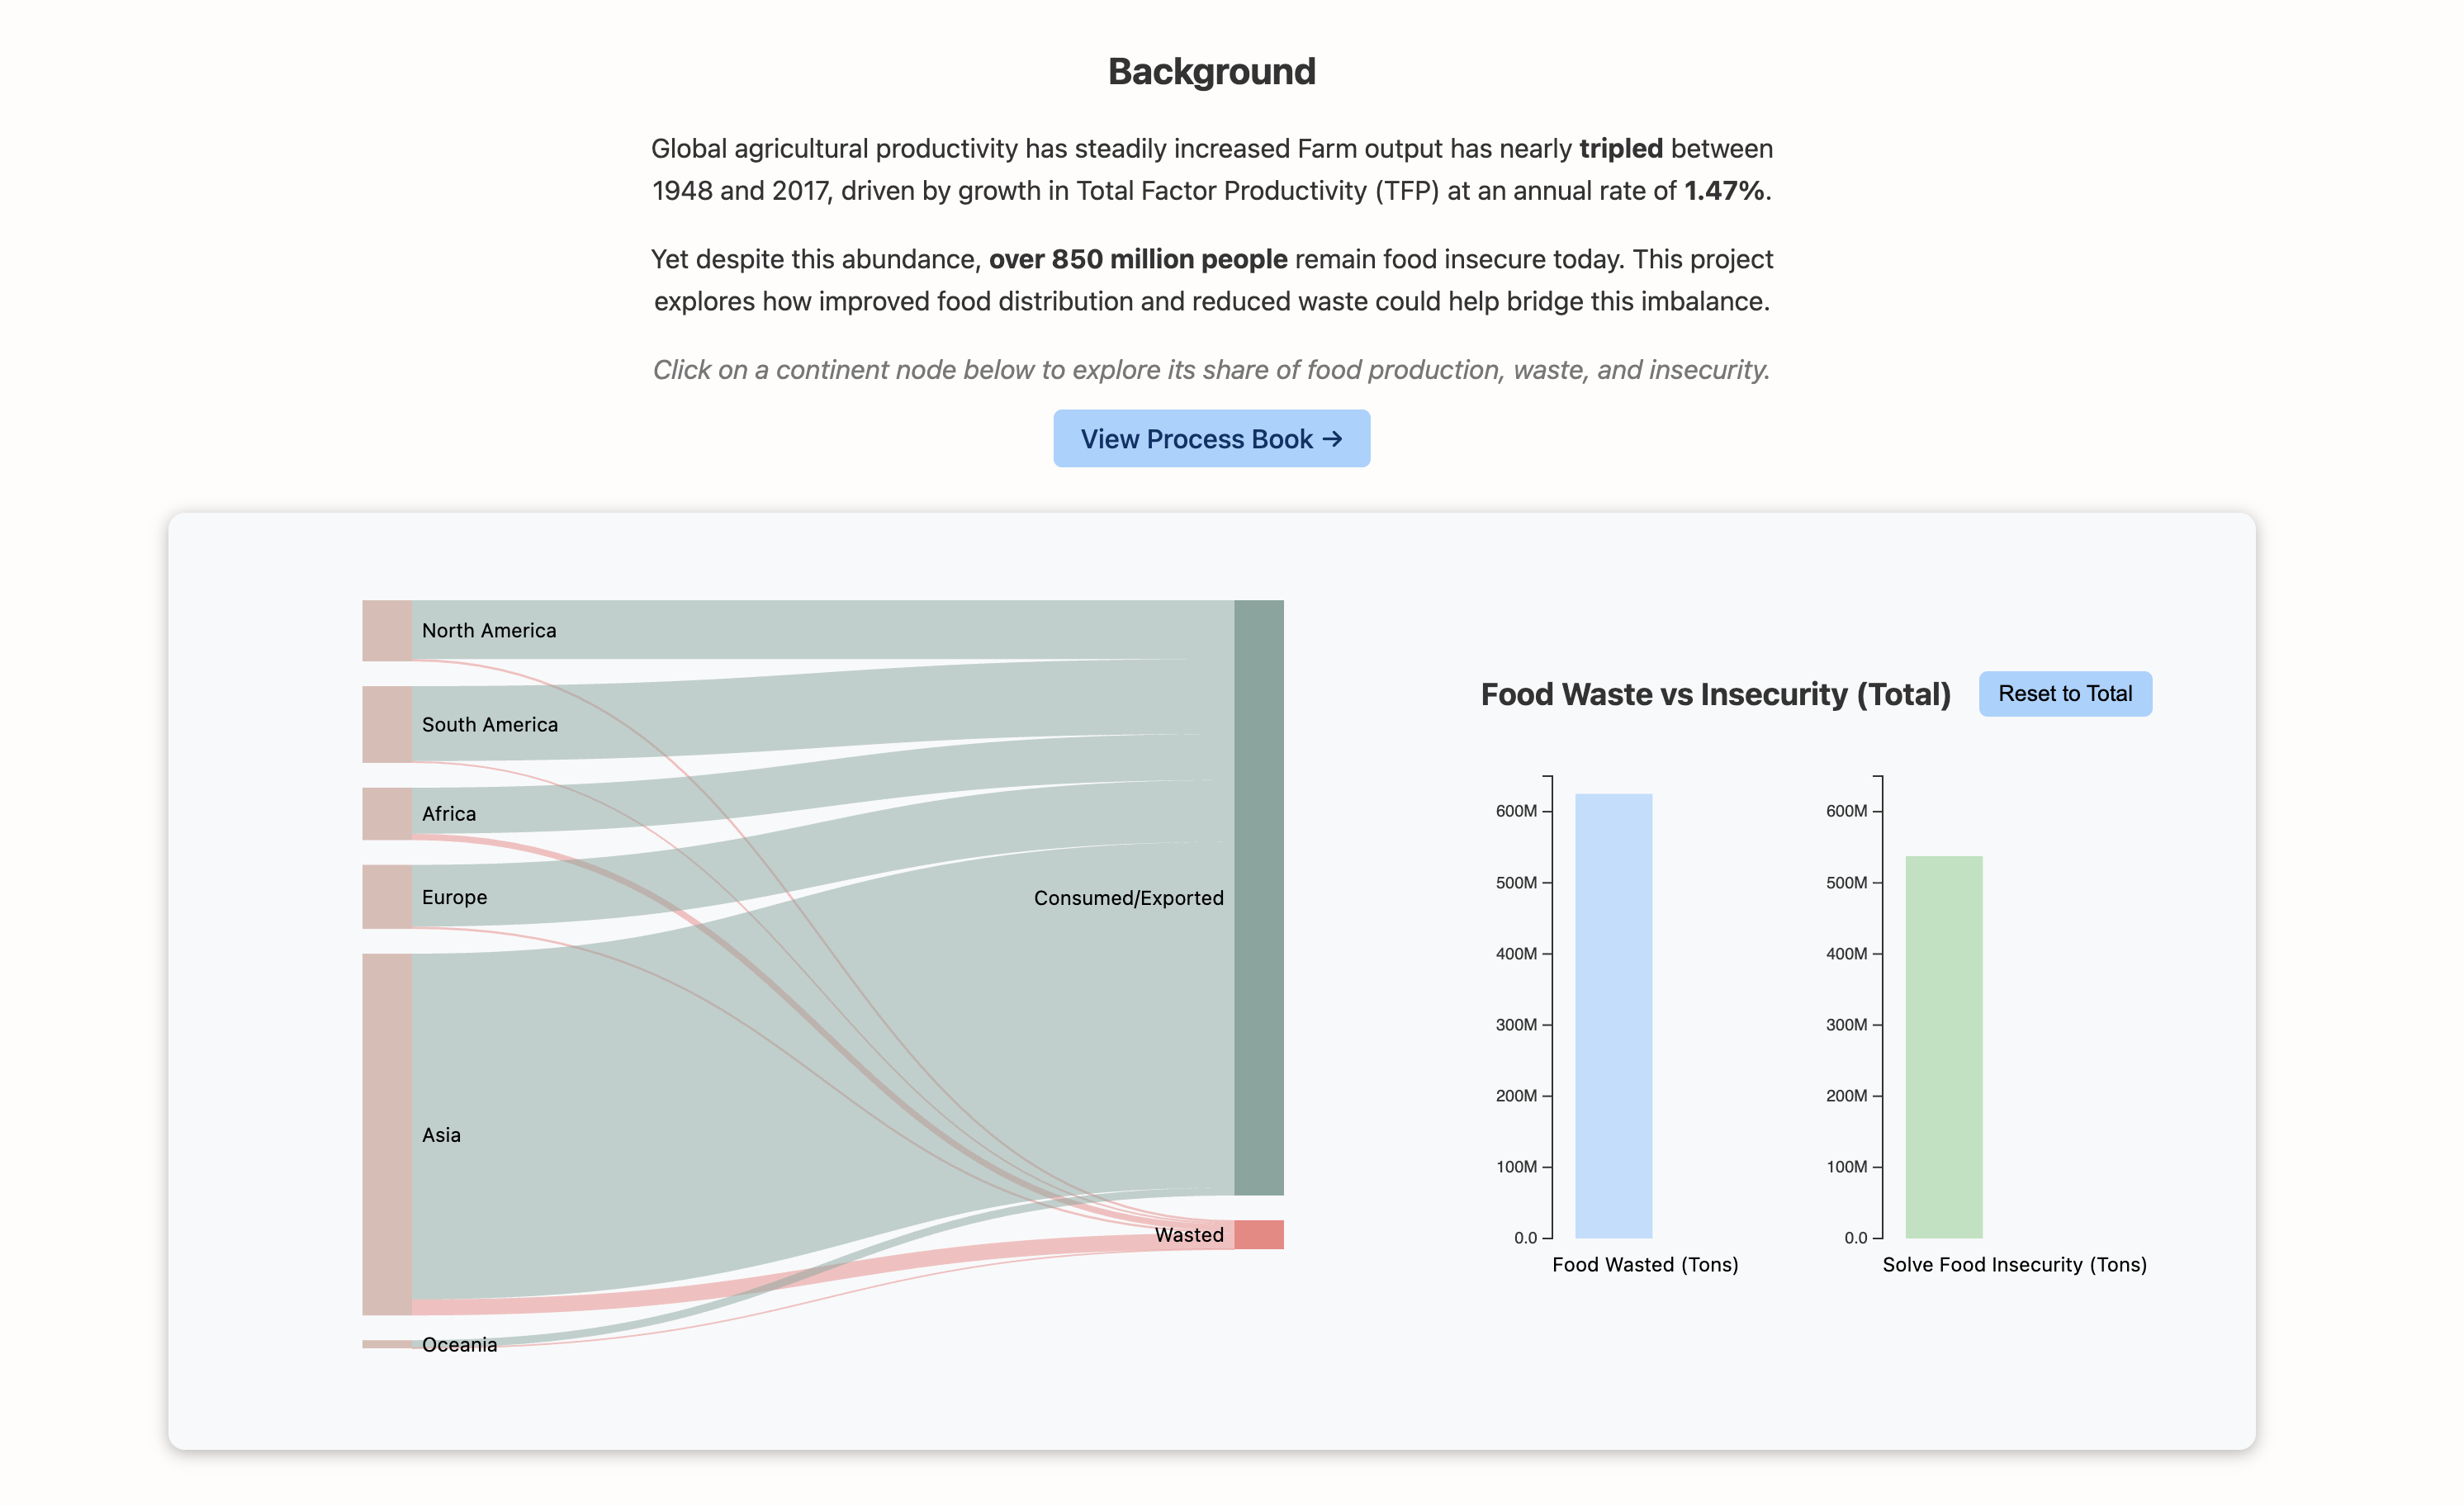
Milestone 2: Expanded Prototype
In Milestone 2, we extended our prototype to include an interactive Sankey diagram illustrating the flow of food from production to waste across continents. We also linked the Sankey diagram to the FoodBarChart components, allowing users to click on a continent node and dynamically update the bar charts to display that region’s food waste and insecurity levels. This milestone focused on enhancing interactivity and providing a clearer comparison between global and regional food distribution.
Final Implementation:
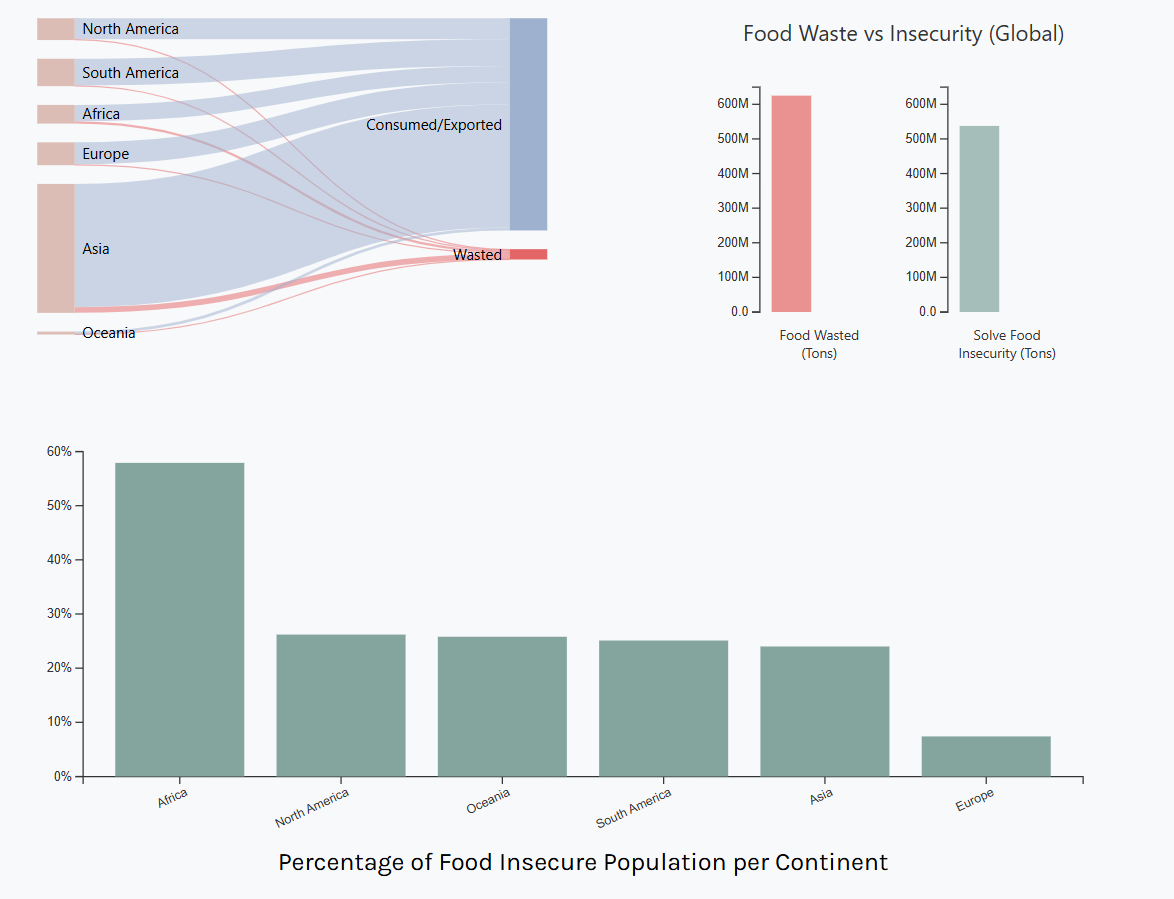
We refined visual aesthetics for our visualizations and improved user interactivity. We included additional information regarding our data calculations, findings, and sources. Additionally, we added 2 more visualizations to further explore and connect data regarding food insecurity in different regions of the world and how different regions are handling distribution more efficiently.
Evaluation & Insights
From our Milestone 1 Bar Chart, we observed that total food waste can substantially reduce the amount of people suffering from severe food insecurity. This early finding reinforces that food scarcity is not solely a production problem but a distribution and efficiency issue.
With the implementation of the Sankey diagram, we were able to visualize the distribution of food production and waste across continents. From this, we observed that Asia had the largest proportion of global food waste . However, this trend is likely influenced by population size rather than inefficiency alone.
To further explore this relationship, we added interactive functionality allowing users to click on each continent nodeto adjust the accompanying bar charts. This feature isolates regional data, revealing that all continents except Africa have enough wasted food to theoretically resolve food insecurity within their own borders. This insight highlights that redistribution on a domestic or regional scale— rather than international trade — could meaningfully address hunger.
Additionally, North America and Europe showed significant gaps between food waste and the amount needed to eliminate food insecurity. This suggests these regions could both reduce domestic waste and support trade-based redistribution, offering potential pathways for more equitable food distribution.